Choropleth Maps Color Placement Geography 59 May 24


 is used for fullcolor printing ● One")


 Do")


- Slides: 34
Choropleth Maps, Color & Placement Geography 59 May 24, 2007 Refer to: Krygier & Wood, pages 202 -225 Krygier & Wood, pages 255 -271 Monmonier, pages 163 – 173 (+ plates)
Notes & Review ● ● ● Homework 4, Part II due May 31 st Extra credit next week (Projections) Graded Lab 3 – overall very good ** Review type placement and labels in K & W, (page 245)
Choropleth Mapping ● ● ● A map that uses different colors to show some phenomenon varies across space. Often, choropleth maps are based on raw data that has been standardized in some way Data is categorized into classes (legend)
Choropleth Maps Data source? Title?
Data Classification – common methods 1. Equal Intervals, Equal Steps 2. Quantiles 3. Natural Breaks Other methods include algorithm-based analysis, mean-sd, clustering Lab #4 is a sequential set of data (years)
How does the data look?
Equal Intervals If you have raw numerical data (Lab #4 does not work this way), compute your intervals: range of data = high – low # of classes = # classes example: 58. 5 – 0. 7 = 11. 56 5
Quantile Division Each division has an equal number of observations
Natural Breaks Visual inspection helps adjust classes – use a histogram or dispersion graph
Colors are important too
The Electromagnetic Spectrum
Visible Light
Color: Human Perception The Dimensions of Human Color Perception HUE: The electromagnetic energy wavelength (color) VALUE: lightness or darkness of hue SATURATION: color intensity or brilliance (“chroma”). Most subtle. See K & W page 259 for examples HUE is the most common, but you may manipulate color using the other properties too.
Guide to Use ● HUE: Discern qualitatively different features – ● VALUE: Vary to show quantitative differences – ● Roads from rivers Large roads from small roads SATURATION: – Binary data (present or not present) From K & W, page 259
Color: Considerations ● Light source Colors appear different under different lighting – If you know the expected lighting conditions, use guidelines as in K & W (page 258) – Intuitive! ● Less light? Use more intense colors ● Bright light? Use less intense colors –
COLOR SYSTEMS
Color Systems: RGB ● Primary colors: red, green, blue ● Colors on a computer monitor More common on a scale 0255, but can also be expressed in terms of percentage (1 -100) of primary color in hue ●
Color Systems: Process Color Process color (CYMK) is used for fullcolor printing ● One through the printing press per color (Cyan, Magenta, Yellow, K is black) -> 4 passes ● Values for C, M, Y specified in percentage ● ● Inkjet printers use this system
Visible Light
Color Systems : HSB Hue is measured in angular degrees around the cone starting and ending at red = 0 Yellow is 60 degrees, Green is 120 degrees Saturation is measured in percent from the center of the cone to surface (0 to 100) Brightness is measured in percent from black to white (0 to 100)
Color Systems: Greyscale It is essentially the HSB system holding saturation as zero (or the same as the brightness axis alone) The human eye can disntinguish 10 shades of grey! • Black = 0% brightness, 100% grey. • White = 100% brightness, 0% grey. • Grey is most often specified from white = 0, thus 10% grey = 90% brightness.
Color: Practical Use? ! Basic ideas: ● Representative colors ● Data type (e. g. binary) ● Sequential data (gradients) ● Relate trend to color if possible (numbers)
Colors: Practical Use Always think about: – Color blind users? – Elderly users? – Culturally unique viewers/Sensitive colors!
Tools that can help ● ● Color. Brewer is a program designed specifically for color selection in choropleth maps! (Penn State) K & W and Monmonier both have useful information
Homework #4, Part II ● ● ● Due May 31 st (next Thursday) Do not forget to turn in Part I & Part II. Note Extra Credit available on Part II.
Tips for Lab 4, Part II ● ● ● See the back side of the handout for tips There are two data sets floating around, US_Bees, and afrbeep 020. tar. gz, the latter requires clean up. AK, HI, PR, and VI should NOT be in the final map Make sure you can start Arc. Toolbox
Lab 3 – Review & Tips ● Very good overall ● Review rules of type placement ● Review rules of point label placement ● Example
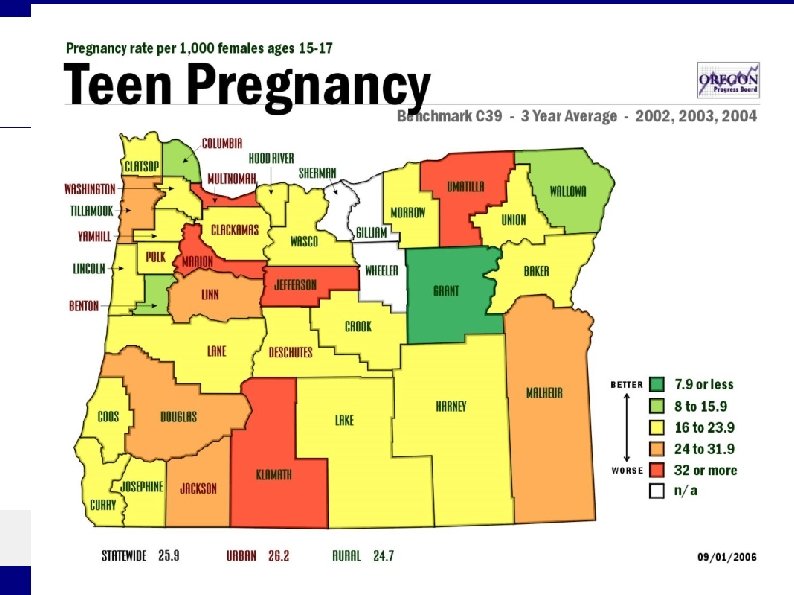
Map Examples – Project Ideas ● Example 1: Scientific - Reference ● Example 2: Scientific - Thematic ● Example 3: Social Thematic - Choropleth ● Example 4: General Reference
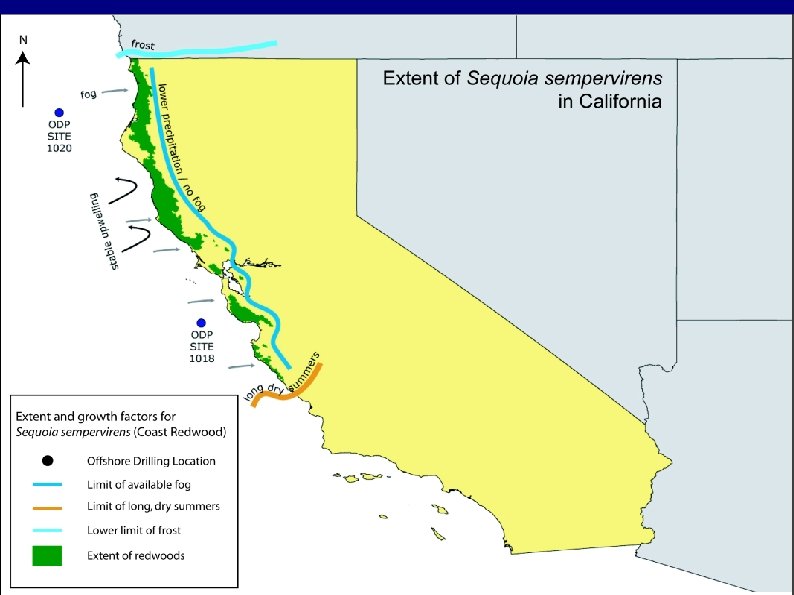
Scientific – Thematic Map
General Reference
Reference Map - Location
Projects Please turn in a one-paragraph description of your project idea by next Thursday, May 31 st. You may email it with subject heading: Project Idea