
Chisquared Test Minhaz Fahim Zibran 31 st October
Chi-squared Test Minhaz Fahim Zibran 31 st October 2007
Outline • • 06 December 2020 Application areas Illustration with example Limitations Conclusion and QA Chi-squared Test 2
Application Areas Illustration with Example Limitations Conclusion and QA Application Areas • Qualitative data classified into discrete categories. Example: We have the number of men and women died from tuberculosis of respiratory system and other types of tuberculosis. Question: Is death caused by tuberculosis of respiratory system and other types of tuberculosis is dependent on gender? 06 December 2020 Chi-squared Test 3
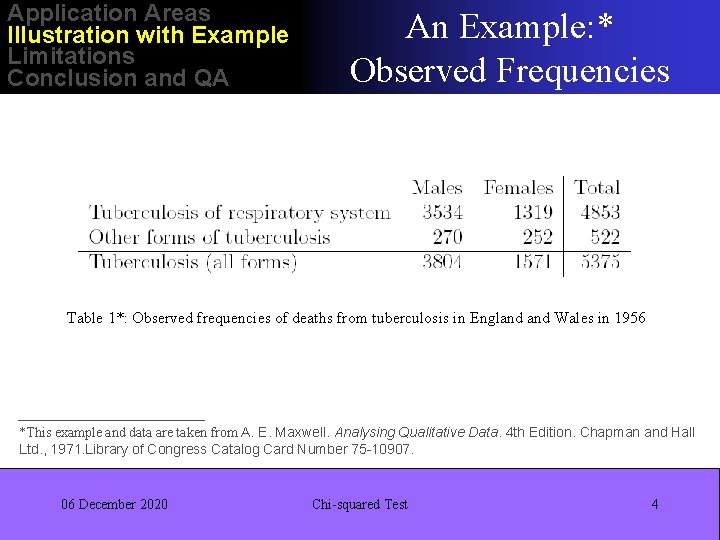
Application Areas Illustration with Example Limitations Conclusion and QA An Example: * Example 1 Observed Frequencies Table 1*: Observed frequencies of deaths from tuberculosis in England Wales in 1956 *This example and data are taken from A. E. Maxwell. Analysing Qualitative Data. 4 th Edition. Chapman and Hall Ltd. , 1971. Library of Congress Catalog Card Number 75 -10907. 06 December 2020 Chi-squared Test 4
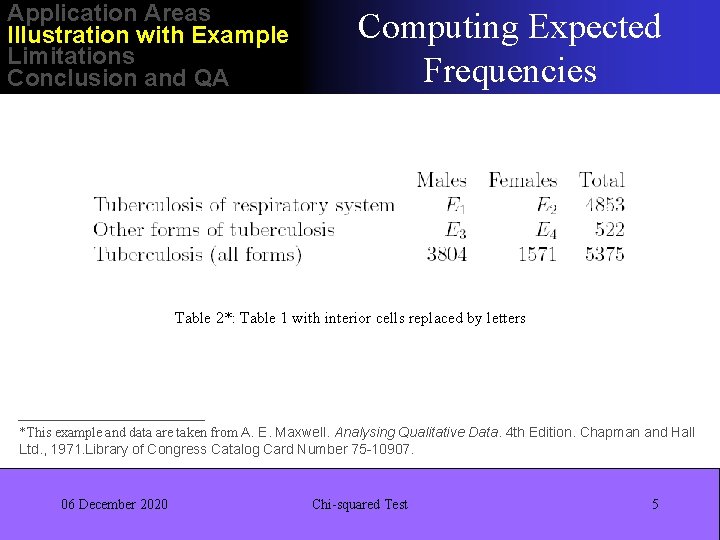
Application Areas Illustration with Example Limitations Conclusion and QA Computing Expected Example 2 Frequencies Table 2*: Table 1 with interior cells replaced by letters *This example and data are taken from A. E. Maxwell. Analysing Qualitative Data. 4 th Edition. Chapman and Hall Ltd. , 1971. Library of Congress Catalog Card Number 75 -10907. 06 December 2020 Chi-squared Test 5
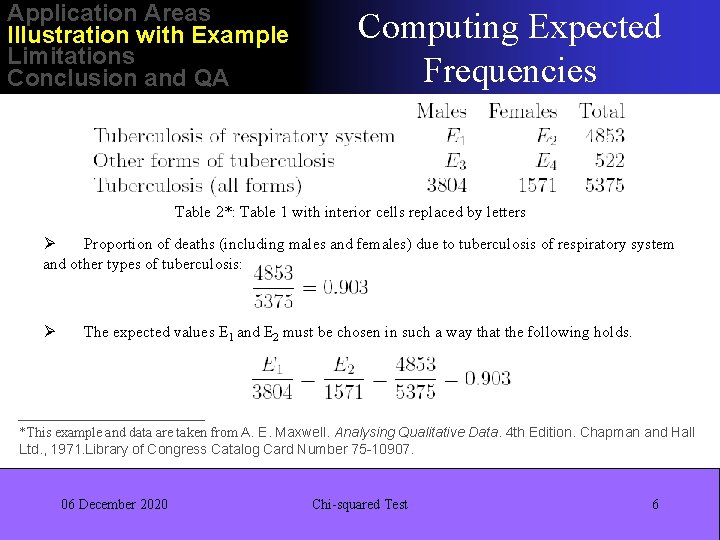
Application Areas Illustration with Example Limitations Conclusion and QA Computing Expected Example 3 Frequencies Table 2*: Table 1 with interior cells replaced by letters Ø Proportion of deaths (including males and females) due to tuberculosis of respiratory system and other types of tuberculosis: Ø The expected values E 1 and E 2 must be chosen in such a way that the following holds. *This example and data are taken from A. E. Maxwell. Analysing Qualitative Data. 4 th Edition. Chapman and Hall Ltd. , 1971. Library of Congress Catalog Card Number 75 -10907. 06 December 2020 Chi-squared Test 6
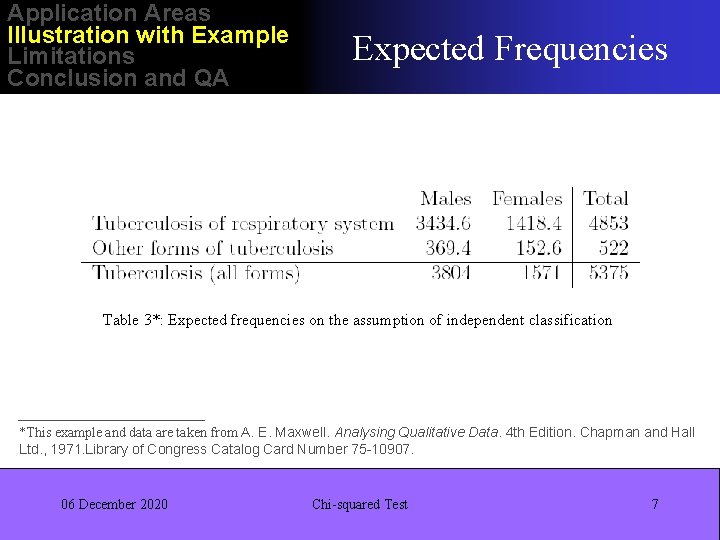
Application Areas Illustration with Example Limitations Conclusion and QA Expected Frequencies Example 4 Table 3*: Expected frequencies on the assumption of independent classification *This example and data are taken from A. E. Maxwell. Analysing Qualitative Data. 4 th Edition. Chapman and Hall Ltd. , 1971. Library of Congress Catalog Card Number 75 -10907. 06 December 2020 Chi-squared Test 7
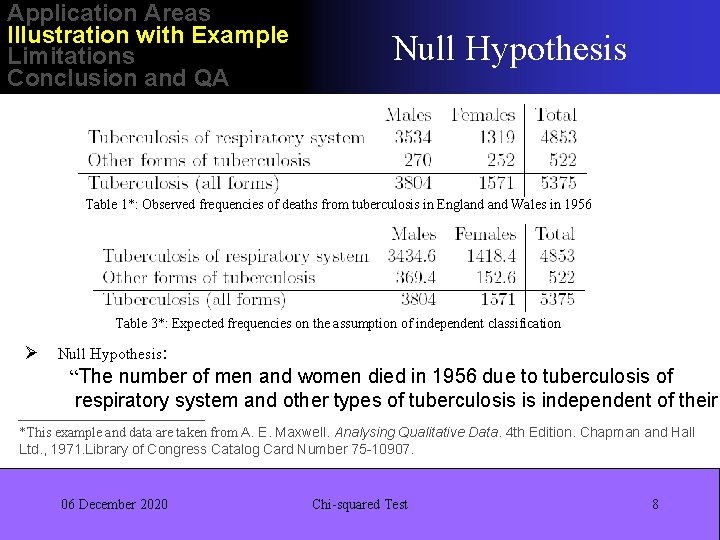
Application Areas Illustration with Example Limitations Conclusion and QA Null Hypothesis Example 5 Table 1*: Observed frequencies of deaths from tuberculosis in England Wales in 1956 Table 3*: Expected frequencies on the assumption of independent classification Ø Null Hypothesis: “The number of men and women died in 1956 due to tuberculosis of respiratory system and other types of tuberculosis is independent of their *This example and data are taken from A. E. Maxwell. Analysing Qualitative Data. 4 th Edition. Chapman and Hall Ltd. , 1971. Library of Congress Catalog Card Number 75 -10907. 06 December 2020 Chi-squared Test 8
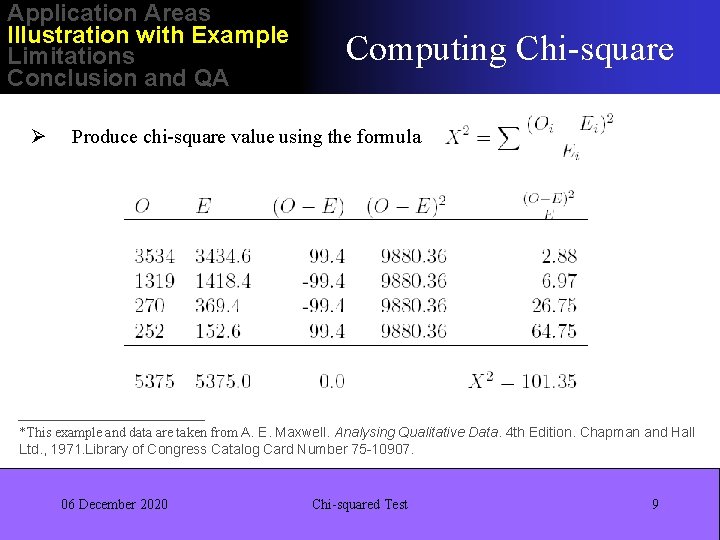
Application Areas Illustration with Example Limitations Conclusion and QA Ø Computing Chi-square Example 6 Produce chi-square value using the formula *This example and data are taken from A. E. Maxwell. Analysing Qualitative Data. 4 th Edition. Chapman and Hall Ltd. , 1971. Library of Congress Catalog Card Number 75 -10907. 06 December 2020 Chi-squared Test 9
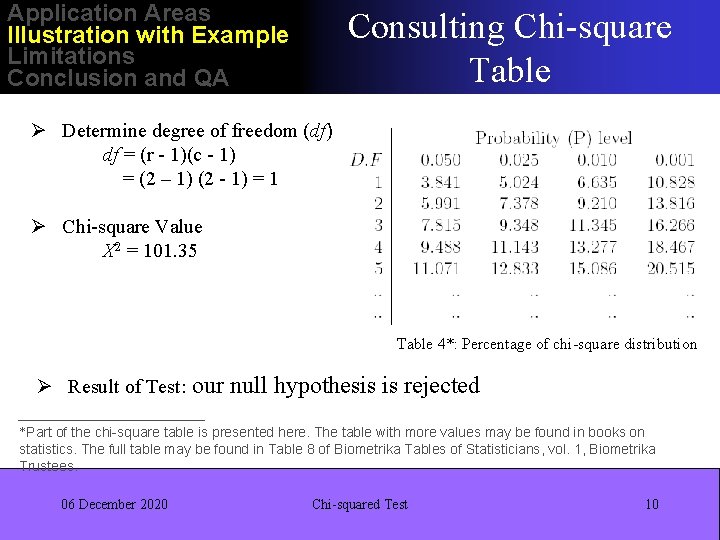
Application Areas Illustration with Example Limitations Conclusion and QA Consulting Chi-square Example 7 Table Ø Determine degree of freedom (df) df = (r - 1)(c - 1) = (2 – 1) (2 - 1) = 1 Ø Chi-square Value X 2 = 101. 35 Table 4*: Percentage of chi-square distribution Ø Result of Test: our null hypothesis is rejected *Part of the chi-square table is presented here. The table with more values may be found in books on statistics. The full table may be found in Table 8 of Biometrika Tables of Statisticians, vol. 1, Biometrika Trustees. 06 December 2020 Chi-squared Test 10
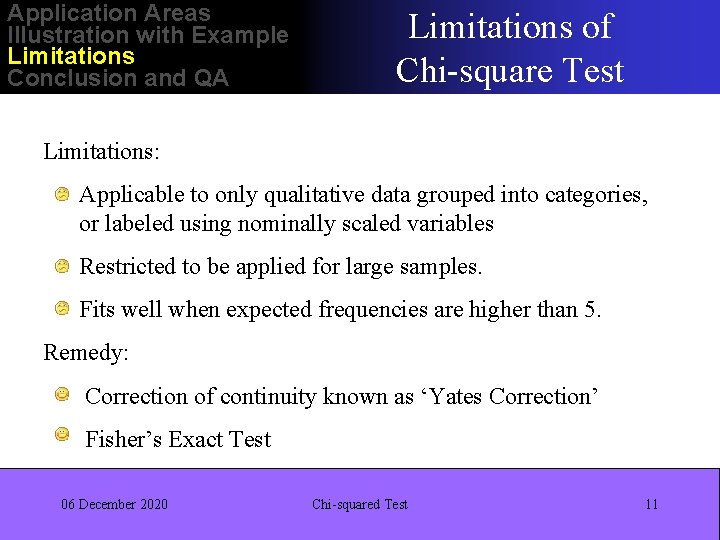
Application Areas Illustration with Example Limitations Conclusion and QA Limitations of Limitations Chi-square Test Limitations: Applicable to only qualitative data grouped into categories, or labeled using nominally scaled variables Restricted to be applied for large samples. Fits well when expected frequencies are higher than 5. Remedy: Correction of continuity known as ‘Yates Correction’ Fisher’s Exact Test 06 December 2020 Chi-squared Test 11
Application Areas Illustration with Example Limitations Conclusion and QA Conclusion Chi-square test tells us whether the classifications are dependent or not. If it tells that the classifications are dependent, it does NOT necessarily imply any causal relationship. 06 December 2020 Chi-squared Test 12
Application Areas Illustration with Example Limitations Conclusion and QA Any Question? Questions 06 December 2020 Chi-squared Test 13
- Slides: 13