ChiSquare Tests EXPERIMENTAL PSYCHOLOGY GUIDEDINQUIRY LEARNING Module ChiSquare


 40 (50)")


- Slides: 9
Chi-Square Tests EXPERIMENTAL PSYCHOLOGY GUIDED-INQUIRY LEARNING Module: Chi-Square Tests © 2017, Dr. B. Rumain & Dr. A. Geliebter, Touro College & University System
MOTIVATION If you want to know whether people prefer Brand X or Brand Y of a product, what sort of test would you use? Can you use any of the tests we’ve already learned about?
LEARNING OBJECTIVES • You will know when it is appropriate to use a chi-square ( ) test. 2 • You will learn how to calculate chisquare values in doing a chi-square test.
INFORMATION The answer to the above question is that none of the methods we learned allow us to answer the question about the two brands. The reason is that none of the methods we’ve discussed so far are suitable for nominal data – that’s data that falls into distinct categories. All the methods so far are for data that are continuous (these are referred to as ordinal or ratio scales). So when we want to compare nominal data, we need to use a chi-square test.
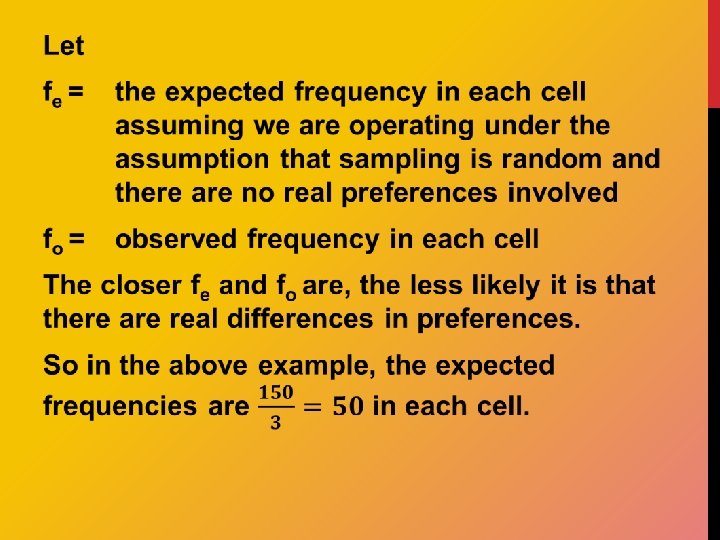
Model Let’s see whether people prefer Cheerios, Honey Bunches, or Raisin Bran cereal. Suppose we conduct a survey and find the following preference distribution: Cheerios 65 Honey Bunches Raisin Bran 45 40 Total = 150 If people had no preference, we would expect a frequency distribution of 50, 50.
Cheerios Honey Bunches Raisin Bran 65 (50) 40 (50)
Values of the Chi-squared Distribution From: https: //www. medcalc. org/manual/chi-square-table. php P DF 0. 995 0. 975 0. 20 0. 10 0. 05 0. 02 0. 01 0. 005 0. 002 0. 001 1 0. 0000393 0. 000982 1. 642 2. 706 3. 841 5. 024 5. 412 6. 635 7. 879 9. 550 10. 828 2 0. 0100 0. 0506 3. 219 4. 605 5. 991 7. 378 7. 824 9. 210 10. 597 12. 429 13. 816 3 0. 0717 0. 216 4. 642 6. 251 7. 815 9. 348 9. 837 11. 345 12. 838 14. 796 16. 266 4 0. 207 0. 484 5. 989 7. 779 9. 488 11. 143 11. 668 13. 277 14. 860 16. 924 18. 467 5 0. 412 0. 831 7. 289 9. 236 11. 070 12. 833 13. 388 15. 086 16. 750 18. 907 20. 515 6 0. 676 1. 237 8. 558 10. 645 12. 592 14. 449 15. 033 16. 812 18. 548 20. 791 22. 458 7 0. 989 1. 690 9. 803 12. 017 14. 067 16. 013 16. 622 18. 475 20. 278 22. 601 24. 322 8 1. 344 2. 180 11. 030 13. 362 15. 507 17. 535 18. 168 20. 090 21. 955 24. 352 26. 124 9 1. 735 2. 700 12. 242 14. 684 16. 919 19. 023 19. 679 21. 666 23. 589 26. 056 27. 877 10 2. 156 3. 247 13. 442 15. 987 18. 307 20. 483 21. 161 23. 209 25. 188 27. 722 29. 588
EXERCISES 1. What is and fe? 2 measuring when comparing fo 2. As the discrepancy between fo and fe increases, what happens to 2 ? 3. Looking at the Table, 2 for df = 2 is what value? So this is the value for 2 crit. 4. If 2 ≥ 2 crit. we assume the results are not due to chance but are significant. The amount of chance we are willing to accept is called the α level. So if we take α=. 05, are our results here due to chance? Explain your reasoning.