
Chisquare test or 2 test What if we

- Slides: 29
Chi-square test or 2 χ test
What if we are interested in seeing if my “crazy” crazy dice are considered “fair”? What can I do?
Chi-square test • Used to test the counts of categorical data • Three types – Goodness of fit (univariate) – Independence (bivariate) – Homogeneity (univariate with two samples)
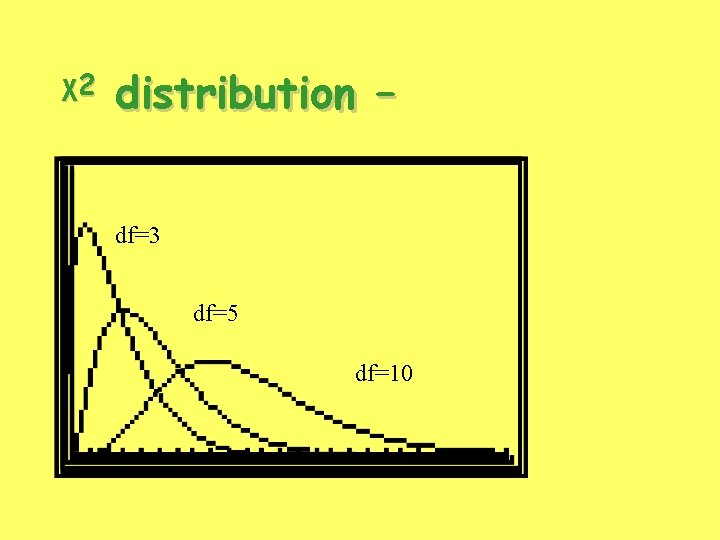
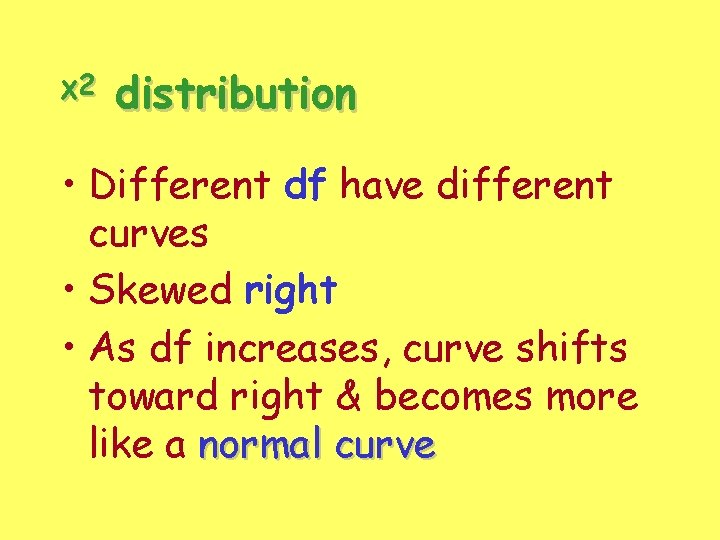
χ2 distribution – df=3 df=5 df=10
χ2 distribution • Different df have different curves • Skewed right • As df increases, curve shifts toward right & becomes more like a normal curve
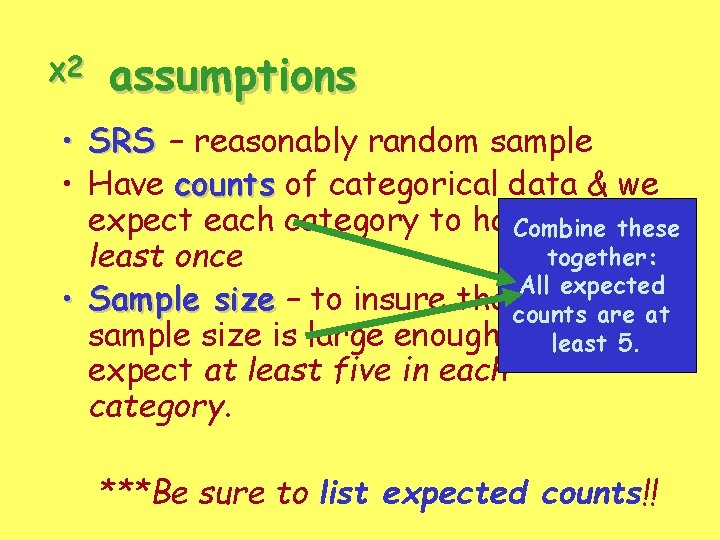
χ2 assumptions • SRS – reasonably random sample • Have counts of categorical data & we expect each category to happen atthese Combine together: least once All expected • Sample size – to insure thatcounts the are at sample size is large enough weleast should 5. expect at least five in each category. ***Be sure to list expected counts!!
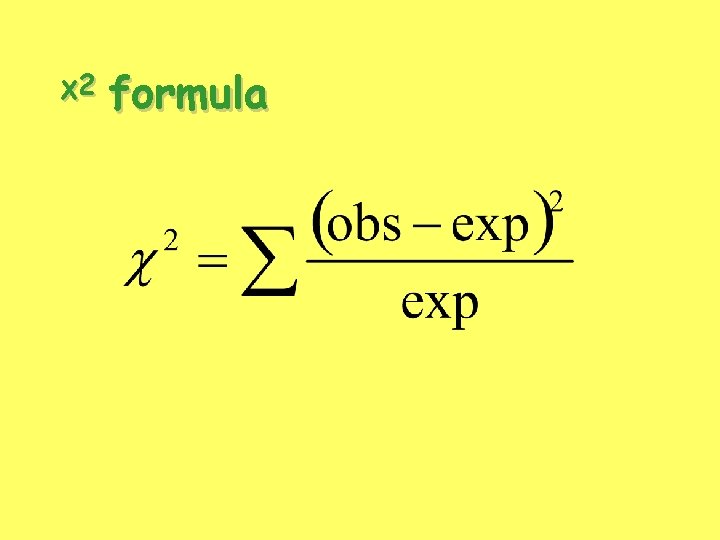
χ2 formula
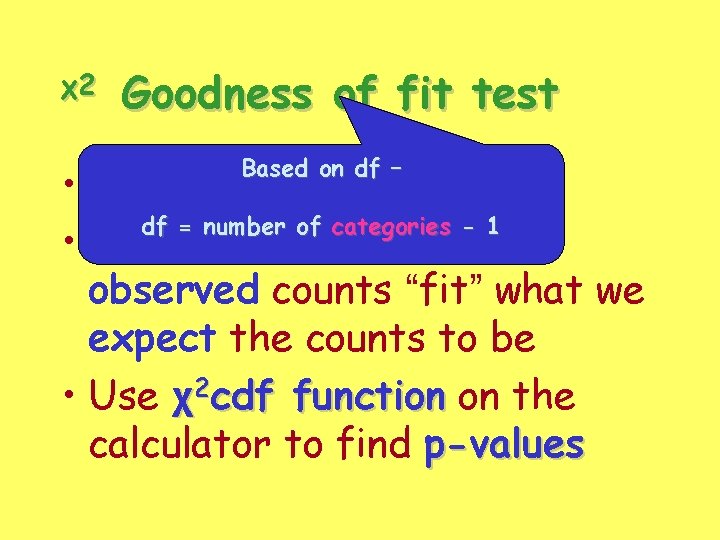
χ2 Goodness of fit test Based on df – • Uses univariate data df = number of categories - 1 • Want to see how well the observed counts “fit” what we expect the counts to be • Use χ2 cdf function on the calculator to find p-values
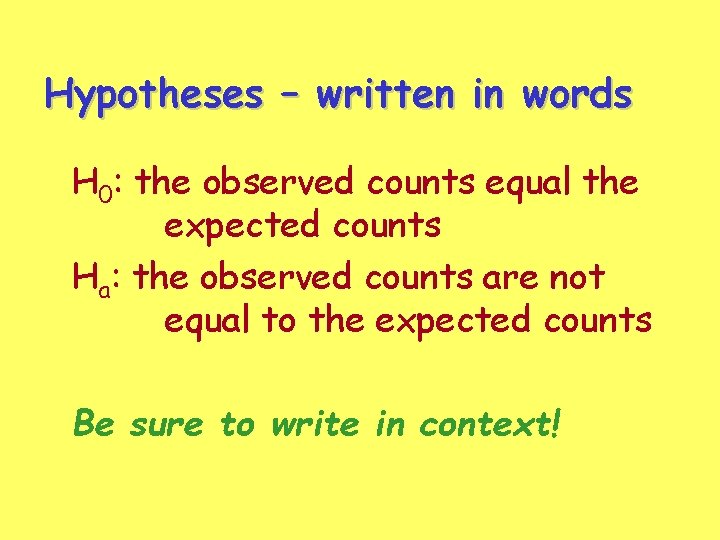
Hypotheses – written in words H 0: the observed counts equal the expected counts Ha: the observed counts are not equal to the expected counts Be sure to write in context!
Let’s test our dice!
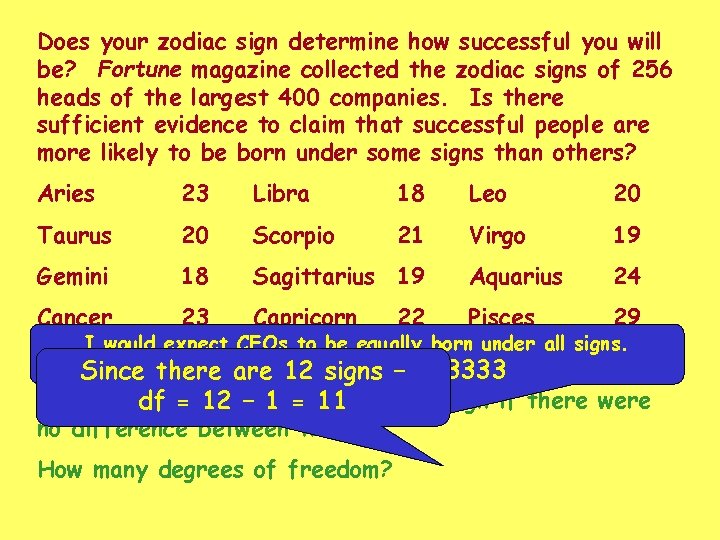
Does your zodiac sign determine how successful you will be? Fortune magazine collected the zodiac signs of 256 heads of the largest 400 companies. Is there sufficient evidence to claim that successful people are more likely to be born under some signs than others? Aries 23 Libra 18 Leo 20 Taurus 20 Scorpio 21 Virgo 19 Gemini 18 Sagittarius 19 Aquarius 24 Cancer 23 Capricorn Pisces 29 22 I would expect CEOs to be equally born under all signs. Soare 256/12 = 21. 333333 Since there 12 signs – How manydfwould = 12 you – 1 expect = 11 in each sign if there were no difference between them? How many degrees of freedom?
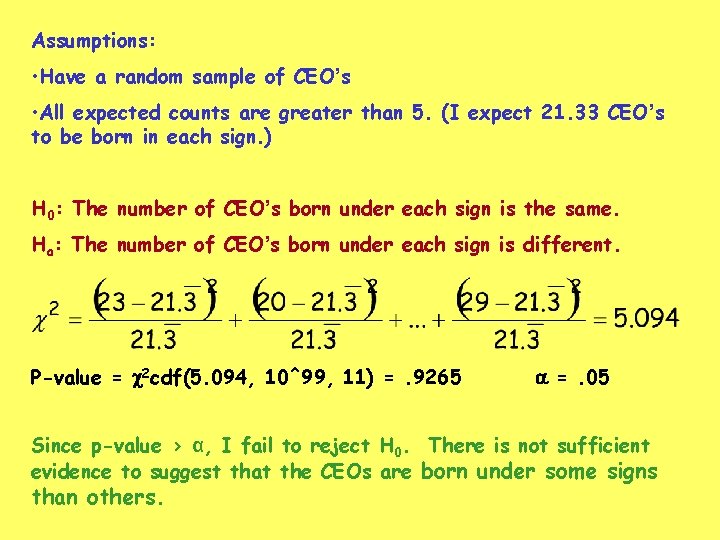
Assumptions: • Have a random sample of CEO’s • All expected counts are greater than 5. (I expect 21. 33 CEO’s to be born in each sign. ) H 0: The number of CEO’s born under each sign is the same. Ha: The number of CEO’s born under each sign is different. P-value = c 2 cdf(5. 094, 10^99, 11) =. 9265 a =. 05 Since p-value > α, I fail to reject H 0. There is not sufficient evidence to suggest that the CEOs are born under some signs than others.
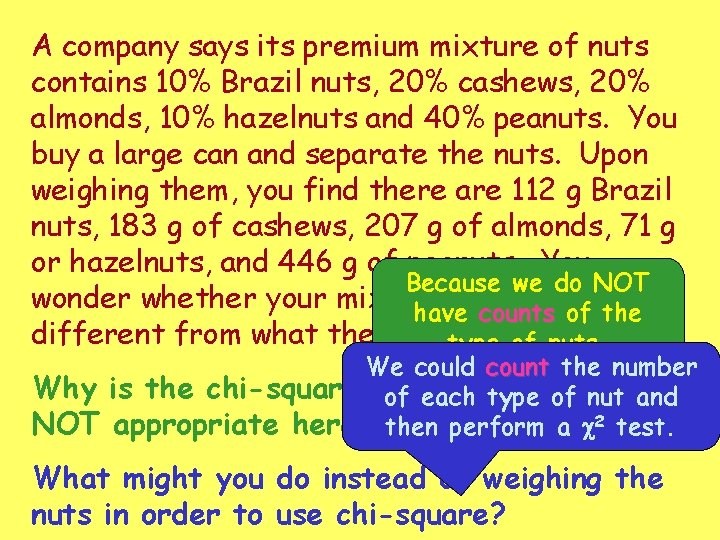
A company says its premium mixture of nuts contains 10% Brazil nuts, 20% cashews, 20% almonds, 10% hazelnuts and 40% peanuts. You buy a large can and separate the nuts. Upon weighing them, you find there are 112 g Brazil nuts, 183 g of cashews, 207 g of almonds, 71 g or hazelnuts, and 446 g of peanuts. You Because we do NOT wonder whether your mix ishave significantly counts of the different from what the company type advertises? of nuts. Why NOT We could count the number is the chi-square goodness-of-fit of each type of nuttest and appropriate here? then perform a c 2 test. What might you do instead of weighing the nuts in order to use chi-square?
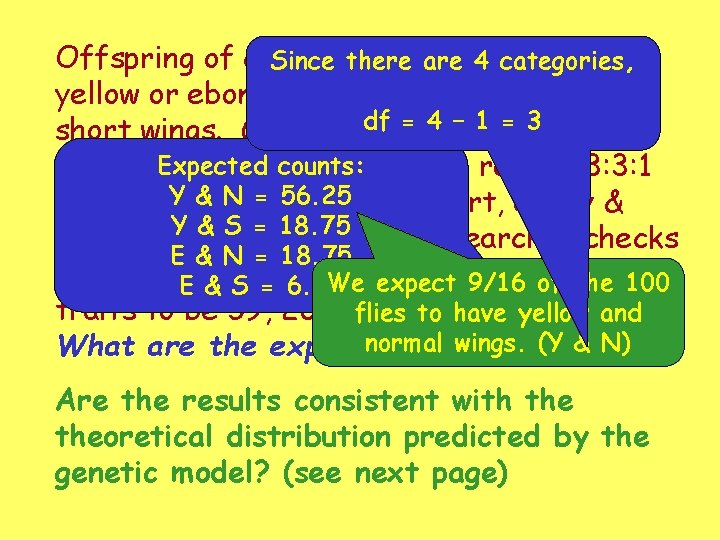
Offspring of certain fruit are flies may have Since there 4 categories, yellow or ebony bodies and normal wings or df = 4 –predicts 1 = 3 short wings. Genetic theory that Expected these traits willcounts: appear in the ratio 9: 3: 3: 1 & N = 56. 25 (yellow &Y normal, yellow & short, ebony & Y & S = 18. 75 normal, ebony & short) A researcher checks E & N = 18. 75 100 such Eflies finds the distribution of We expect 9/16 of the 100 & S and = 6. 25 traits to be 59, 20, 11, andto 10, respectively. flies have yellow and normal wings. (Y & N) What are the expected counts? df? Are the results consistent with theoretical distribution predicted by the genetic model? (see next page)
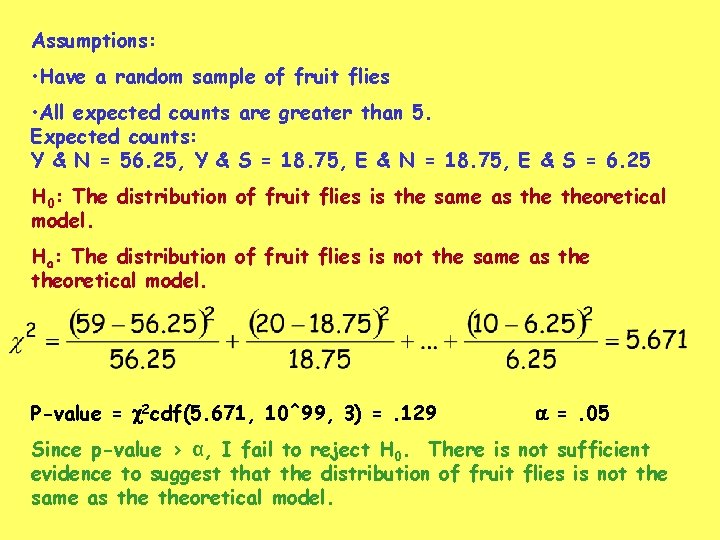
Assumptions: • Have a random sample of fruit flies • All expected counts are greater than 5. Expected counts: Y & N = 56. 25, Y & S = 18. 75, E & N = 18. 75, E & S = 6. 25 H 0: The distribution of fruit flies is the same as theoretical model. Ha: The distribution of fruit flies is not the same as theoretical model. P-value = c 2 cdf(5. 671, 10^99, 3) =. 129 a =. 05 Since p-value > α, I fail to reject H 0. There is not sufficient evidence to suggest that the distribution of fruit flies is not the same as theoretical model.
χ2 test for independence • Used with categorical, bivariate data from ONE sample • Used to see if the two categorical variables are associated (dependent) or not associated (independent)
Assumptions & formula remain the same!
Hypotheses – written in words H 0: two variables are independent Ha: two variables are dependent Be sure to write in context!
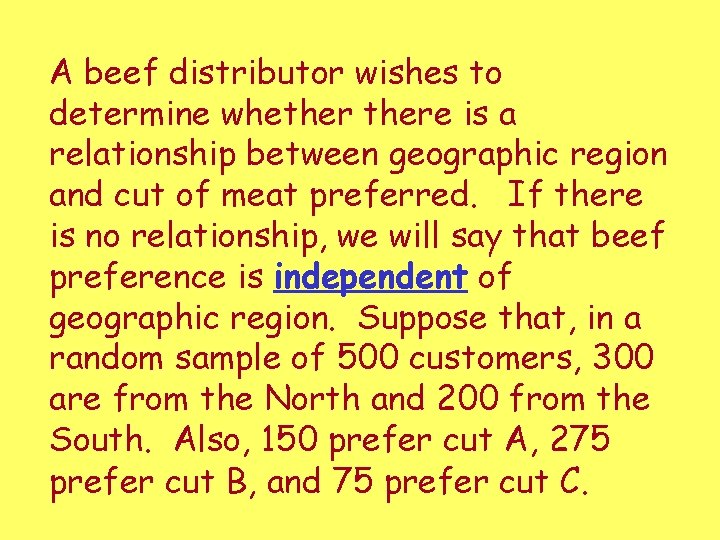
A beef distributor wishes to determine whethere is a relationship between geographic region and cut of meat preferred. If there is no relationship, we will say that beef preference is independent of geographic region. Suppose that, in a random sample of 500 customers, 300 are from the North and 200 from the South. Also, 150 prefer cut A, 275 prefer cut B, and 75 prefer cut C.
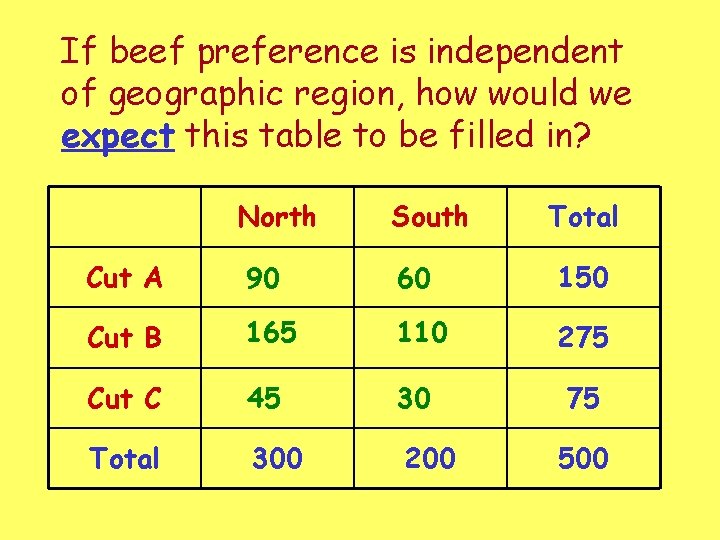
If beef preference is independent of geographic region, how would we expect this table to be filled in? North South Total Cut A 90 60 150 Cut B 165 110 275 Cut C 45 30 Total 300 200 75 500
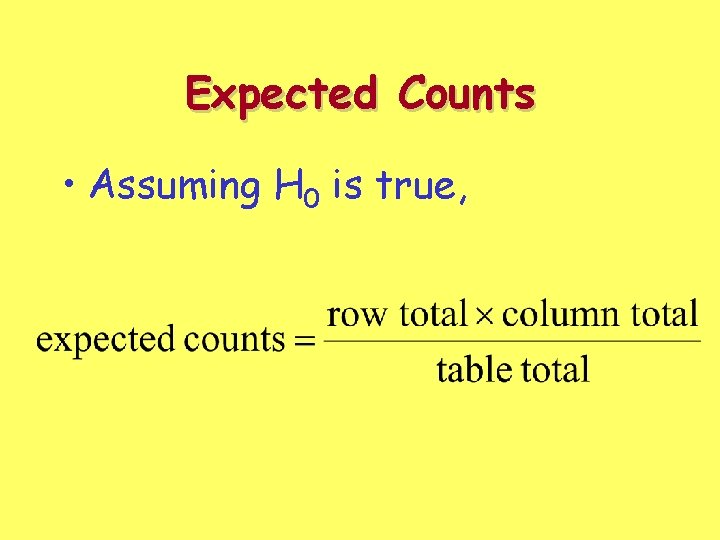
Expected Counts • Assuming H 0 is true,
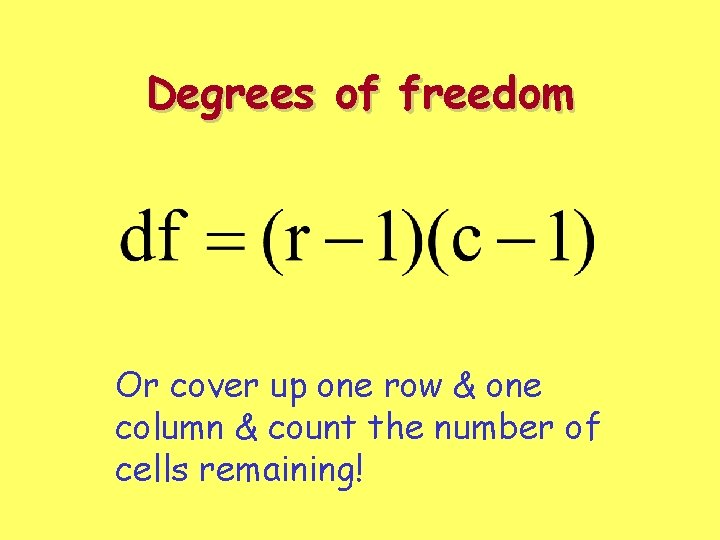
Degrees of freedom Or cover up one row & one column & count the number of cells remaining!
Now suppose that in the actual sample of 500 consumers the observed numbers were as follows: (on your paper) Is there sufficient evidence to suggest that geographic regions and beef preference are not independent? (Is there a difference between the expected and observed counts? )
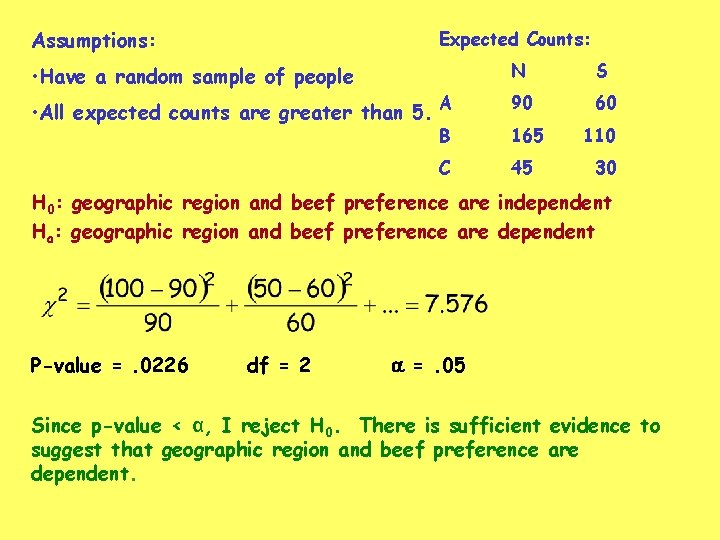
Assumptions: Expected Counts: • Have a random sample of people N S • All expected counts are greater than 5. A 90 60 B 165 C 45 110 30 H 0: geographic region and beef preference are independent Ha: geographic region and beef preference are dependent P-value =. 0226 df = 2 a =. 05 Since p-value < α, I reject H 0. There is sufficient evidence to suggest that geographic region and beef preference are dependent.
χ2 test for homogeneity • Used with a single categorical variable from two (or more) independent samples • Used to see if the two populations are the same (homogeneous)
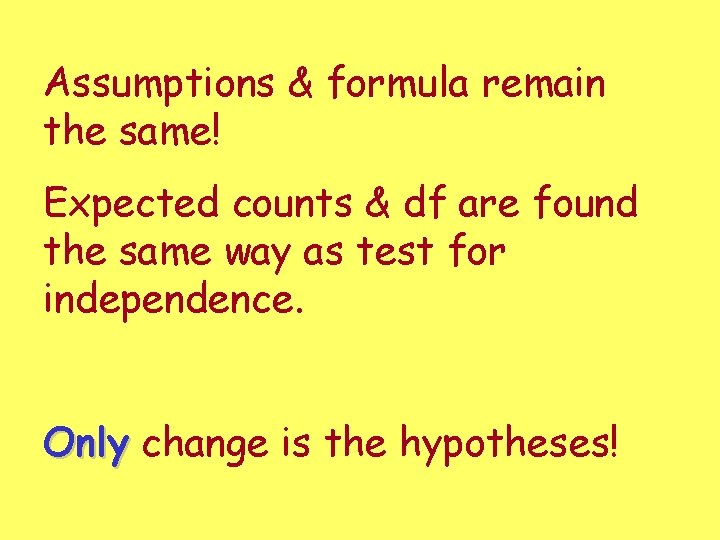
Assumptions & formula remain the same! Expected counts & df are found the same way as test for independence. Only change is the hypotheses!
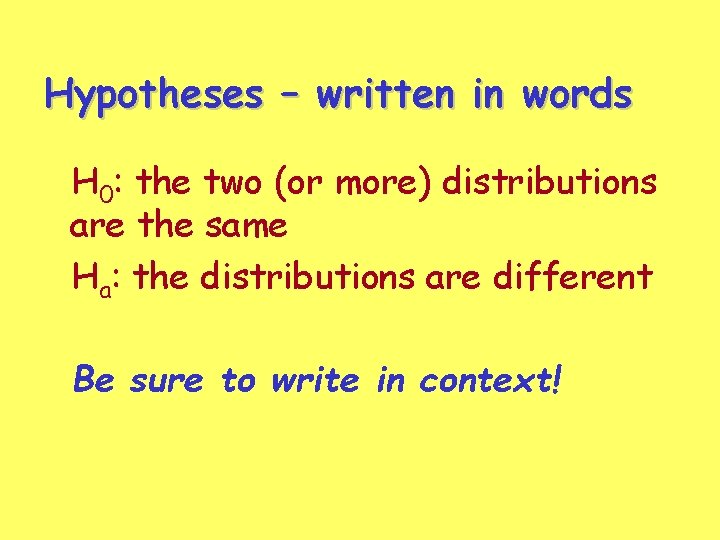
Hypotheses – written in words H 0: the two (or more) distributions are the same Ha: the distributions are different Be sure to write in context!
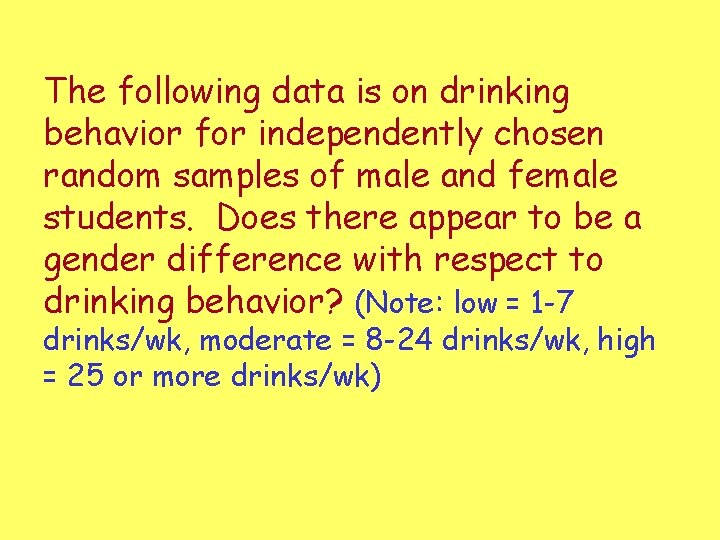
The following data is on drinking behavior for independently chosen random samples of male and female students. Does there appear to be a gender difference with respect to drinking behavior? (Note: low = 1 -7 drinks/wk, moderate = 8 -24 drinks/wk, high = 25 or more drinks/wk)
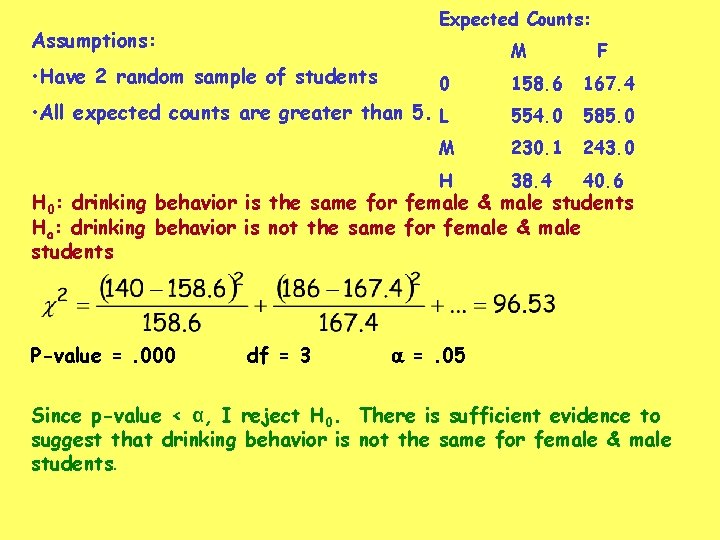
Expected Counts: Assumptions: • Have 2 random sample of students M F 0 158. 6 167. 4 • All expected counts are greater than 5. L 554. 0 585. 0 M 230. 1 243. 0 H 38. 4 40. 6 H 0: drinking behavior is the same for female & male students Ha: drinking behavior is not the same for female & male students P-value =. 000 df = 3 a =. 05 Since p-value < α, I reject H 0. There is sufficient evidence to suggest that drinking behavior is not the same for female & male students.