
ChiSquare Test for Independence Copyright c 2008 by
Chi-Square Test for Independence Copyright (c) 2008 by The Mc. Graw-Hill Companies. This material is intended solely for educational purposes by licensed users of Learning. Stats. It may not be copied or resold for profit.
Test for Independence of Classification The chi-square test for independence, developed by Karl Pearson (1857 -1936) measures the association between two variables A and B which are crosstabulated into a contingency table of observed frequencies with r rows and c columns, giving rc cells. Each cell shows the frequency of cooccurrence of data pairs that fall into the particular category defined by the row and column heading
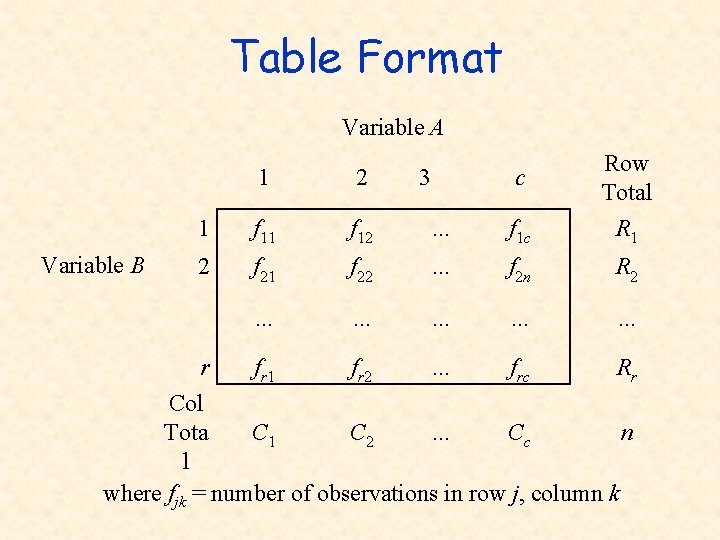
Table Format Variable A Variable B c Row Total . . . f 1 c R 1 f 22 . . . f 2 n R 2 . . . . fr 1 fr 2 . . . frc Rr 1 2 1 f 12 2 f 21 r 3 Col C 1 C 2. . . Cc n Tota l where fjk = number of observations in row j, column k
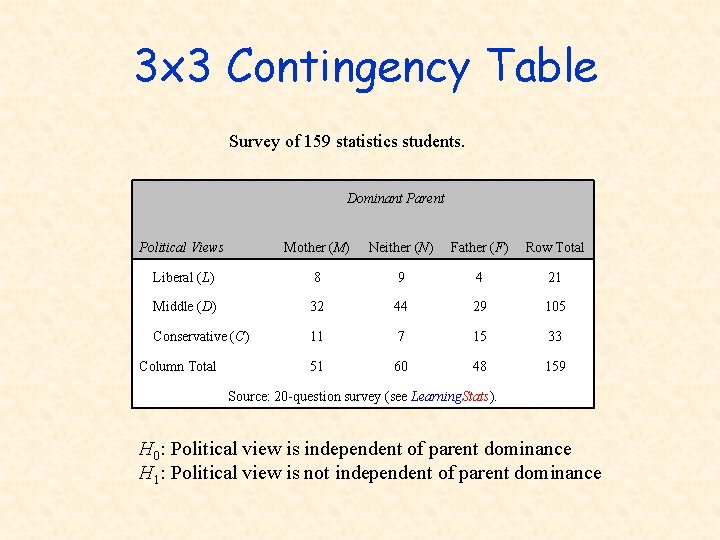
3 x 3 Contingency Table Survey of 159 statistics students. Dominant Parent Political Views Mother (M) Neither (N) Father (F) Row Total Liberal (L) 8 9 4 21 Middle (D) 32 44 29 105 Conservative (C) 11 7 15 33 Column Total 51 60 48 159 Source: 20 -question survey (see Learning. Stats). H 0: Political view is independent of parent dominance H 1: Political view is not independent of parent dominance
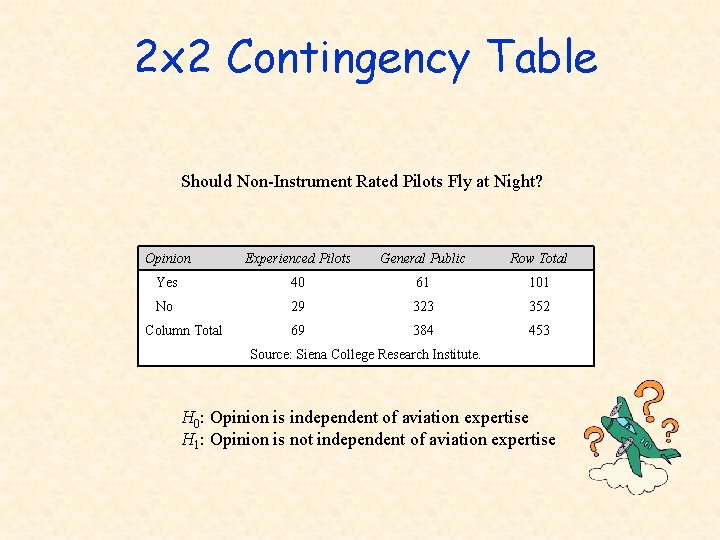
2 x 2 Contingency Table Should Non-Instrument Rated Pilots Fly at Night? Opinion Experienced Pilots General Public Row Total Yes 40 61 101 No 29 323 352 Column Total 69 384 453 Source: Siena College Research Institute. H 0: Opinion is independent of aviation expertise H 1: Opinion is not independent of aviation expertise
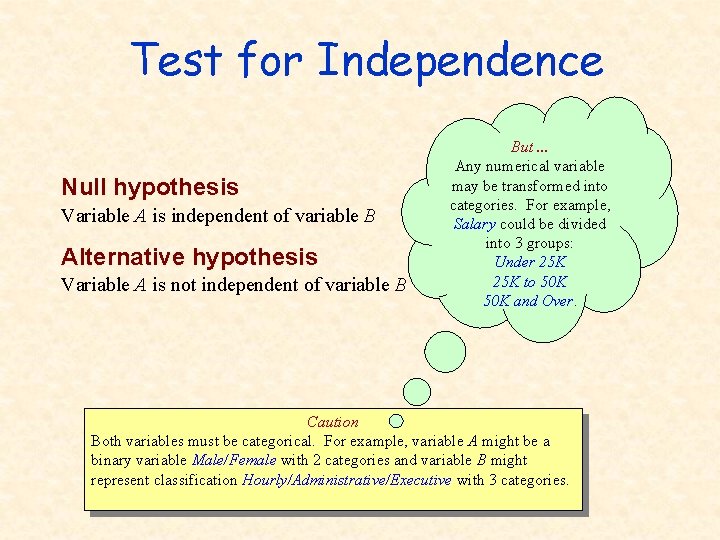
Test for Independence Null hypothesis Variable A is independent of variable B Alternative hypothesis Variable A is not independent of variable B But. . . Any numerical variable may be transformed into categories. For example, Salary could be divided into 3 groups: Under 25 K to 50 K and Over. Caution Both variables must be categorical. For example, variable A might be a binary variable Male/Female with 2 categories and variable B might represent classification Hourly/Administrative/Executive with 3 categories.
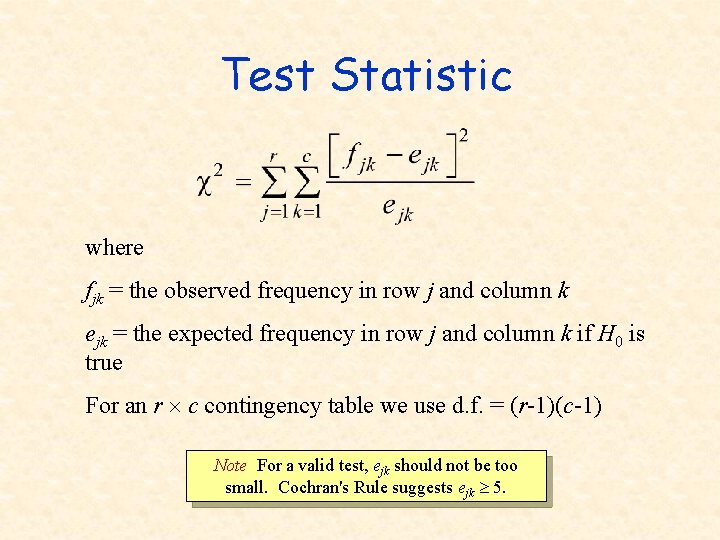
Test Statistic where fjk = the observed frequency in row j and column k ejk = the expected frequency in row j and column k if H 0 is true For an r c contingency table we use d. f. = (r-1)(c-1) Note For a valid test, ejk should not be too small. Cochran's Rule suggests ejk 5.
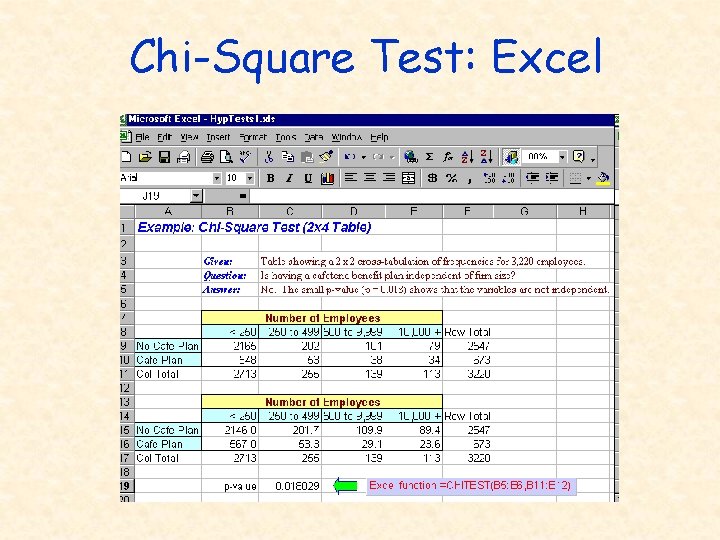
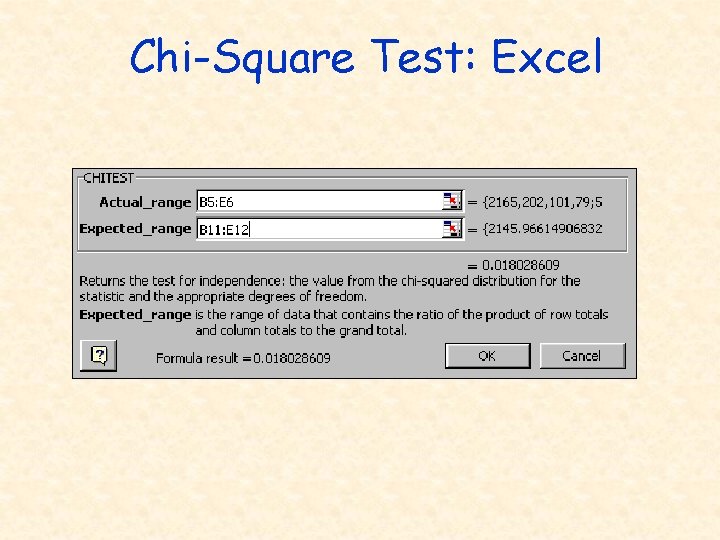
Example: Health Plans A questionnaire was mailed to 7, 135 municipal government personnel directors nationwide, yielding 3, 220 replies: Variable 1 Cafeteria-style health plan (y/n) Variable 2 Number of employees Source R. W. Perry and N. J. Cayer, "Cafeteria Style Health Plans in Municipal Government, " Public Personnel Management, V. 28, N. 1, 1999, 107 -117.
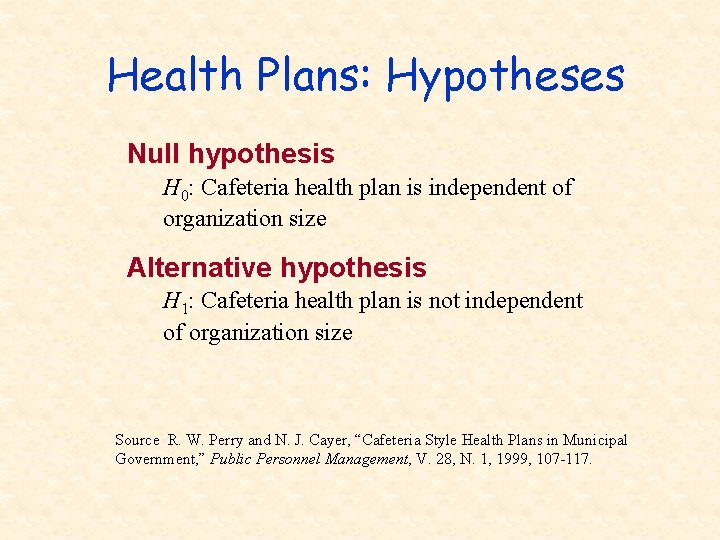
Health Plans: Hypotheses Null hypothesis H 0: Cafeteria health plan is independent of organization size Alternative hypothesis H 1: Cafeteria health plan is not independent of organization size Source R. W. Perry and N. J. Cayer, “Cafeteria Style Health Plans in Municipal Government, ” Public Personnel Management, V. 28, N. 1, 1999, 107 -117.
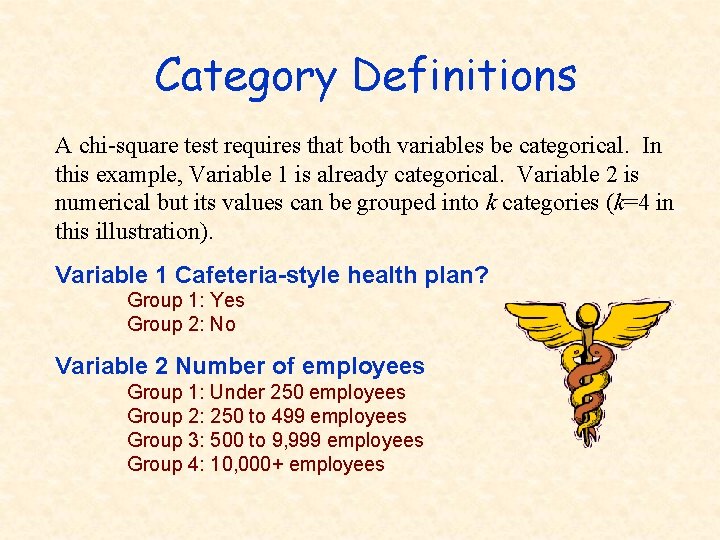
Category Definitions A chi-square test requires that both variables be categorical. In this example, Variable 1 is already categorical. Variable 2 is numerical but its values can be grouped into k categories (k=4 in this illustration). Variable 1 Cafeteria-style health plan? Group 1: Yes Group 2: No Variable 2 Number of employees Group 1: Under 250 employees Group 2: 250 to 499 employees Group 3: 500 to 9, 999 employees Group 4: 10, 000+ employees
Chi-Square Test: Excel
Chi-Square Test: Excel
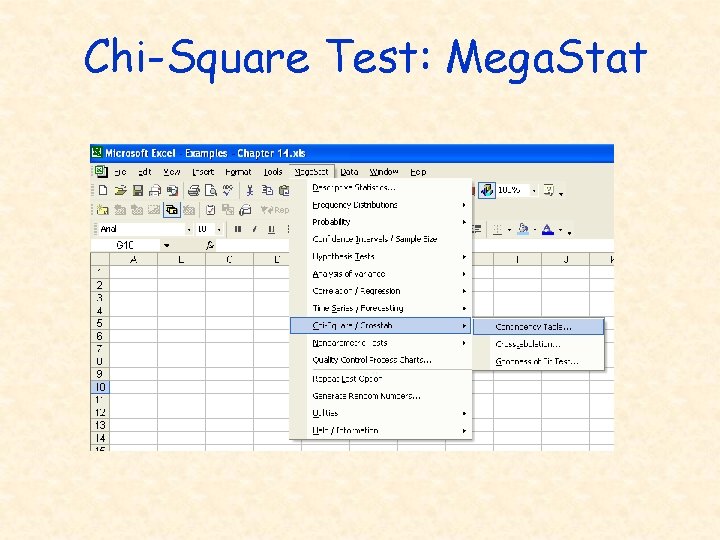
Chi-Square Test: Mega. Stat
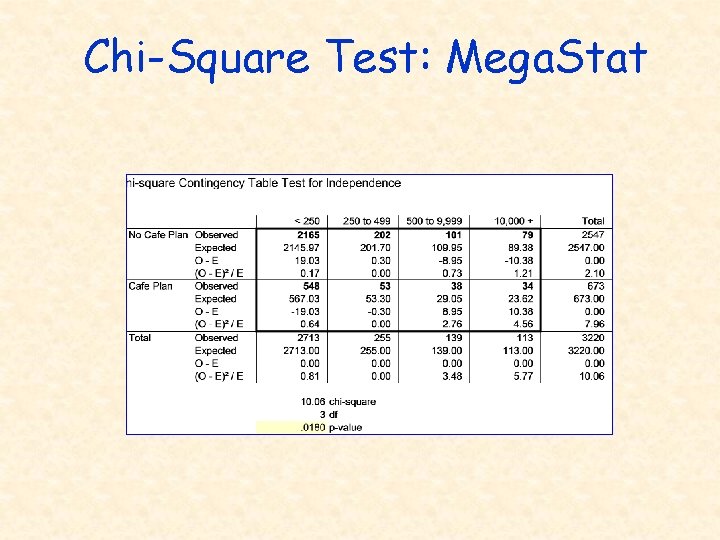
Chi-Square Test: Mega. Stat
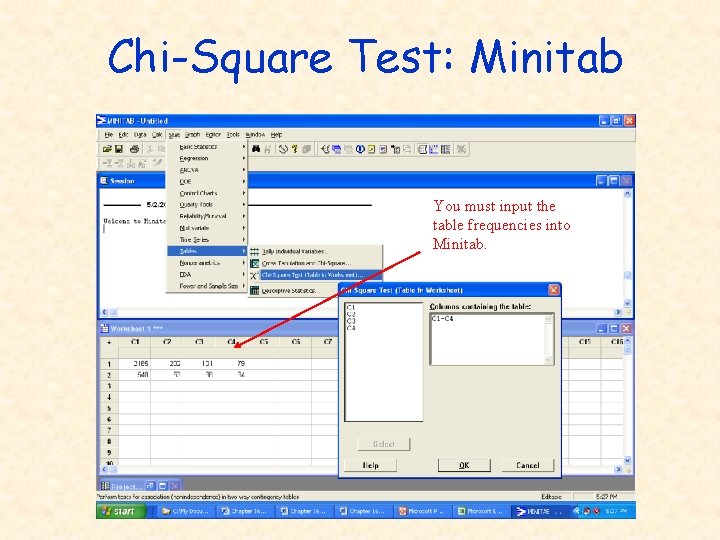
Chi-Square Test: Minitab You must input the table frequencies into Minitab.

Chi-Square Test: Minitab
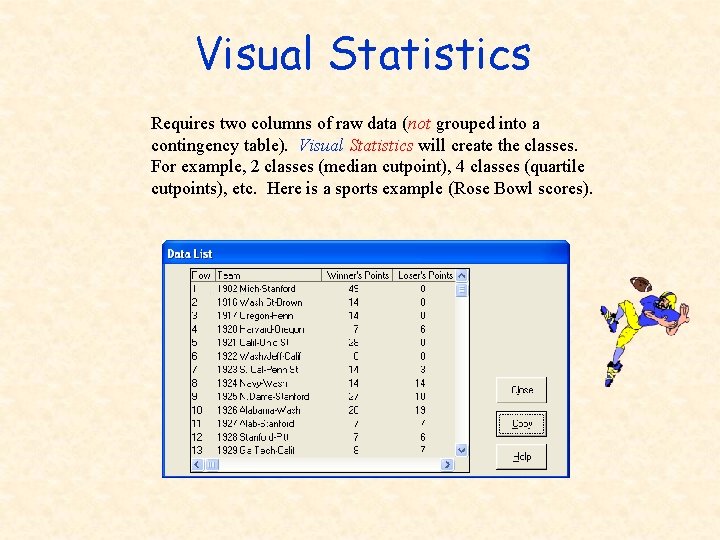
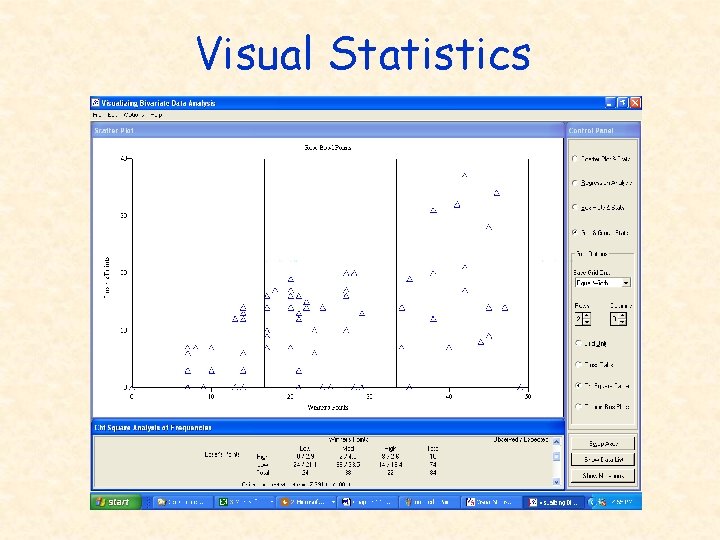
Visual Statistics Requires two columns of raw data (not grouped into a contingency table). Visual Statistics will create the classes. For example, 2 classes (median cutpoint), 4 classes (quartile cutpoints), etc. Here is a sports example (Rose Bowl scores).
Visual Statistics
Why Chi-Square? • When you have frequencies • Works well with survey data • Makes very few assumptions • Easy to understand explain
- Slides: 19