Chilean Wine Industry Grape Wine Technology Centre Business

Chilean Wine Industry Grape & Wine Technology Centre & Business School University of Talca CHILE

Chronology 1548: First grape rootstocks brought to Chile. 1654: Local production growth threatens Spain’s industry and Spain limits grape growth in Chile. 1758: According to John Byron, Chilean wine is as good as Madeira’s and much cheaper. 1851: Silvestre Ochagavia brought first French vines. 1877: Exports to Europe start. 1920 s: Prohibition motivates limits to grape growing. 1960 s: Demand motivates legal permission to water wine.

Chronology 1975: Eliminated restriction to grape growing. 1975 -1980: Expansion of grape growing. 1980: New technology brought by Miguel Torres. 1982 -86: Decrease in domestic consumption while big traditional firms graduately incorporate new technology. 1987 -2002: Growth of small exporting firms. 1994: Establecimiento de la nueva ley de zonificacion vinicola y denominaciones de origen.
, years 1970 - 2000.")
Trend in wine consumption in Chile (per capita), years 1970 - 2000.

Number of wineries, employees and average firm size Chile 1975 - 1995 Sources: I. N. E Annual Manufacturing Survey of firms whit more than 10 employees. Small firms are those with 10 -49 employees; medium+ firms are medium and large enterprise with 50 + employees. * The 1979 survey was broader: The “small firms” categories includes microenterprises with 5 - 9 employees.
 Source: Based on Chile.")
Destination markets for Chilean exports 1978 -1996 (% of Liters) Source: Based on Chile. Vid, Association of Export and bottles of wine
")
Area planted with grapes in Chile 19852000 (S. A. G. )
 Source: S. A. G.")
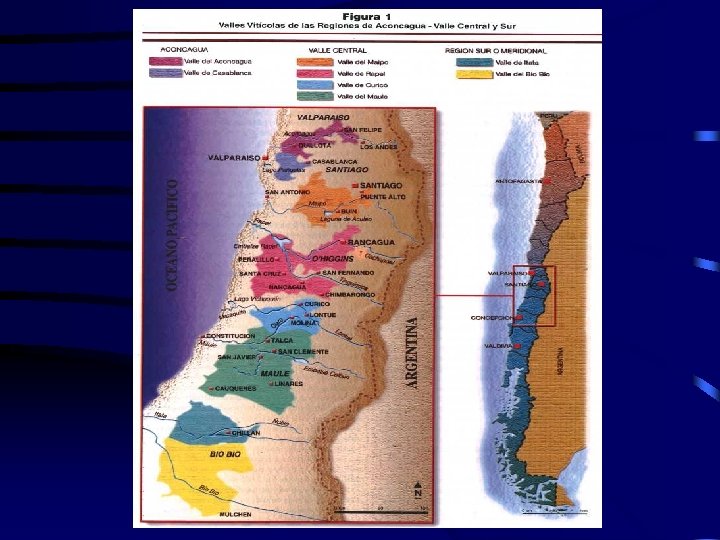
CHILE Catastro vinicola nacional año 1998 (superficie por regiones) Source: S. A. G.

Trend in chilean wine exports, years 1988 -2000.

Trends in area planted white cultivars

Trends in area planted red cultivars
 1. Francia 2. Italia 3.")
World wine production. % participation (O. I. V. ) 1. Francia 2. Italia 3. España 4. EE. UU. 5. Argentina 6. Sudáfrica 7. Portugal 8. Alemania 9. Rumania 10. Australia 21, 3 21, 0 11, 6 6, 6 4, 5 3, 6 3, 4 3, 0 2, 7 2, 4 11. China 12. Grecia 13. Hungría 14. Chile 15. Yugoslavia 16. Rusia 17. Austria 18. Bulgaria 19. Croacia 20. Suiza 1, 5 1, 4 1, 2 1, 0 0, 7 0, 6 0, 5

Countries’ Exports 2000 Source: COMTRADE
 Source:")
Chile’s share of world’s wine export market 1976 - 2000 (Million Lts. ) Source: Data from O. I. V. , S. A. G. and I. N. V.
 185 Mill lts. (+8.")
Chilean Wine Exports 2000 • Bottled: USM$ 495 (+11. 9%) 185 Mill lts. (+8. 8%) • Bulk : USM$ 61. 4 (-2. 4%) 70. 5 Mill lts. (+16. 5%) • Change in average price: bottled US$ 24 box (=) bulk US$ 0. 87 /liter (↓) • Total exports 2000: US$ 573 million

Main chilean wine markets

Ten major wine exporters 1988 and 2001 Sources: Newspaper Estrategia, May, Monday 11 of 1998. and Prochile
. • US$ 600 million (or more? )")
Investments in the industry (last 5 years). • US$ 600 million (or more? ) – Concha y Toro US$7 mill. – Santa Rita US$15 mill – San Pedro US$ 45 mill (97 -98) – Errázuriz US$ 13 mill. – Other wineries with projects ranging from US$1 to 9 million. • Foreign investment: fresh US$/strategic

Quality puzzle Climate soil Vitic. practices Cultivar/r ootstock Enological practice

Chile’s conditions • Weather: Superb conditions, with high temperature variability, dry summers (Aconcagua through Maule) • Soil: Very good in some valleys (Casablanca, Curico and Maule), Good in Maipo Challenge: Look for poorer soils • Varietals: Have good stock of main international varietals, so far no need of grafts

Central valley: deep and fertile soils

Coastal range and interior dryland: shallow and poor soils

Chilean viticulture industry: • • Large traditional producers of table wines Early new producers Late entries Fine wine producers (new viticulture)

Current Situation • Large wineries buying grapes and wine cheap, selling fine through established commercializations channels • Early new entries doing fine, with own grape and some purchased, having established brand commercialization channels • Late entries are doing well if have established enough sales through branding, otherwise struggling by selling too much in bulk

New viticulture • Goals: – Maximize the production fruit of the best quality at a low cost. – Improve efficiency (lower inputs, mechanization, etc. ) – Care for the environment (vineyard and labor) : • Personal / Marketing • Results to be seen, good prospect

Challenges/opportunities for growth: • • Chile is not alone: SA. Aust. USA, etc. Commercial barriers Others: filoxera, etc. New valleys, new wines Cultivar Carmenère Clean viticulture (organic /integrated) Investment in viticultural technology

Road Map • Develop integrated strategies and technologies for: - Marketing - Winery - Vineyard • Implement innovation approach founded on sistematic learning to provide quality and uniqueness • Implement new viticulture • Integrate with tourism

Grape&Wine Tech. Center: Goals • Improve competitiveness of Chilean wines in export markets by solving technological problems of the wine industry • Become a place for exchange of ideas between researchers, professionals and growers about problems of our industry • Establish a permanent extension program in viticulture, enology and economic management for the industry.

END THANK YOU

Research programs: viticulture • Cultivar purity: development of DNA techniques for cultivar identification • Phytosanitary purity: diagnosis and cleaning of grape viruses • Introduction and testing of new cultivars, clones and rootstocks in Chile • Local clonal selection: Carmenere & others

Research programs: viticulture • Canopy management techniques and training systems • Irrigation and plant nutrition strategies • Vineyard mechanization:

Services to the industry • • • Wine analysis Bud fertility analysis Virus analysis in grapes (ELISA) Identification on cultivars (DNA) Denomination of Origin Control Quality control of enological supplies
 • Soil and tissue analysis • Site")
Services • Irrigation schedulling in vineyards (SIAR) • Soil and tissue analysis • Site selection/evaluation for vineyard establishment • Technical assistance(specific problem)
 Source: Elaborate by ODEPA")
CHILE Production of wines for consumption (Thousands of liters ) Source: Elaborate by ODEPA with information of the SAG Note: 1_ / It doesn't include the production of concentrated must neither chicha
 Source: Elaborate by ODEPA with information of the SAG")
CHILE Area of Vides (Hectares) Source: Elaborate by ODEPA with information of the SAG
 • • Chardonnay Sauvignon Blanc Mosc. Alejandría Semillón Torontel")
Area planted: white cultivars (ha) • • Chardonnay Sauvignon Blanc Mosc. Alejandría Semillón Torontel White mixed vineyards Chasselas 7, 672 6, 662 5, 978 1, 892 1, 067 401 404
 • • • Riesling Moscatel Rosada Gewurztraminer Blanca Ovoide")
Area planted: white cultivars (ha) • • • Riesling Moscatel Rosada Gewurztraminer Blanca Ovoide Chenin Blanc Pinot Blanc 286 183 121 106 76 13
 • • Cabernet Sauvignon Pais Merlot Carménère Tintoreras Sirah")
Area planted: red cultivars (ha) • • Cabernet Sauvignon Pais Merlot Carménère Tintoreras Sirah Pinot Noir 35, 967 15, 180 12, 824 4, 719 2, 520 2, 039 1, 613
 • • Cot Cabernet Franc Carignan Alicante Bouschet Other")
Area planted: red cultivars (ha) • • Cot Cabernet Franc Carignan Alicante Bouschet Other reds Cinsaut Sangiovese 929 689 641 362 263 195 123
 • • Zinfandel Mix red vineyards Petit Verdot Mourvedre")
Area planted: red cultivars (ha) • • Zinfandel Mix red vineyards Petit Verdot Mourvedre 90 87 74 23
 (O. I. V. ) 1. Italia 2.")
World exports of wine. % participation (%) (O. I. V. ) 1. Italia 2. Francia 3. España 4. Alemania 5. Bulgaria 6. Portugal 7. Chile 8. Moldavia 9. EE. UU. 26, 3 21, 4 11, 7 5, 2 3, 6 3, 4 3, 2 2, 8 10. Hungría 11. Australia 12. Argentina 13. Sudáfrica 2, 6 2, 5 2, 1 1, 7

Destination of Chilean bottled wine exports 2001
- Slides: 46