
Childrens Worlds International Survey of Childrens WellBeing Conducting

Children’s Worlds International Survey of Children’s Well-Being Conducting Cross-Country Comparative Research Shazly Savahl 1 & Sabirah Adams 2 Donnay Manuel 1, Mulalo Mpilo 1 1 Child & Family Studies, University of the Western Cape 2 Centre for Higher Education Development, University of Cape Town
Outline of presentation • Key Issues in Cross-cultural Research • Cross-Country Comparisons (Safety and Bullying)
The structure of subjective well-being • Subjective well-being is generally defined as a broad concept that includes the cognitive and affective evaluations that individuals make concerning their lives, the events influencing their lives and the circumstances in which they live • The cognitive element refers to perceptions of global and domain specific life satisfaction, while the affective element refers to the experience of positive and negative affect. • These components are conceptualised as fitting on a hierarchical structure; being moderately correlated, conceptually related, with each making a unique contribution towards subjective well-being. • When we ask children about their subjective well-being, we are essentially asking them to appraise the extent to which they are satisfied with their life in general, with various aspects of their life, and how they feel about their life.

Model 1: SWB as 3 Separate Components Busseri and Sadava (2011) SWB
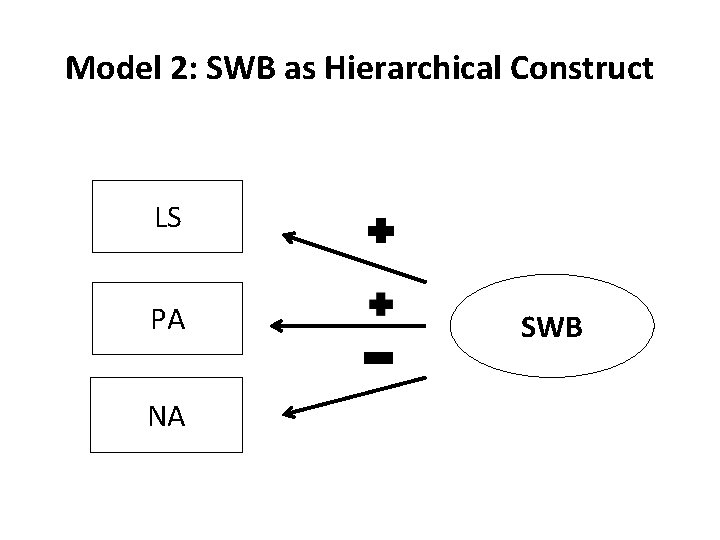
Model 2: SWB as Hierarchical Construct LS PA NA SWB
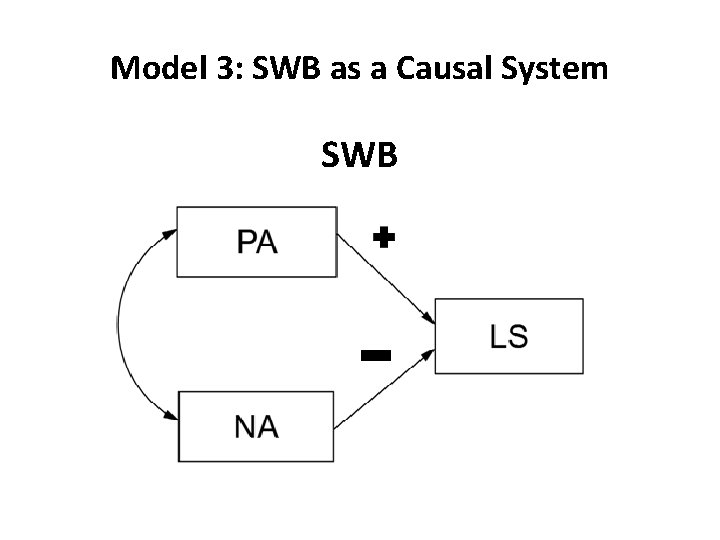
Model 3: SWB as a Causal System SWB

Model 4: SWB as a Composite
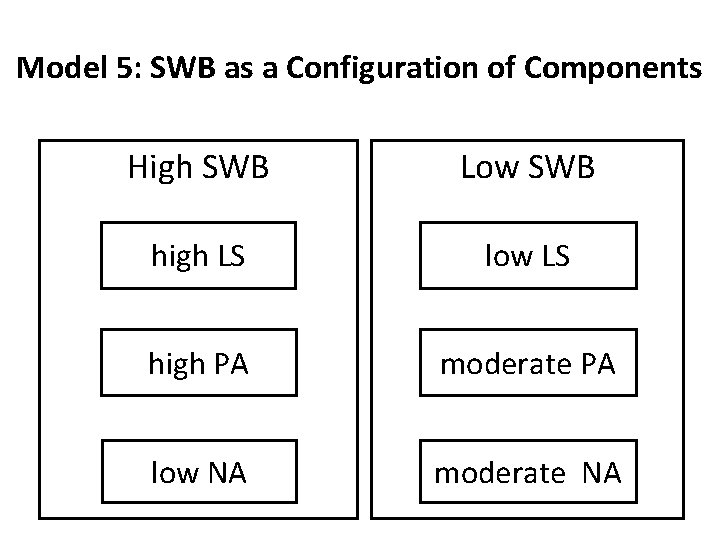
Model 5: SWB as a Configuration of Components High SWB Low SWB high LS low LS high PA moderate PA low NA moderate NA
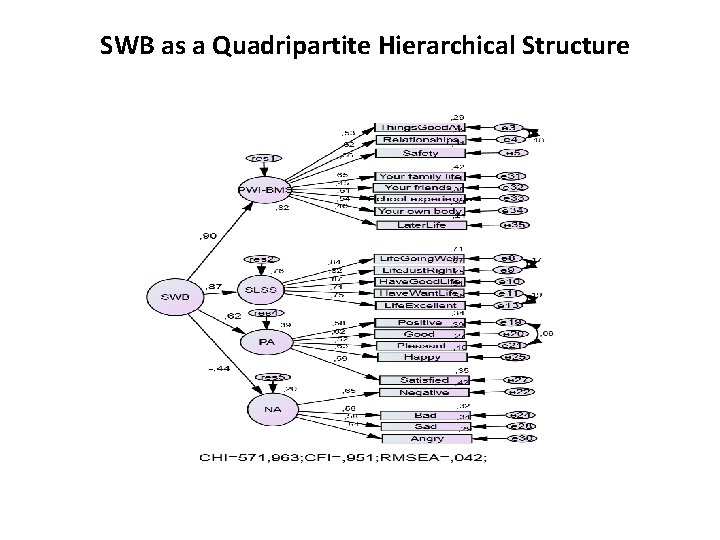
SWB as a Quadripartite Hierarchical Structure
Children’s Worlds: International Survey of Children’s Well-Being What measures do we have • Over the past few years researchers have developed (adapted) a range of scales (measures) which have demonstrated sound psychometric properties; most notably structural validity: • SLSS (context-free) • BMSLSS (concretely worded) • PWI-SC (abstractly worded) • CWSWBS • SPANE • PANAS-C • Children’s Worlds Survey has made substantial advancements with these instruments, especially as it relates to cross-culturally measuring SWB in children • The key questions are: – is SWB perceived and experienced universally by all children? – and if so, how do we best measure SWB? – and if so, can we meaningfully compare results across different countries?
• First Wave: (Deep Pilot): Is SWB in children universal? Can we measure SWB in children in different contexts? How do we measure SWB? • Second Wave: Can we meaningfully compare SWB across cultures/countries? • Third Wave: How can we improve the measurement of SWB in children?
Second Wave: Can we meaningfully compare SWB across cultures/countries? • Casas 2016 has shown varying degrees of measurement equivalence of SWB measures used in Second Wave • Countries are somewhat (partially) comparable on instruments across countries. The items have the same meaning across countries. • Countries can be meaningfully compared by correlations, regression coefficients and mean scores.
Third Wave: How can we improve the measurement of SWB in children?
Comparative and cross-cultural research • Comparative research: it is key to consider cultural diversity within and across nations (e. g. racial-ethnic, religious, language etc. ) (Byrne et al. , 2009) • Given the substantial increase in cross-cultural research, three trends that have emerged: 1. More researchers conducting cross-cultural research with little formal training 2. Adaptation of instruments for use within a particular context(s) 3. Expertise in advance research design and statistical analyses • These three conditions plays an important role in preparation and practices of researchers • Cultural differences, such as language, societal structures, values, and socialization practices, can contribute to differences in the meaning or structure of a measured construct and the perception of its related item content
Overarching methodological concerns in cross-country research a) assumption of equivalent psychological meaning and factorial structure of a measuring instrument across cultural groups • Functional equivalence (does the construct exist in all groups studied) • Structural equivalence/ construct (extent to which the meaning and dimensional structure of a psychological construct are identical across cultural groups) • Measurement equivalence (extent to which both the item content and psychometric properties of the instrument are similar across groups, e. g. item translation is a special case of measurement equivalence and linguistic equivalence) – Configural (is the basic structure same structure across groups) – Metric (are loading weights identical across groups – allows for comparison by correlations, regressions) – Scalar (are intercepts, origin of measurement scale, identical across groups – allows for mean comparisons) b) failure to take into account the hierarchical nature of the cultural data, and c) lack of familiarity with ethical issues governing scale adaptation and use in diverse cultural settings • Cross-cultural data are hierarchically (multi-level) structured: Individuals are nested within culture • Consider individual and country level • Country Ethics Codes for research; International Test Commission • The importance of training emerging researchers with expertise in the above • It is crucial to consider the above in conducting comparative analysis using the Children’s Worlds data (Byrne et al. , 2019)
Overarching methodological concerns in cross-country research • Key Questions: – How can identify and prevent non-equivalence? – What strategies can be used for overcoming measurement bias? • Take note of instrument construction adaptation/translation*/data collection procedures (measurement bias) • Take note of in-country variation (especially in multicultural societies). Are in-country samples of children a homogenous group? – For example in SA even ‘Black African’ culture are not homogenous – Substantial cultural variation in ‘Black African culture’** • Caution against cross-country comparisons without establishing intra-country measurement invariance
Children’s Worlds Wave 3 South Africa • 11 official languages • Wave 3 (8 languages – including English) – Followed procedure as outlined by the International Test Commission “The ITC Guidelines for Translating and Adapting Tests” (2017, 2 nd edition) – A double-translation and reconciliation procedure using a 3 rd translator and expert committee – Cognitive testing with children • Administration of questionnaire was uniform – One group of researchers responsible for data collection, accompanied by one of the project PI’s – Researchers received training (especially on scale response options and items that were potentially difficult to understand) – Building rapport (‘buy in’) with children was crucial in contributing to the answering of the questionnaire. Children were more enthusiastic and excited.
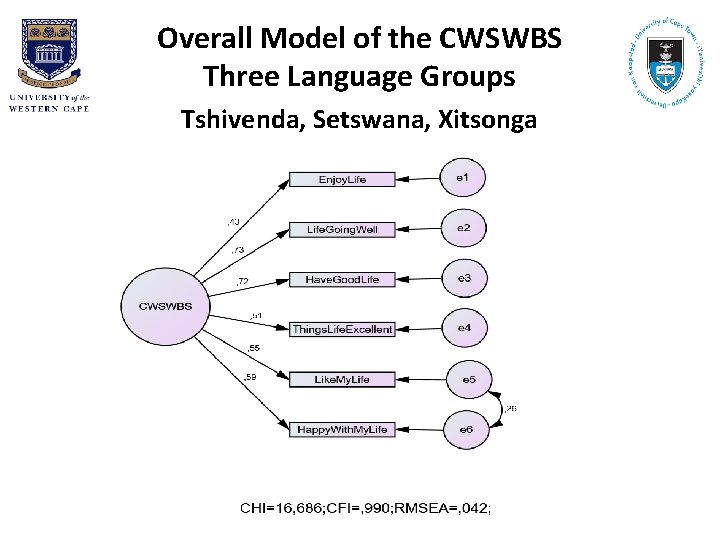
Overall Model of the CWSWBS Three Language Groups Tshivenda, Setswana, Xitsonga
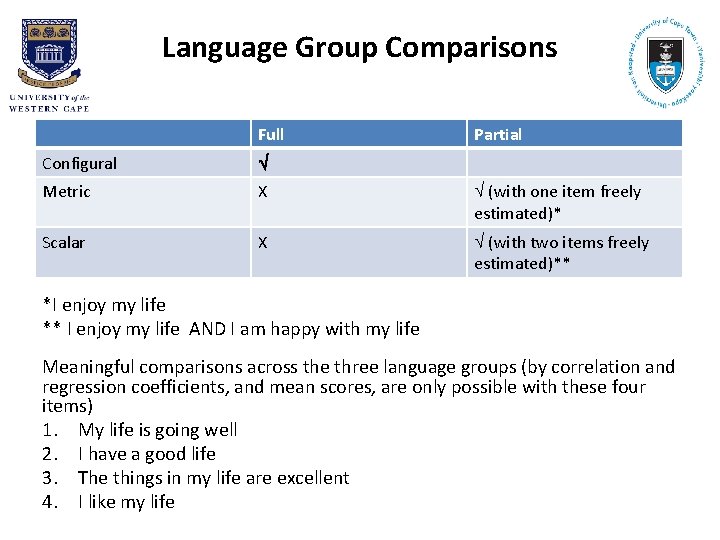
Language Group Comparisons Full Partial Configural Metric X (with one item freely estimated)* Scalar X (with two items freely estimated)** *I enjoy my life ** I enjoy my life AND I am happy with my life Meaningful comparisons across the three language groups (by correlation and regression coefficients, and mean scores, are only possible with these four items) 1. My life is going well 2. I have a good life 3. The things in my life are excellent 4. I like my life
Wave 3: Preliminary Cross-Country Descriptive Analysis (Safety and Bullying Items)
Method: Children’s Worlds Wave 3 10 Year Old Dataset • The data: – 10 -year olds – 22 countries – Unweighted preliminary data – Total sample: N = 35 157 • There were six items that had less than 10% missing data, – the item on overall safety (Satisfaction with how safe you feel) had the lowest level of missing data (1. 6%). – The questions on sibling bullying victimisation are not included in the current analysis
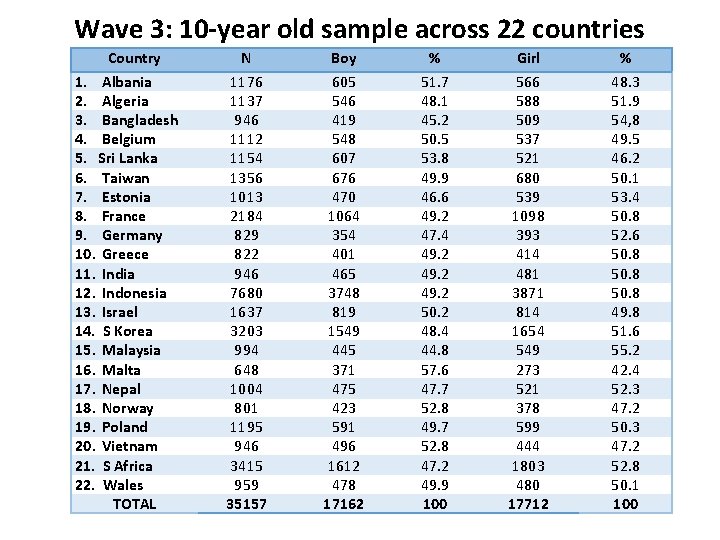
Wave 3: 10 -year old sample across 22 countries Country 1. Albania 2. Algeria 3. Bangladesh 4. Belgium 5. Sri Lanka 6. Taiwan 7. Estonia 8. France 9. Germany 10. Greece 11. India 12. Indonesia 13. Israel 14. S Korea 15. Malaysia 16. Malta 17. Nepal 18. Norway 19. Poland 20. Vietnam 21. S Africa 22. Wales TOTAL N 1176 1137 946 1112 1154 1356 1013 2184 829 822 946 7680 1637 3203 994 648 1004 801 1195 946 3415 959 35157 Boy 605 546 419 548 607 676 470 1064 354 401 465 3748 819 1549 445 371 475 423 591 496 1612 478 17162 % 51. 7 48. 1 45. 2 50. 5 53. 8 49. 9 46. 6 49. 2 47. 4 49. 2 50. 2 48. 4 44. 8 57. 6 47. 7 52. 8 49. 7 52. 8 47. 2 49. 9 100 Girl 566 588 509 537 521 680 539 1098 393 414 481 3871 814 1654 549 273 521 378 599 444 1803 480 17712 % 48. 3 51. 9 54, 8 49. 5 46. 2 50. 1 53. 4 50. 8 52. 6 50. 8 49. 8 51. 6 55. 2 42. 4 52. 3 47. 2 50. 3 47. 2 52. 8 50. 1 100
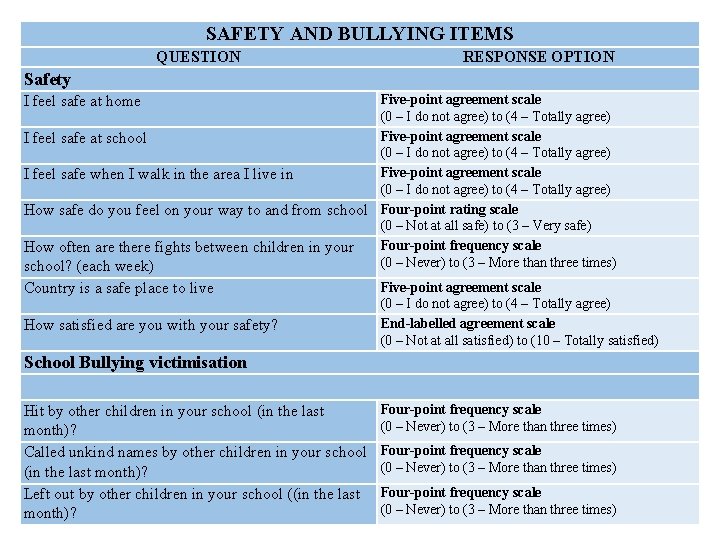
SAFETY AND BULLYING ITEMS QUESTION Safety RESPONSE OPTION Five-point agreement scale (0 – I do not agree) to (4 – Totally agree) Five-point agreement scale I feel safe at school (0 – I do not agree) to (4 – Totally agree) Five-point agreement scale I feel safe when I walk in the area I live in (0 – I do not agree) to (4 – Totally agree) How safe do you feel on your way to and from school Four-point rating scale (0 – Not at all safe) to (3 – Very safe) Four-point frequency scale How often are there fights between children in your (0 – Never) to (3 – More than three times) school? (each week) I feel safe at home Country is a safe place to live How satisfied are you with your safety? Five-point agreement scale (0 – I do not agree) to (4 – Totally agree) End-labelled agreement scale (0 – Not at all satisfied) to (10 – Totally satisfied) School Bullying victimisation Hit by other children in your school (in the last month)? Called unkind names by other children in your school (in the last month)? Left out by other children in your school ((in the last month)? Four-point frequency scale (0 – Never) to (3 – More than three times)
Reliability analysis across safety and bullying items SAFETY ACROSS THREE SETTINGS Country Cronbach's Alpha Albania. 365 Algeria. 355 Belgium. 479 Sri Lanka. 445 Taiwan. 611 Estonia. 517 France. 496 Greece. 572 Indonesia. 449 S Korea. 493 Malta. 547 Nepal. 591 Norway. 387 Vietnam. 636 S Africa. 578 Wales. 463 Pooled Sample. 512 SCHOOL BULLYING VICTIMIZATION Country Cronbach's Alpha Albania. 639 Algeria. 535 Bangladesh. 579 Belgium. 738 Sri Lanka. 671 Taiwan. 619 Estonia. 753 France. 624 Germany. 716 Greece. 659 India. 595 Indonesia. 691 Israel. 697 S Korea. 207 Malaysia. 572 Malta. 711 Nepal. 658 Norway. 663 Poland. 728 Vietnam. 560 S Africa. 605 Wales. 699 Pooled Sample. 707
RESULTS: SAFETY
Safety across contexts: overall 80 70 60 50 % of children I do not agree Agree a little bit 40 Agree somewhat Agree a lot 30 Totally agree 20 10 0 I feel safe at home I feel safe at school I feel safe when I walk in [Country] is a safe place to the area I live in live
I feel safe at home: by country S Africa Nepal Vietnam Germany India Algeria Malaysia Indonesia Belgium Sri Lanka Israel Malta France Wales Norway Estonia S Korea Taiwan Albania Greece Poland 4. 6 3. 8 3. 4 3. 2 3 2. 8 2. 4 2. 3 2 1. 8 1. 7 1. 5 1. 4 1. 3 1 0. 9 0. 8 0. 6 0. 4 0% 10% 20% I do not agree 30% Agree a little 40% 50% Agree somewhat 60% Agree a lot 70% 80% Totally agree 90% 100%
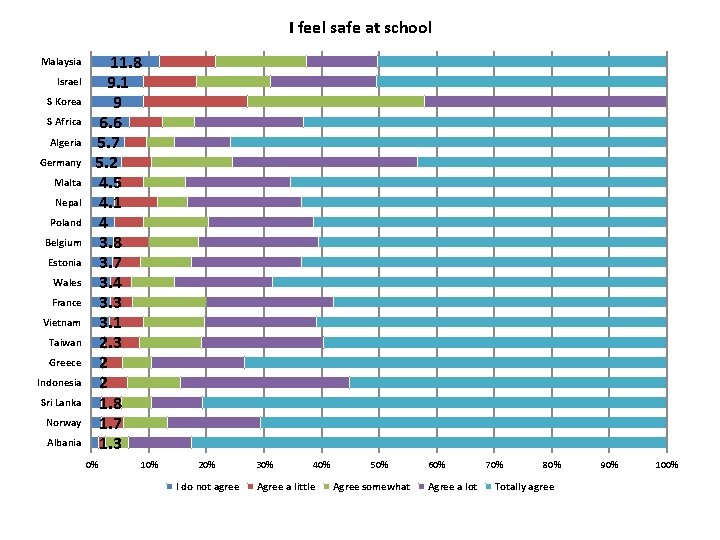
I feel safe at school Malaysia Israel S Korea S Africa Algeria Germany Malta Nepal Poland Belgium Estonia Wales France Vietnam Taiwan Greece Indonesia Sri Lanka Norway Albania 11. 8 9. 1 9 6. 6 5. 7 5. 2 4. 5 4. 1 4 3. 8 3. 7 3. 4 3. 3 3. 1 2. 3 2 2 1. 8 1. 7 1. 3 0% 10% 20% I do not agree 30% 40% Agree a little 50% Agree somewhat 60% Agree a lot 70% 80% Totally agree 90% 100%
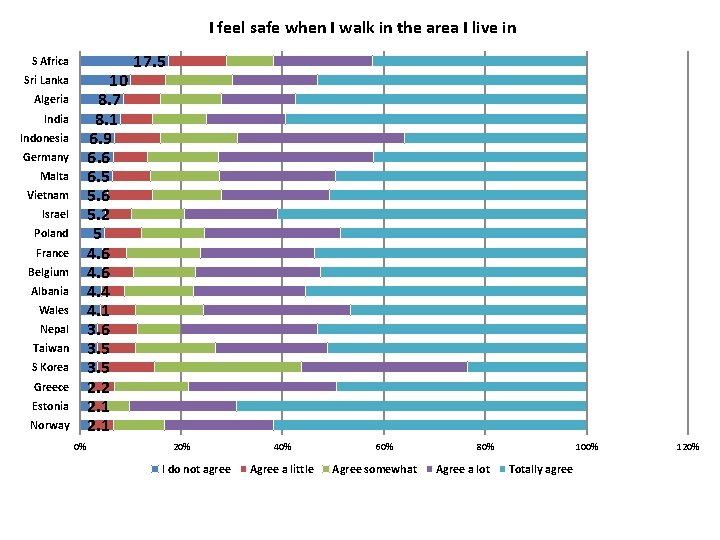
I feel safe when I walk in the area I live in S Africa 10 8. 7 8. 1 6. 9 6. 6 6. 5 5. 6 5. 2 5 4. 6 4. 4 4. 1 3. 6 3. 5 2. 2 2. 1 Sri Lanka Algeria Indonesia Germany Malta Vietnam Israel Poland France Belgium Albania Wales Nepal Taiwan S Korea Greece Estonia Norway 0% 17. 5 20% I do not agree 40% Agree a little 60% Agree somewhat 80% Agree a lot 100% Totally agree 120%
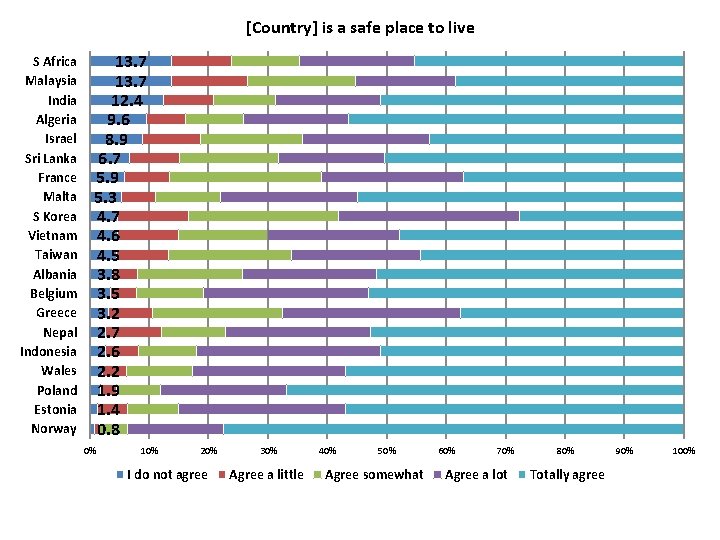
[Country] is a safe place to live S Africa Malaysia India Algeria Israel Sri Lanka France Malta S Korea Vietnam Taiwan Albania Belgium Greece Nepal Indonesia Wales Poland Estonia Norway 13. 7 12. 4 9. 6 8. 9 6. 7 5. 9 5. 3 4. 7 4. 6 4. 5 3. 8 3. 5 3. 2 2. 7 2. 6 2. 2 1. 9 1. 4 0. 8 0% 10% 20% I do not agree 30% Agree a little 40% 50% Agree somewhat 60% 70% Agree a lot 80% Totally agree 90% 100%
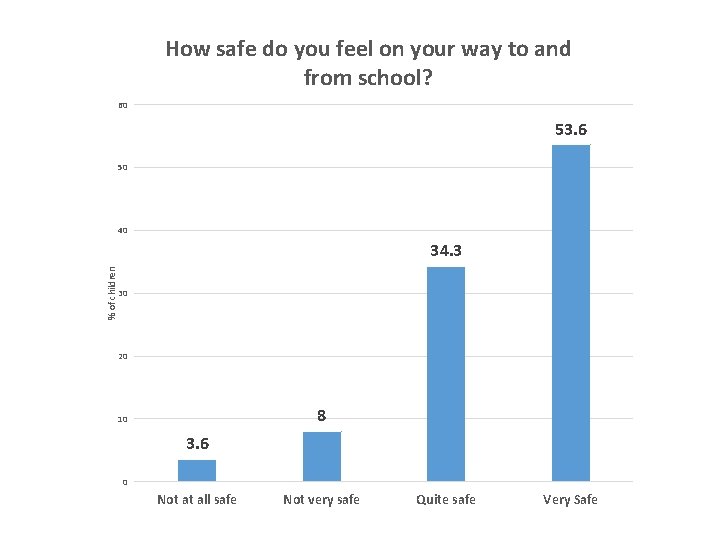
How safe do you feel on your way to and from school? 60 53. 6 50 40 % of children 34. 3 30 20 8 10 3. 6 0 Not at all safe Not very safe Quite safe Very Safe
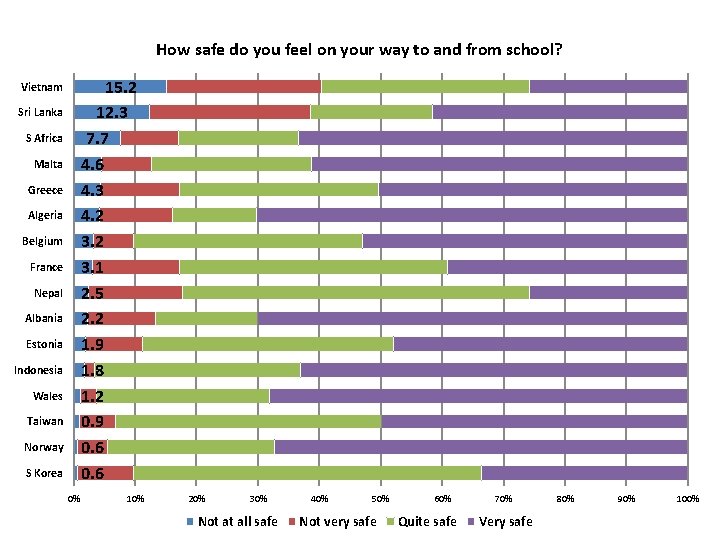
How safe do you feel on your way to and from school? 15. 2 12. 3 7. 7 4. 6 4. 3 4. 2 3. 1 2. 5 2. 2 1. 9 1. 8 1. 2 0. 9 0. 6 Vietnam Sri Lanka S Africa Malta Greece Algeria Belgium France Nepal Albania Estonia Indonesia Wales Taiwan Norway S Korea 0% 10% 20% 30% Not at all safe 40% 50% Not very safe 60% Quite safe 70% Very safe 80% 90% 100%
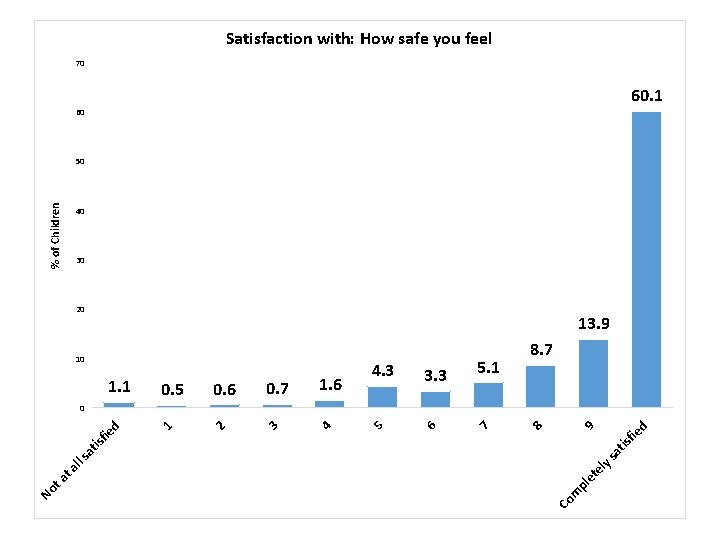
Satisfaction with: How safe you feel 70 60. 1 60 % of Children 50 40 30 20 13. 9 10 1. 1 0. 5 0. 6 0. 7 1. 6 4. 3 3. 3 5. 1 8. 7 d 9 8 7 6 5 4 3 2 1 et pl m Co No t a el ll y s sa at tis isf ie fie d 0
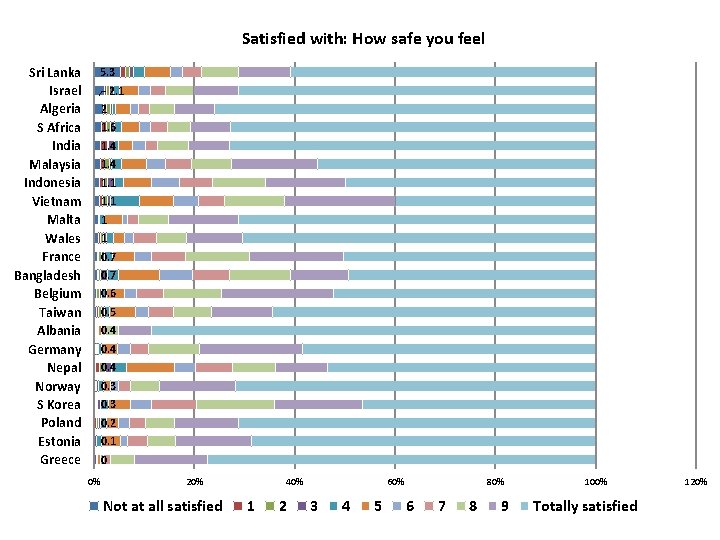
Satisfied with: How safe you feel Sri Lanka Israel Algeria S Africa India Malaysia Indonesia Vietnam Malta Wales France Bangladesh Belgium Taiwan Albania Germany Nepal Norway S Korea Poland Estonia Greece 5. 3 2. 1 2 1. 6 1. 4 1. 1 1 1 0. 7 0. 6 0. 5 0. 4 0. 3 0. 2 0. 1 0 0% 20% Not at all satisfied 40% 1 2 60% 3 4 5 80% 6 7 8 9 100% Totally satisfied 120%
RESULTS: BULLYING VICTIMISATION
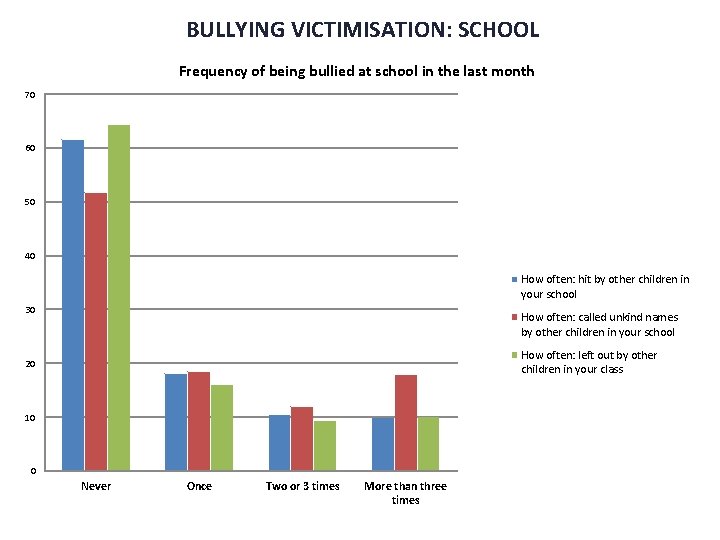
BULLYING VICTIMISATION: SCHOOL Frequency of being bullied at school in the last month 70 60 50 40 How often: hit by other children in your school 30 How often: called unkind names by other children in your school How often: left out by other children in your class 20 10 0 Never Once Two or 3 times More than three times
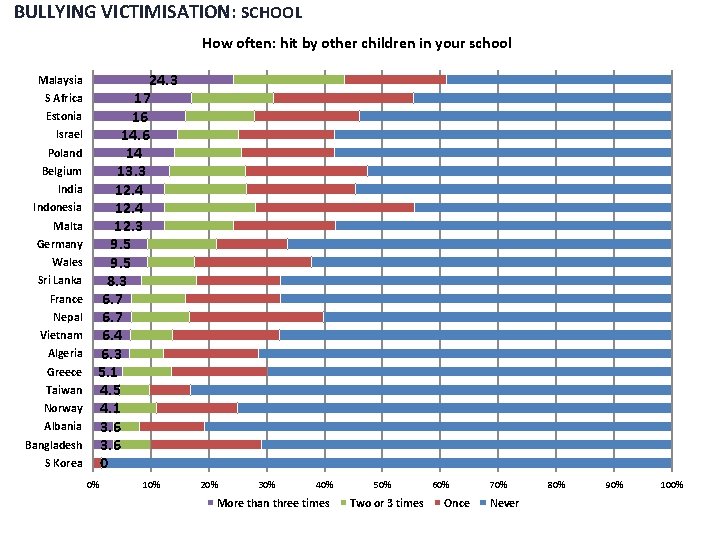
BULLYING VICTIMISATION: SCHOOL How often: hit by other children in your school Malaysia S Africa Estonia Israel Poland Belgium India Indonesia Malta Germany Wales Sri Lanka France Nepal Vietnam Algeria Greece Taiwan Norway Albania Bangladesh S Korea 24. 3 17 16 14 13. 3 12. 4 12. 3 9. 5 8. 3 6. 7 6. 4 6. 3 5. 1 4. 5 4. 1 3. 6 0 0% 10% 20% 30% 40% More than three times 50% Two or 3 times 60% Once 70% Never 80% 90% 100%
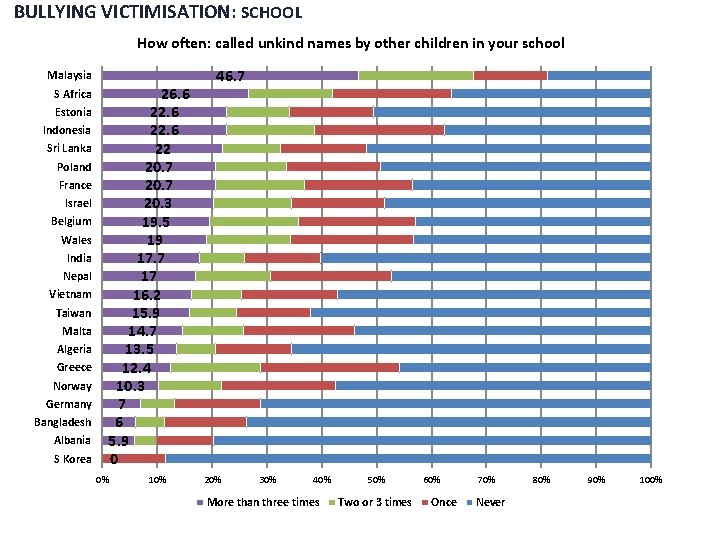
BULLYING VICTIMISATION: SCHOOL How often: called unkind names by other children in your school Malaysia S Africa Estonia Indonesia Sri Lanka Poland France Israel Belgium Wales India Nepal Vietnam Taiwan Malta Algeria Greece Norway Germany Bangladesh Albania S Korea 26. 6 22 20. 7 20. 3 19. 5 19 17. 7 17 16. 2 15. 9 14. 7 13. 5 12. 4 10. 3 7 6 5. 9 0 0% 10% 46. 7 20% 30% 40% More than three times 50% Two or 3 times 60% Once 70% Never 80% 90% 100%
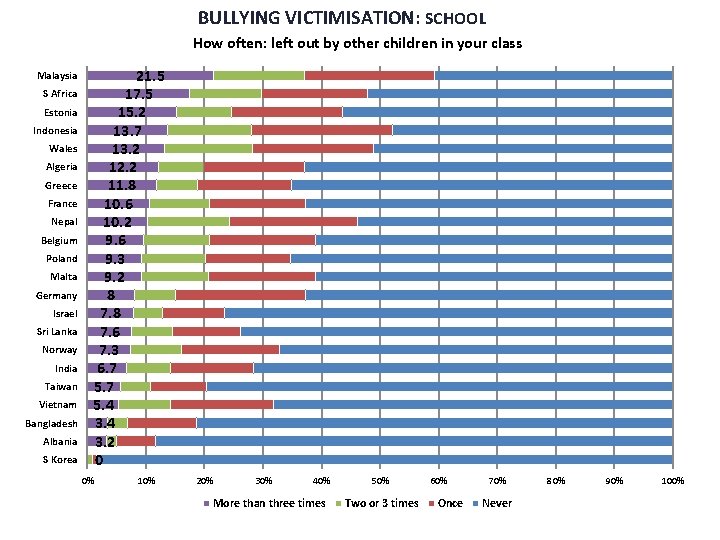
BULLYING VICTIMISATION: SCHOOL How often: left out by other children in your class Malaysia S Africa Estonia Indonesia Wales Algeria Greece France Nepal Belgium Poland Malta Germany Israel Sri Lanka Norway India Taiwan Vietnam Bangladesh Albania S Korea 21. 5 17. 5 15. 2 13. 7 13. 2 12. 2 11. 8 10. 6 10. 2 9. 6 9. 3 9. 2 8 7. 6 7. 3 6. 7 5. 4 3. 2 0 0% 10% 20% 30% 40% More than three times 50% Two or 3 times 60% Once 70% Never 80% 90% 100%
RESULTS: SAFETY AND BULLYING VICTIMISATION ACROSS DEVELOPED AND DEVELOPING COUNTRIES
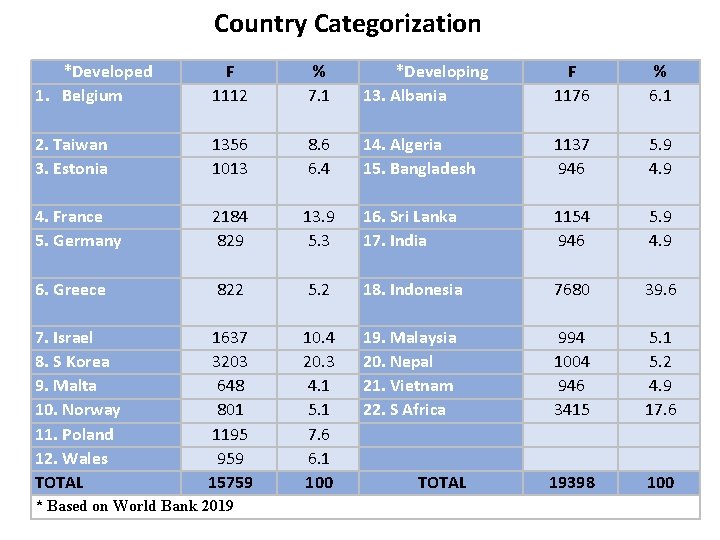
Country Categorization *Developed 1. Belgium F 1112 % 7. 1 *Developing 13. Albania F 1176 % 6. 1 2. Taiwan 3. Estonia 1356 1013 8. 6 6. 4 14. Algeria 15. Bangladesh 1137 946 5. 9 4. France 5. Germany 2184 829 13. 9 5. 3 16. Sri Lanka 17. India 1154 946 5. 9 4. 9 6. Greece 822 5. 2 18. Indonesia 7680 39. 6 1637 3203 648 801 1195 959 15759 10. 4 20. 3 4. 1 5. 1 7. 6 6. 1 100 19. Malaysia 20. Nepal 21. Vietnam 22. S Africa TOTAL 994 1004 946 3415 19398 5. 1 5. 2 4. 9 17. 6 100 7. Israel 8. S Korea 9. Malta 10. Norway 11. Poland 12. Wales TOTAL * Based on World Bank 2019
I feel safe at home t lo re e a g lly To ta ha t re e a Ag t b i tle ew m re e so Ag e gr e a no t a lit ee Ag r I d o t lo re e a g lly To ta t t ha re e a Ag ew m b i tle gr ee ot a a lit re e so Ag ee Ag r o n I d t lo re e a g lly To ta t ha re e a Ag t b i tle ew m re e so Ag e gr e a a lit ee Ag r no t I d o % Safety across three settings by developed and developing countries 90 80 70 60 50 40 Developed 30 Developing 20 10 0 I feel safe at I feel safe in the area school I live in
Safety and fights at school 70 60 50 % 40 Developed 30 Developing 20 10 0 Not at all safe Not very Quite safe Very safe Safe to and from school Never Less than At least Most days once a week Every day Fights between children at school
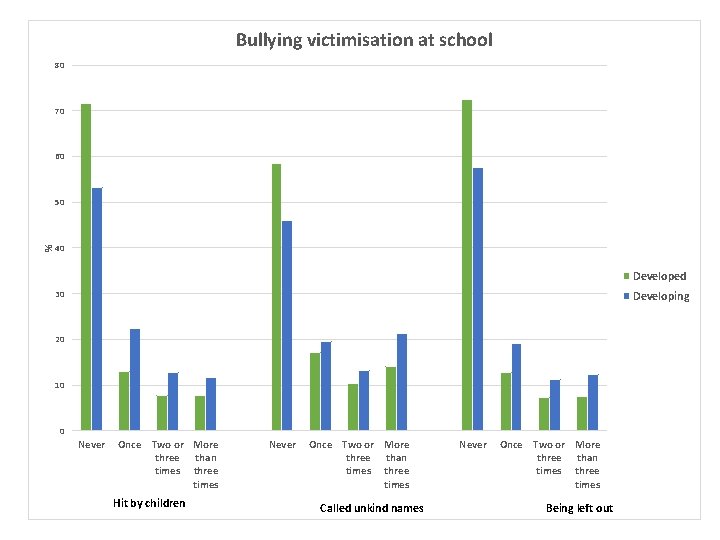
Bullying victimisation at school 80 70 60 % 50 40 Developed 30 Developing 20 10 0 Never Once Two or More three than times three times Hit by children Never Once Two or More three than times three times Called unkind names Never Once Two or More three than times three times Being left out
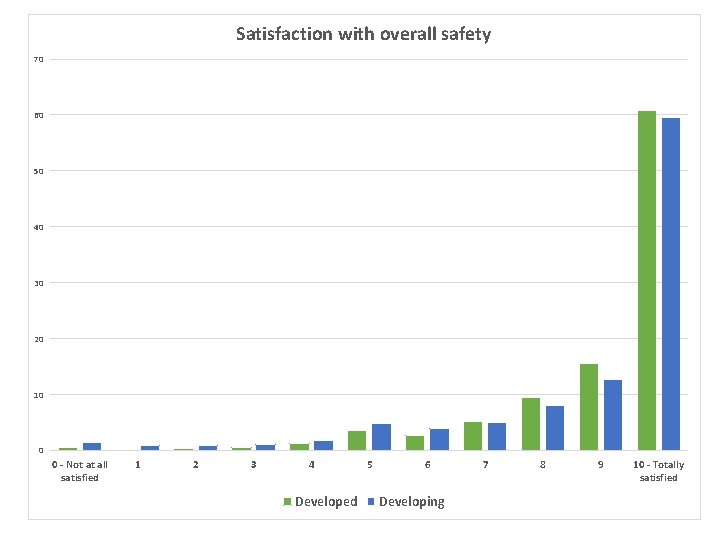
Satisfaction with overall safety 70 60 50 40 30 20 10 0 0 - Not at all satisfied 1 2 3 4 Developed 5 6 Developing 7 8 9 10 - Totally satisfied
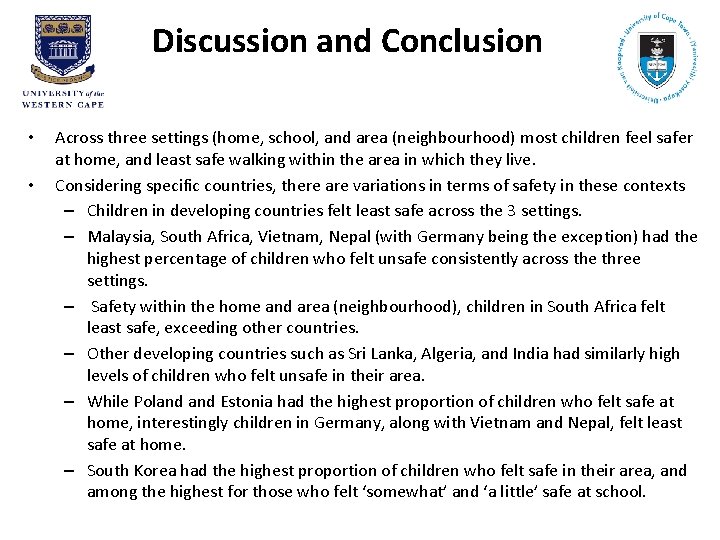
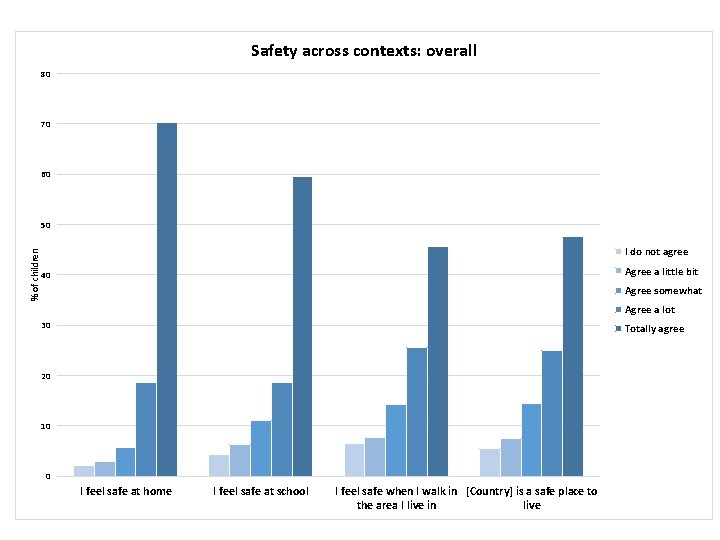
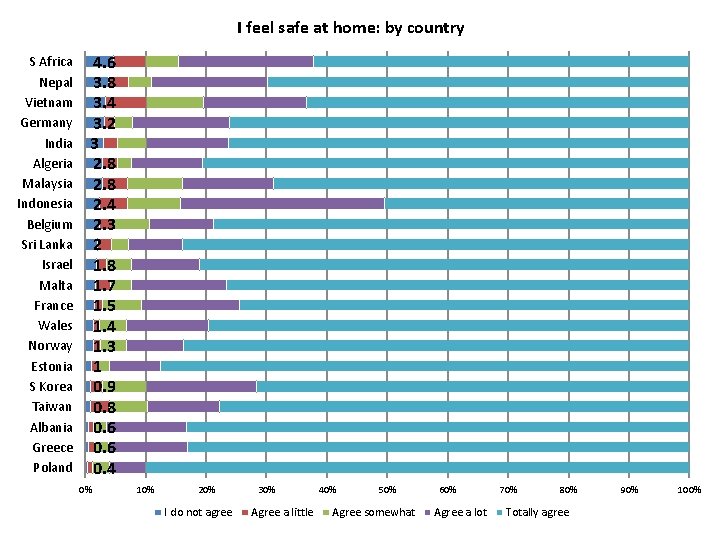
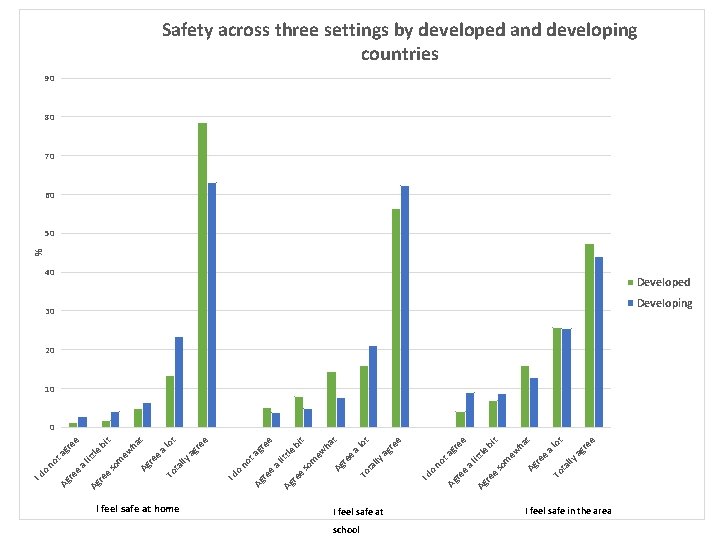
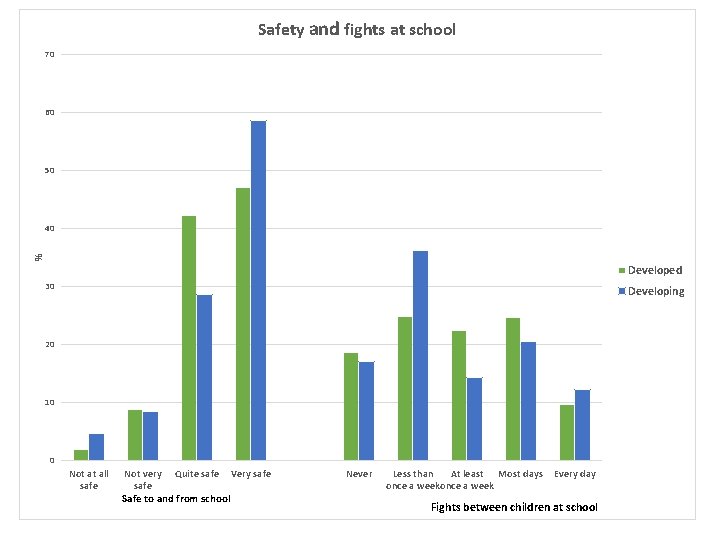
Discussion and Conclusion • • Across three settings (home, school, and area (neighbourhood) most children feel safer at home, and least safe walking within the area in which they live. Considering specific countries, there are variations in terms of safety in these contexts – Children in developing countries felt least safe across the 3 settings. – Malaysia, South Africa, Vietnam, Nepal (with Germany being the exception) had the highest percentage of children who felt unsafe consistently across the three settings. – Safety within the home and area (neighbourhood), children in South Africa felt least safe, exceeding other countries. – Other developing countries such as Sri Lanka, Algeria, and India had similarly high levels of children who felt unsafe in their area. – While Poland Estonia had the highest proportion of children who felt safe at home, interestingly children in Germany, along with Vietnam and Nepal, felt least safe at home. – South Korea had the highest proportion of children who felt safe in their area, and among the highest for those who felt ‘somewhat’ and ‘a little’ safe at school.
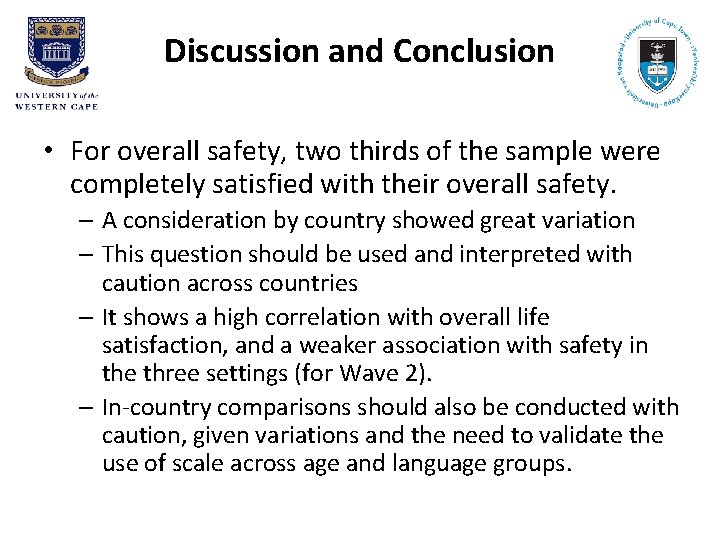
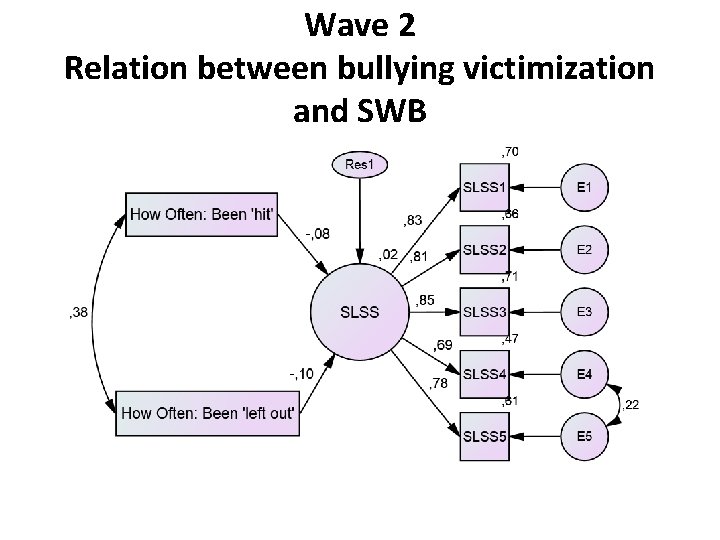
Discussion and Conclusion • For overall safety, two thirds of the sample were completely satisfied with their overall safety. – A consideration by country showed great variation – This question should be used and interpreted with caution across countries – It shows a high correlation with overall life satisfaction, and a weaker association with safety in the three settings (for Wave 2). – In-country comparisons should also be conducted with caution, given variations and the need to validate the use of scale across age and language groups.
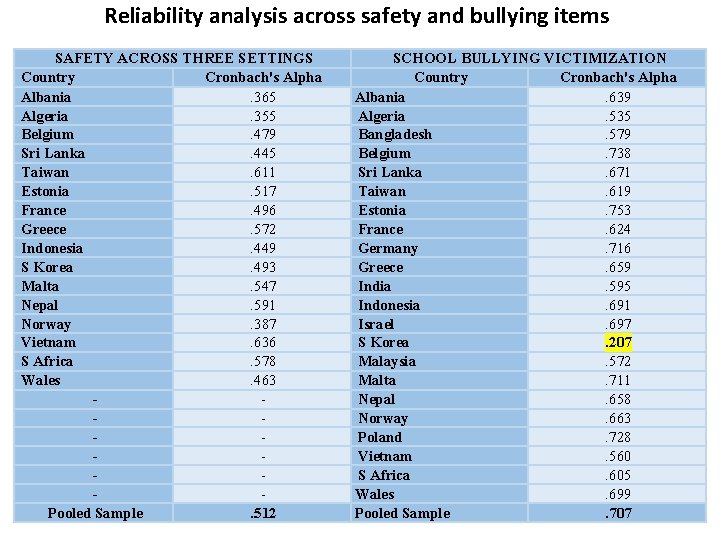
Considerations for research teams • • • This preliminary analysis has indicated that the items on safety and bullying victimisation work well across the 22 countries for the 10 -year olds. It is evident that the three items on bullying victimisation work well as a scale across most countries, except South Korea (α =. 207) and should perhaps not be used as a scale in this context. It was also found that the 3 items on safety across three contexts (home, school, neighbourhood) did not work well as a scale in any of the countries. It is therefore recommended that these items should not be used as a scale for the overall sample or per country It is important to conduct analyses on in-group variations within countries to determine whether the items work well across groups. For example, in the South African context for Wave 3, it was found that certain scales that assess children’s SWB do not work well across language groups located in different provincial locations, and are therefore not comparable. A consideration of cross-country comparisons across groups in terms of developed and developing contexts are also useful in providing an indication of children’s SWB across various domains. Finally, it is recommended that the item on children’s overall safety be used with caution across and within country analyses.
Wave 2 Relation between bullying victimization and SWB
- Slides: 49