Childhood Obesity Slides Top 10 Countries Diabetes Prevalence

Childhood Obesity Slides

Top 10 Countries: Diabetes Prevalence International Diabetes Federation, Ages 20 to 79 years, 2013
 Origins of Adult Disease • Concept that fetal and early life")
Fetal (Early life) Origins of Adult Disease • Concept that fetal and early life events result in permanent metabolic alterations or developmental programming • First proposed by David Barker • Epidemiologic observations • Low birthweight associated with increase risk of diseases • Obesity • Metabolic syndrome • Diabetes • Hypertension • Cardiovascular disease

Prevalence of overweight and obesity in childhood - NHANES • Children 2 to 19 years of age • 32% are overweight or obese • 17% were obese • Children 2 to 5 years • 21% overweight or obese • Ogden et al, JAMA 2012

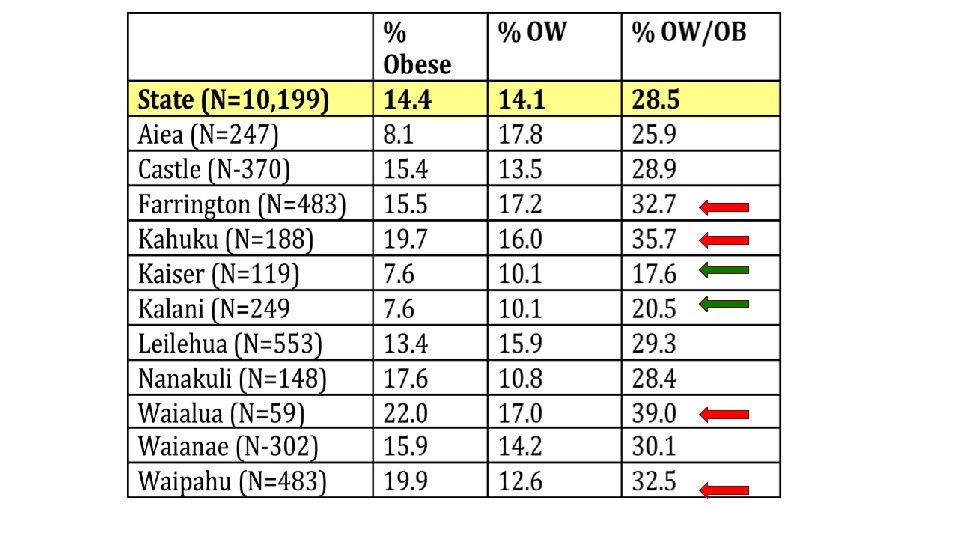
Current State of Hawaii’s Children Health • Unclear - no regular BMI surveillance screening • BMI collected at school entry but data is not analyzed systematically • Pobutsky et a. Hawaii Medical Journal, Oct 2006 • Form 14 data at school entry (2002 -2003) • N=10, 199 • 28. 5% of Hawaii’s children at school entry are overweight or obese

OW/OB Prevalence-Children attending WCCHC Year: 2011, N=2, 143 Percent Overweight and Obese 60 50 Percent 40 11. 6 20 10 0 17. 9 13. 3 12. 1 20. 1 30 10. 2 16. 6 11 20 18. 7 2 -5 yrs 6 -10 yrs OB 2: BMI ≥ 98% OB 1: BMI 95 -97% OW: BMI 85 -94% 23. 6 25. 5 11 -14 yrs 15 -18 yrs NHANES Children 2 -19 years: 16. 9% were obese with BMI ≥ 95% NHANES Children, 6 to 19 years: 18. 2% were obese

Children: 2 to 19 years Percent Overweight and Obesity by Age Group and Ethnicity Overweight and Obese: BMI for age ≥ 85%
- Slides: 8