CHEMISTRY 59 320 ANALYTICAL CHEMISTRY Fall 2010 Chapter


 with standard")


 by IO 3 - in 1. 00 M")


- Slides: 22
CHEMISTRY 59 -320 ANALYTICAL CHEMISTRY Fall - 2010 Chapter 16: Redox titration
16 -1 The shape of a redox titration curve • A redox titration is based on an oxidation-reduction reaction between analyte and titrant. • Consider the titration of iron(II) with standard cerium(IV), monitored potentiometrically with Pt and calomel electrodes. The potentials show above is in 1 M HCl. O 4 solution. Note that equilibria 16 -2 and 16 -3 are both established at the Pt electrode.
• There are three distinct regions in the titration of iron(II) with standard cerium(IV), monitored potentiometrically with Pt and calomel electrodes. 1. 2. 3. Before the equivalence point, where the potential at Pt is dominated by the analyte redox pair. At the equivalence point, where the potential at the indicator electrode is the average of their conditional potential. After the equivalence point, where the potential was determined by the titratant redox pair.
Before the equivalence point: using analyte’s concentration to calculate E+ At the equivalence point: needs both redox pairs to calculate (why? ) E of the cell
After the equivalence point: There are two special points during the above titration process: (1) when V = ½ Ve, [Fe 3+] = [Fe 2+] and E+ = E°(Fe 3+ | Fe 2+) ; (2) when V = 2 Ve, [Ce 4+] = [Ce 3+] and E+ = E°(Ce 4+ | Ce 3+) = 1. 70 V. • Summary The greater the difference in reduction potential between analyze and titrant, the sharper will be the end point. • The voltage at any point in this titration depends only on the ratio of reactants; it will be independent of dilution. • Prior to the equivalence point, the half-reaction involving analyze is used to find the voltage because the concentrations of both the oxidized and the reduced forms of analyte are known. • After the equivalence point, the half-reaction involving titrant is employed. At the equivalence point, both half-reactions are used simultaneously to find the voltage.
For the titration of Tl+ (Thallium) by IO 3 - in 1. 00 M HCl solution • The curve is not symmetric about the equivalence point. This is because the stoichiometry of reactants is 2: 1, not 1: 1. • Still, the curve is so steep near the equivalence point that negligible error is introduced if the center of the steep part is taken as the end point.
16 -2 Finding the end point • A redox indicator is a compound that changes color when it goes from its oxidized to its reduced state. or For ferroin, with E° = 1. 147 V we expect the color change to occur in the approximate range 1. 088 V to 1. 206 V with respect SHE
A redox titration is feasible if the difference between analyte and titrant is > 0. 2 V. If the difference in the formal potential is > 0. 4 V, then a redox indicator usually gives a satisfactory end point.
Starch-Iodine Complex • • • Starch is the indicator of choice for those procedures involving iodine because it forms an intense blue complex with iodine. Starch is not a redox indicator; it responds specifically to the presence of I 2, not to a change in redox potential. The active fraction of starch is amylose, a polymer of the sugar α-d-glucose. In the presence of starch, iodine forms I 6 chains inside the amylose helix and the color turns dark blue
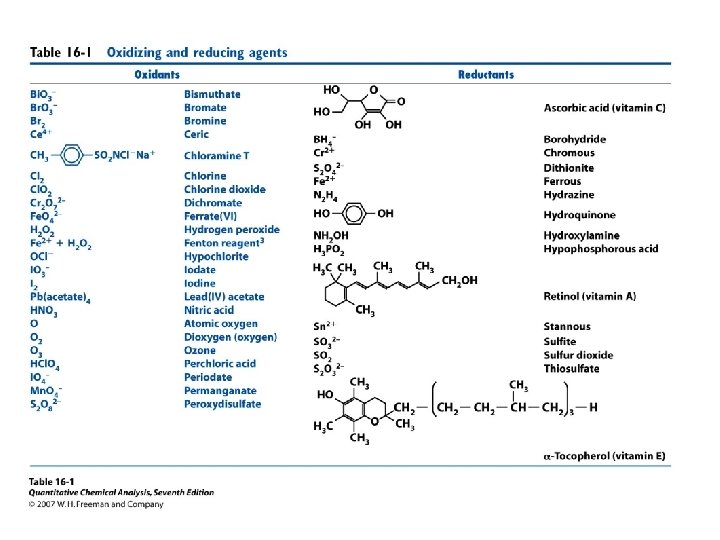
16 -3 Adjustment of analyte oxidation state • Sometimes one needs to adjust the oxidation state of analyte before it can be titrated. • Pre-adjustment must be quantitative and one must eliminate excess pre-adjustment reagent so that it won’t interference the subsequent titration. • Pre-oxidation: powerful oxidants that can be easily removed after preoxidation include peroxydisulfate, silver(II) oxide, sodium bismuthate. Definition: • • • Disproportionation: a reactant oxidizes and reduces itself, such as H 2 O 2 in boiling water. Pre-reduction: Process of reducing an analyte to a lower oxidation state prior to performing a titration with an oxidizing agent. Amalgam: a solution of anything in mercury.
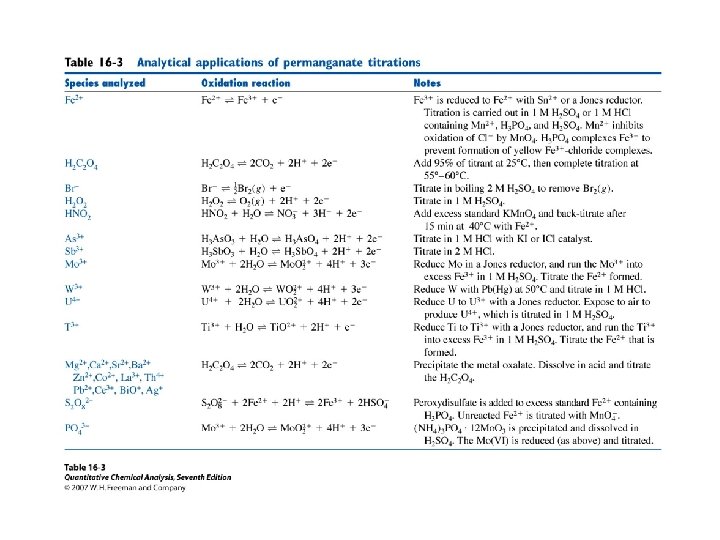
16 -4 Oxidation with potassium permanganate • KMn. O 4 is a strong oxidant with an intense violet color. In strongly acidic solutions (p. H < 1), it is reduced to Mn 2+. • In neutral or alkaline solution, it is reduced to brown solid Mn. O 2. • In strongly alkaline solution ( 2 M Na. OH), green manganate ion (Mn. O 42 -) is produced.
16 -5 Oxidation with Ce 4+ • Reduction of Ce 4+ to Ce 3+ proceeds cleanly in acidic solutions. • The aquo ion, Ce(H 20)n 4+, probably does not exist in any of these solutions, because Ce(IV) binds anions (Cl. O 4 -, SO 42 - NO 3 -, Cl-) very strongly.
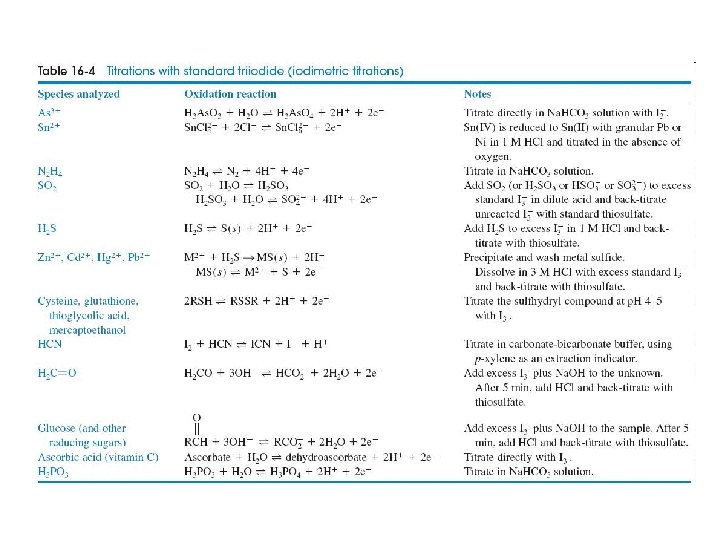
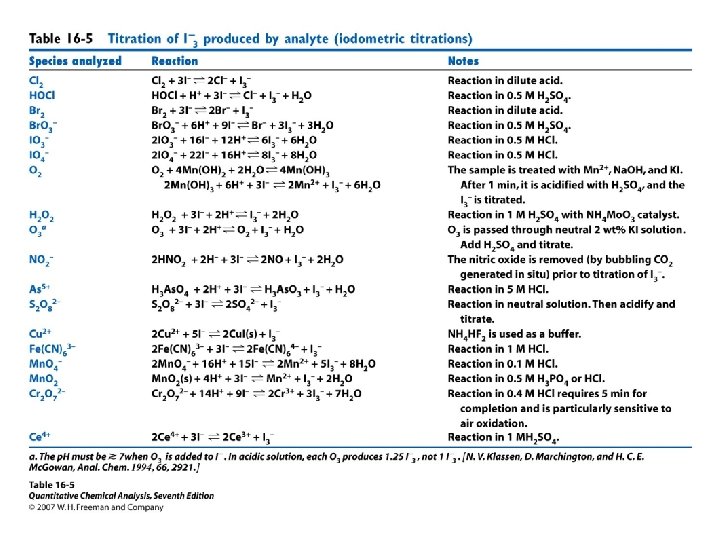
16 -7 Methods Involving Iodine • Iodimetry: a reducing analyte is titrated directly with iodine (to produce I−). • iodometry, an oxidizing analyte is added to excess I− to produce iodine, which is then titrated with standard thiosulfate solution. • Iodine only dissolves slightly in water. Its solubility is enhanced by interacting with I- • A typical 0. 05 M solution of I 2 for titrations is prepared by dissolving 0. 12 mol of KI plus 0. 05 mol of I 2 in 1 L of water. When we speak of using iodine as a titrant, we almost always mean that we are using a solution of I 2 plus excess I−.
Preparation and Standardization of Solutions • Acidic solutions of I 3 - are unstable because the excess I− is slowly oxidized by air: • In neutral solutions, oxidation is insignificant in the absence of heat, light, and metal ions. At p. H ≳ 11, triiodide disproportionates to hypoiodous acid (HOI), iodate, and iodide. • An excellent way to prepare standard I 3 - is to add a weighed quantity of potassium iodate to a small excess of KI. Then add excess strong acid (giving p. H ≈ 1) to produce I 2 by quantitative reverse disproportionation:
Problems • Would indigo tetrasulfonate be a suitable redox indicator for the titration of Fe(CN)64 - with Tl 3+ in 1 M HCl? • Solution: Standard potentials: indigo tetrasulfonate is 0. 36 V; Fe(CN)63 -/ Fe(CN)64 - is 0. 356 V; Tl 3+/Tl+, 0. 77 V. The end-point potential will be between 0. 356 and 0. 77 V. Indigo tetrasulfonate changes color near 0. 36 V. Therefore it will not be a useful indicator for this titration.
• Given the following data select the best indicator for the titration of iron(II) with thallium(III), using a S. C. E. reference electrode. (a) methylene blue (b) diphenylamine sulfonic acid (c) diphenylamine • Which of the following titrations would give a titration curve symmetric around the equivalence point? (a) Na 2 S 2 O 3 titrated with I 2. (b) ascorbic acid titrated with I 2. (c)As 4 O 6 titrated with I 2.