Chemistry 141 Lab Safety Rules Do not engage

Chemistry 141 Lab

Safety Rules • • • Do not engage in horseplay in the lab at any time. It will not be tolerated for any reason. Do not perform any lab work without your instructor present. This includes working on experiments, using lab glassware, and/or using reagents and lab chemicals. You may work on lab reports, graphing, or study in the lab without the instructor’s presence. In order to make up an experiment you must first obtain the approval of your instructor. You must then obtain the permission of the instructor in whose lab you wish to work. Finally, you must inform the stockroom technicians.

Safety Rules • • You must wear approved eye protection at all times when anyone is doing lab work. You must wear closed toe shoes (not sandals) to protect your feet against broken glass and spilled reagents. We recommend that you wear a lab apron or old clothing. In case of injury, fire, or other mishap, inform the instructor at once. If the instructor is not in the immediate area inform the chemistry technician in the stockroom.

Safety Rules • • • Do not put anything in your mouth while in the lab. You are not allowed to eat, drink or smoke in the lab. Use a fume hood in order to avoid prolonged contact with noxious vapors or poisonous gases. Immediately use water to rinse off corrosive chemicals from your skin or eyes. Notify an instructor. Wash your hands before leaving the lab for the day. Some chemicals can be readily absorbed through the skin.

Safety Rules • • Use a lubricant such as glycerine to insert glass tubing or a thermometer into a rubber stopper. Hold the piece of glass which is being inserted or removed close to the end with a paper towel. Clean up spills and breakage immediately. Neutralize acids or base spills with sodium bicarbonate before washing down the area with water.

Safety Rules • • Familiarize yourself with the safety equipment in the lab, including the first aid kit, fire blanket, fire extinguisher, the safety shower, and the eye wash station. When heating the contents of a test tube, point the open end of the tube away from everyone. A vapor pocket may form beneath the surface of the contents and cause their ejection (bumping).

Safety Rules • • Dispose of insoluble waste in the waste basket, not in the sink. Broken glass is to be disposed in the broken glass receptacle. Be sure to read the labels on all chemical reagent containers before using their contents. Using an improper reagent for an experiment can lead to a serious accident.

Safety Rules • • Do not take chemical reagent containers to your work bench. Leave them at their initial location. Do not use any of your lab equipment to dispense chemicals for an experiment. The instructor will demonstrate the proper method for dispensing chemicals. Chemicals are expensive items therefore, transfer out only what you will need for the experiment. Do not ever return used or excess chemicals to their original containers to prevent contamination.

Safety Rules • At the conclusion of your lab period thoroughly clean up your work area. Make sure that the gas to the bunsen burner is shut off. Do not remove any chemicals or lab equipment from the laboratory.

Lab Books • Get a lab book with prenumbered carbonless copy pages. Write your name on the front of the lab book. • All data in the lab book must be written in ink. • Do not tear any original pages out of the book!!

Lab Books • Begin each lab with a • August 20, 2007 title • Luna Lovegood • Enter the date you are beginning the experiment, your • Experiment 1 – name, and list any lab Standard Deviation partners you may be Lab working with. • Worked with – Everyone will do the Hermione Granger entire lab on their own, but you may want to work with someone else to compare your results

Lab Books • Reference the procedure and note any safety precautions. Or if you used the Online Lab Manual: Lehman, J. , Olmstead, T. et al (2002). Experiment 2: Measuring Density using different types of Glassware [Electronic version]. Grossmont College Chemistry 141 Laboratory Manual, 5 -10. • Procedure: Followed procedure outlined in the lab manual. • Lehman, J. & Olmstead, T. et al (2002). Experiment 2: Measuring Density using different types of Glassware. In Grossmont College Chemistry 141 Laboratory Manual (4 th Edition, pp. 5 -10). El Cajon, California. • Safety: Wear Safety glasses

Lab Books • Data and Observations • This should be a log of what you saw along with any tables of data that may be necessary Trial Mass beaker + water Mass beaker Mass Water after pouring delivered by water out beaker 1 2 3 I filled the beaker to the 50 m. L line with an eyedropper. It was very difficult to determine when the water level reached the line on the beaker.

Lab Books • Be sure to write all data in your lab book in black or blue ink when you take the data. The only exception will be for data collected by the computer. Any data recorded on stray pieces of paper will be confiscated! • No writeovers – 375. 788 g 636 • No obliterations – 639. 824 g • No Erasing • Cross out once and rewrite. – 4. 932 g – 5. 382 g

Lab Books • At the end of the lab period, sign and date your lab book after your last data entry and get an instructor stamp. • Copper sulfide precipitate was filtered and left in lab drawer to dry. The precipitate was a very fine black powder. – Luna Lovegood – 9/28/07 – Severus Snape – Potions Instructor

Lab Reports • Typewritten reports documenting your experimental results. Some reports will be abbreviated as noted in write-up instructions. • Be sure to clearly label each section! • • • Title Page Objective Introduction Procedure Results and Calculations • Discussion • Conclusion • Questions

Title Page • This will identify you, your class, • and the experiment. Very important so I can keep track of what you are handing in! Standard Deviation Experiment • Luna Lovegood Lab Notebook Procedure /5 Signatures /5 Data /15 Formal Report /75 Title Page /5 Objecti ve /10 Introdu ction /15 Proced ure /5 Result s and Calcul ations /15 Discus sion /15 Conclu sion /10 • Chemistry 141 • S. Snape • Section 5399 • September 3, 2007 Total • Be sure to include the grading rubric. /25 /100

Objective • Why are you doing this experiment? • Objective: • To determine the accuracy and precision of laboratory glassware and to learn how a standard deviation is calculated. To determine the density of some unknown liquids.

Introduction • This section tells a little bit • Introduction: about theory of the • When doing scientific experiment and how it will experiments it is always be done. necessary to minimize the error where possible. Unfortunately, however, it is impossible to completely avoid error. In experiments there are several types of error. They are random error, systematic error, and gross error. Random error is---

Procedure • Reference the procedure used and note any deviations from the published procedure. Or if you used the Online Lab Manual: Lehman, J. , Olmstead, T. et al (2002). Experiment 2: Measuring Density using different types of Glassware [Electronic version]. Grossmont College Chemistry 141 Laboratory Manual, 5 -10. • Procedure • Followed procedure from lab book • Lehman, J. & Olmstead, T. et al (2002). Experiment 2: Measuring Density using different types of Glassware. In Grossmont College Chemistry 141 Laboratory Manual (4 th Edition, pp. 5 -10). El Cajon, California. • In this experiment the liquids used for the density determinations were an water, coke, and diet coke.

Results and Calculations • Tabulate data and any calculated values. Show sample calculations. (These may be hand written. ) • For non numerical labs, summarize the data generated. Results and Calculations Trial Mass beaker + liquid (g) Mass beaker after dispensi ng liquid(g) Mass liquid( g) Averag e mass liquid deviation Standard deviation 1 xx. x xx. . xx 2 xx. x . xx 3 xx. x xx. x. x . xx Sample Calculation for mass liquid xxx. xxg-xx. xxg=xx. xxg

Discussion • This is where you get to explain your results • Discussion: • The average mass of water held by the beaker was 43. 2 g. This was less than expected based on the marking on the beaker. The mass of water held was probably low because I filled my beaker to the bottom of the line and it may have been designed to fill to the top of the line. I also noticed that---

Conclusion • This is where you give the final result. This is • The beaker held 53. 4 grams of water with a essentially the punch standard deviation of line-0. 7 g. The graduated cylinder held 10. 2 grams of water with a standard deviation of 0. 1 g. The densities of regular Coke and diet Coke were …

Questions • Answer any questions posed in the lab here.

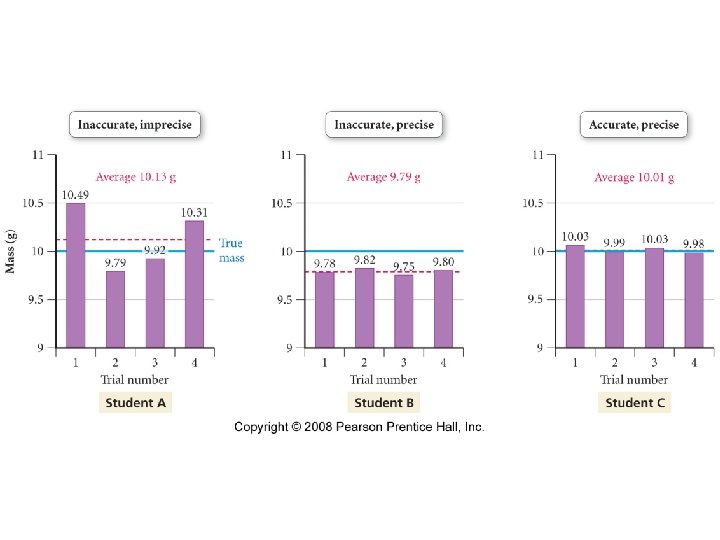
Precision and Accuracy • Accuracy -- Refers to how close to the true value a given measurement is. • Precision -- Refers to how well a number of independent measurements agree with one another.

Error Analysis • Types of error – Random – Systematic – Gross

Error Analysis • Types of error – Random • Not mistakes but inherent in measuring process. • May be positive or negative. • Cause the data to be spread symmetrically around the true value • May be minimized by doing repeated trials of an experiment – Systematic – Gross

Error Analysis • Types of error – Random – Systematic • Caused by consistently making the same mistake for all measurements. • Tend to give precise though incorrect results. • May be minimized by using different techniques to gather data. – Gross

Error Analysis • Types of error – Random – Systematic – Gross • Results in a value which is far different than either the true value or the mean • Caused by sample inconsistencies or experimental error (ie reading measuring instrument wrong on one trial)

Definitions • Mean value – “the average” • Median value – Middle value • Spread or range – difference between highest and lowest measurement • Deviation – difference between mean and any specific measurement

Average Deviation Trial Mass 1 9. 6 2 9. 8 3 10. 3 4 10. 0 5 10. 8 6 9. 5 Mean 10. 0

Average Deviation Trial Mass Deviation 1 9. 6 -0. 4 2 9. 8 -0. 2 3 10. 3 +0. 3 4 10. 0 5 10. 8 +0. 8 6 9. 5 -0. 5 Mean 10. 0

Average Deviation Trial Mass Deviation /dev/ 1 9. 6 -0. 4 2 9. 8 -0. 2 3 10. 3 +0. 3 4 10. 0 5 10. 8 +0. 8 6 9. 5 -0. 5 Mean 10. 0 0. 4

Standard Deviation • σ represents the standard deviation • d represents the individual deviation • n is the number of trials.
2 1 9. 6 -0. 4 . 16")
Standard Deviation Trial Mass Deviation /dev/ (dev)2 1 9. 6 -0. 4 . 16 2 9. 8 -0. 2 . 04 3 10. 3 +0. 3 . 09 4 10. 0 . 00 5 10. 8 +0. 8 . 64 6 9. 5 -0. 5 . 25 Mean 10. 0 0. 4 Sum=1. 57

Standard Deviation

Standard Deviation σ = 0. 6 g So 68% of measurements lie between 9. 4 and 10. 6 grams 95% of measurements lie between 8. 8 and 11. 2 grams >99% of measurements lie between 8. 2 and 11. 8 grams

Significant Figures • Significant digits -- refers to the total number of digits in a measurement where one of the digits is uncertain and the others are certain. • According to standard deviation calculations, the last digit is uncertain—sig figs work pretty well in the absence of statistical work-up!

Rules for determining number of significant figures • All non-zero digits are significant. • All zeros between nonzero digits (or significant zeros) are significant. • Zeros used as placeholders are not significant. – all zeros to left of 1 st non-zero digit are not significant. (For example 0. 0068 -- two sig figs the zeros are placeholders. ) – for numbers greater than 1, zeros to the right of last digit are ambiguous if no zeros after decimal point. Assume not significant for this class. • Zeros after last digit are significant for numbers <1 or if they occur after decimal point for number >1. • Exact numbers have an infinite number of significant figures.

Calculations with Significant Figures • In addition and subtraction, the last digit retained in the sum or difference is determined by the position of the first doubtful digit. • For example 37. 24 1002. 46 • + 10. 3 + 6. 3 • -------------- • 47. 54 1008. 76 • Rounds to 47. 5 1008. 8

Calculations with Significant Figures • In multiplication and division, an answer has no more sig figs than the measurement with the least number of sig figs. • For example 3. 427 x 0. 00692 = 0. 02371484 = 0. 0237

Experiment • You will measure the mass of water delivered by a beaker and by a graduated cylinder multiple times and determine the mass of water delivered with each instrument and the standard deviation. You will then determine the density of regular and diet Coke using the most appropriate tools. • Results will be entered on the spreadsheet at www. grossmont. edu/cwillard.

Sample Data Table Temperature of water________ Density of water at measured temperature_____ Balance used ___________ Trial number 1 2 3 Sum Mean Mass beaker + 50 ml water (g) Mass drained beaker (g) Mass water (g) Volume water (m. L) (calculated from density) Deviation 2
- Slides: 44