CHEMICAL PROCESS DIAGRAM Chemical Process Diagram SCOPE Students


 -Process Flow Diagram")
 BLOCK FLOW DIAGRAM (BFD)")
 BFD shows overall processing picture of a chemical complex:")
 Example 1: Mixed Gas 2610 kg/hr Toluene, C 7")

 Exercise 1: Ammonia-air mixture is feed to the bottom")
 Answer 1 Hot water out Insoluble ammonia Ammonia liquid")
 Exercise 2: Ethanol-water mixture is feed to a batch")
 Answer 2 Hot water out Condenser Ethanol liq. Ethyl")
 PROCESS FLOW DIAGRAM")
 SCOPE: Students will be able to know: q Process")
 PFD shows all process engineering information: -The topology of")
 PFD will contains the following information: - All major")
")
 PFD will contains the following information: - All major")
 Process Unit Symbology Symbol Description Heat exchanger H 2")
 Process Unit Symbology Symbol Description Heater coil Centrifugal pump")
 Process Unit Symbology Symbol Name Description Stripper A separator")
 Process Unit Symbology Symbol Name Description Distillation A separator")
 Process Unit Symbology Symbol Name Description Reaction chamber A")
 Process Unit Symbology Symbol Name Description Boiler A unit")
 Valve Symbology Symbol Name Gate Valve Globe Valve Ball")
 Valve Symbology Symbol Name Relief Valve Needle Valve 3")

 Exercise 3: Ammonia-air mixture is feed to the bottom")
 Answer 3 T-100 T-101 E-100 Absorber Column Batch Distillation")
 Process Unit Tagging and Numbering Process Equipment General Format")
 Y Letter Area No. 1 Area No. 2 Area")
 A/B Letter Example Ethylene Hot water out Ethylene liq.")
 PFD will contains the following information: - All process")
 Stream Numbering and Drawing - Number streams from left")

 (cont. . ) Stream Information -Since diagrams are small")
 (cont. . ) Stream Information - Flag 600 Temperature")


 PFD will contains the following information: - Basic control")


- Slides: 43
CHEMICAL PROCESS DIAGRAM
Chemical Process Diagram SCOPE: Students will be able to know: q Type of chemical process diagram - Block Flow Diagram (BFD) - Process Flow Diagram (PFD) - Piping and Instrumentation Diagram (P&ID) q How to read and draw BFD, PFD and P&ID q Process equipments symbol and numbering
Chemical Process Diagram 3 Levels of Diagram -Block Flow Diagram (BFD) -Process Flow Diagram (PFD) -Piping and Instrumentation Diagram (P&ID)
The Block Flow Diagram (BFD) BLOCK FLOW DIAGRAM (BFD)
The Block Flow Diagram (BFD) BFD shows overall processing picture of a chemical complex: -Flow of raw materials and products may be included on a BFD -BFD is a superficial view of facility – Ch. E information is missing
The Block Flow Diagram (BFD) Example 1: Mixed Gas 2610 kg/hr Toluene, C 7 H 8 10, 000 kg/hr Reactor Hydrogen H 2 820 kg/hr C 6 H 6 Gas Separator CH 4 C 7 H 8 Benzene, C 6 H 6 8, 210 kg/hr Mixed Liquid 75% Conversion of Toluene Reaction : C 7 H 8 + H 2 C 6 H 6 + CH 4 Figure 1. 1: Block Flow Diagram for the Production of Benzene
Example 2 Production of Ethane from Ethanol is feed to continuous reactor with presence of Acid Sulphuric catalyzer to produce ethylene. Distillation process then will be applied to separate ethylene-H 2 O mixture. Ethylene as a top product is then condensate with condenser to perform liquid ethylene. Hydrogenation of ethylene applies in another reactor with presence of Nickel catalyzer to produce ethane as a final product. Develop BFD for these processes. CH 3 CH 2 OH H 2 SO 4 CH 2=CH 2 + H 2 Ni CH 2=CH 2 + H 2 O CH 3 Hot water out Ethylene liq. CH 2 (l) Ethylene, CH 2 (g) Ethanol, C 2 H 5 OH H 2 SO 4 Cold water in Reactor 1 Ethane, CH 3 CH 2 H 2 O Distillation column H 2 O Hydrogen, H 2 Ni Reactor 2
The Block Flow Diagram (BFD) Exercise 1: Ammonia-air mixture is feed to the bottom stream of an absorber with flow rate of 10 L/min. Water then feed to the upper stream of the same absorber with desired flow rate of 5 L/min. There are two outputs from the absorber where upper stream is insoluble NH 3 and bottom stream is NH 3 -Water mixture. This NH 3 -water mixture then feed up to a batch distillation column. The column produces ammonia gas as a top product which this product then will be condensate with a condenser to produce liquid ammonia. Develop Block Flow Diagram (BFD) for this process.
The Block Flow Diagram (BFD) Answer 1 Hot water out Insoluble ammonia Ammonia liquid Water 5 L/min Absorber Ammonia gas Condenser Batch Distillation Cold water in Ammonia-air mixture 10 L/min Ammonia-water mixture
The Block Flow Diagram (BFD) Exercise 2: Ethanol-water mixture is feed to a batch distillation column. This distillation process will produce ethanol vapour at the top product which then condensate to produce liquid ethanol which then collected into a distillate product tank. This liquid ethanol and an acetic acid liquid from a acid feed tank are then feed to a reactor. An exothermic chemical reaction will producing ethyl acetate (a type of ester). Draw BFD for this chemical process.
The Block Flow Diagram (BFD) Answer 2 Hot water out Condenser Ethanol liq. Ethyl acetate Reactor Batch distillation Cold water in Distillate product tank Ethanol-water mixture Acid feed tank
The Process Flow Diagram (PFD) PROCESS FLOW DIAGRAM
The Process Flow Diagram (PFD) SCOPE: Students will be able to know: q Process Unit symbology q How to read and draw PFD q Process equipments symbol and numbering
The Process Flow Diagram (PFD) PFD shows all process engineering information: -The topology of the process – showing the connectivity of all the streams and the equipment. -Use appropriate conventions – consistency is important in communication of process information.
The Process Flow Diagram (PFD) PFD will contains the following information: - All major pieces of equipment (descriptive name, unique equipment no. ), pumps and valves. - All the utility streams supplied to major equipments such as steam lines, compressed air lines, electricity, etc. - All process flow streams: identification by a number, process condition, chemical composition. - Basic control loops: showing the control strategy used to operate the process under normal operations.
The Process Flow Diagram (PFD)
The Process Flow Diagram (PFD) PFD will contains the following information: - All major pieces of equipment (descriptive name, unique equipment no. ), pumps and valves. - All the utility streams supplied to major equipments such as steam lines, compressed air lines, electricity, etc.
The Process Flow Diagram (PFD) Process Unit Symbology Symbol Description Heat exchanger H 2 O Water cooler S Steam heater Cooling coil
The Process Flow Diagram (PFD) Process Unit Symbology Symbol Description Heater coil Centrifugal pump Turbine type compressor Pressure gauge
The Process Flow Diagram (PFD) Process Unit Symbology Symbol Name Description Stripper A separator unit used commonly to liquid mixture into gas phase Absorber A separator unit used commonly to extract mixture gas into liquid phase
The Process Flow Diagram (PFD) Process Unit Symbology Symbol Name Description Distillation A separator unit used commonly to crack liquid contains miscellaneous component fractions. column or Liquid mixer A process unit that used to mix several components of liquid.
The Process Flow Diagram (PFD) Process Unit Symbology Symbol Name Description Reaction chamber A process unit where chemical process reaction occurs Horizontal tank A unit to store liquid or gas. or cylinder
The Process Flow Diagram (PFD) Process Unit Symbology Symbol Name Description Boiler A unit for heating. Centrifuge A separator unit that to physically separated liquid mixture. (exp: oil-liquid)
The Process Flow Diagram (PFD) Valve Symbology Symbol Name Gate Valve Globe Valve Ball Valve Check Valve Butterfly Valve
The Process Flow Diagram (PFD) Valve Symbology Symbol Name Relief Valve Needle Valve 3 -Way Valve Angle Valve Butterfly Valve
Example 3 Production of Ethane from Ethanol is feed to continuous reactor with presence of Acid Sulphuric catalyzer to produce ethylene. Distillation process then will be applied to separate ethylene-H 2 O mixture. Ethylene as a top product is then condensate with condenser to perform liquid ethylene. Hydrogenation of ethylene applies in another reactor with presence of Nickel catalyzer to produce ethane as a final product. Develop PFD for these processes. H 2 SO 4 CH 3 CH 2 OH CH 2=CH 2 + H 2 O CH 3 Ni R-100 P-100 T-100 E-100 P-101 Reactor Pump Distillation Column Condenser Pump Reactor Hot water out Ethylene liq. E-100 V-104 CV-100 Ethanol H 2 SO 4 V-100 V-101 V-103 R-100 T-100 Cold water in CV-101 V-105 V-102 V-106 Hydrogen V-107 Ni R-101 P-100 H 2 O P-101 Ethane
The Process Flow Diagram (PFD) Exercise 3: Ammonia-air mixture is feed to the bottom stream of an absorber with flow rate of 10 L/min. Water then feed to the upper stream of the same absorber with desired flow rate of 5 L/min. There are two outputs from the absorber where upper stream is insoluble NH 3 and bottom stream is NH 3 -Water mixture. This NH 3 -water mixture then feed up to a batch distillation column. The column produces ammonia gas as a top product which this product then will be condensate with a condenser to produce liquid ammonia. Develop Process Flow Diagram (PFD) for this process.
The Process Flow Diagram (PFD) Answer 3 T-100 T-101 E-100 Absorber Column Batch Distillation Column Condenser Insoluble ammonia gas Hot water out Ammonia gas Water 5 L/min Cold water in Ammonia-air mixture 10 L/min Ammonia-water mixture Ammonia liquid
The Process Flow Diagram (PFD) Process Unit Tagging and Numbering Process Equipment General Format XX-YZZ A/B XX are the identification letters for the equipment classification C - Compressor or Turbine E - Heat Exchanger H - Fired Heater P - Pump R - Reactor T - Tower TK - Storage Tank V - Vessel Y - designates an area within the plant ZZ - are the number designation for each item in an equipment class A/B - identifies parallel units or backup units not shown on a PFD Supplemental Information Additional description of equipment given on top of PFD
The Process Flow Diagram (PFD) Y Letter Area No. 1 Area No. 2 Area No. 3
The Process Flow Diagram (PFD) A/B Letter Example Ethylene Hot water out Ethylene liq. Ethylene Cold water in Hot water out Ethylene liq. Cold water in Ethanol H 2 SO 4 Hydrogen Ethane Hydrogen Ni H 2 O Ethane Ni H 2 O P-100 A/B P-100 B In PFD In real plant, it means like above
The Process Flow Diagram (PFD) PFD will contains the following information: - All process flow streams: identification by a number, process condition, chemical composition.
The Process Flow Diagram (PFD) Stream Numbering and Drawing - Number streams from left to right as much as possible. - Horizontal lines are dominant. Yes No No
Example 4 R-100 P-100 T-100 E-100 P-101 Reactor Pump Distillation Column Condenser Pump Reactor Hot water out Ethylene liq. E-100 6 V-104 Cold water in V-106 CV-101 T-100 CV-100 V-105 Ethanol 1 H 2 SO 4 V-101 V-100 5 V-102 4 V-103 R-100 V-107 3 2 R-101 8 7 P-100 Hydrogen 9 Ni Ethane 10 H 2 O P-101
The Process Flow Diagram (PFD) (cont. . ) Stream Information -Since diagrams are small not much stream information can be included. -Include important data – around reactors and towers, etc. q. Flags are used q. Full stream data,
The Process Flow Diagram (PFD) (cont. . ) Stream Information - Flag 600 Temperature 300 3 8 24 Pressure 10. 3 Mass Flowrate 108 Molar Flowrate 9 6 7 1 10 600 24 2 5 12 11 4 24 13 Gas Flowrate Liquid Flowrate
Example 5 R-100 P-100 T-100 E-100 P-101 Reactor Pump Distillation Column Condenser Pump Reactor Hot water out Ethylene liq. E-100 6 V-104 Cold water in 25 28 V-106 CV-101 T-100 CV-100 V-105 Ethanol 1 H 2 SO 4 V-101 V-100 5 20 38 V-102 4 V-103 R-100 V-107 3 2 35 31. 0 35 32. 2 P-100 Hydrogen 9 Ni R-101 8 7 Ethane 10 H 2 O P-101
Stream Information - Full stream data, Stream Number 1 2 3 4 5 6 7 8 9 10 Temperature (o. C) 25. 0 35. 0 60. 3 41 38 54. 0 45. 1 Pressure (psi) 28 32. 2 31. 0 30. 2 45. 1 31. 3 24. 0 39. 0 2. 6 Mass flow (tonne/hr) 10. 3 13. 3 0. 82 20. 5 6. 41 20. 5 0. 36 9. 2 20. 9 11. 6 Mole flow (kmol/hr) 108 114. 2 301. 0 1204. 0 758. 8 1204. 4 42. 6 1100. 8 142. 2 244. 0 Vapor fraction
Example 6 R-100 P-100 T-100 E-100 P-101 Reactor Pump Distillation Column Condenser Pump Reactor Hot water out Ethylene liq. E-100 6 V-104 Cold water in 25 28 V-106 T-100 CV-101 V-105 5 Ethanol 1 H 2 SO 4 V-100 V-101 4 3 35 32. 2 38 V-103 R-100 2 20 V-102 Hydrogen 9 Ni V-107 R-101 8 35 31. 0 7 H 2 O Ethane 10 P-101 P-100 Stream Number 1 2 3 4 5 6 7 8 9 10 Temperature (o. C) 25. 0 35. 0 60. 3 41 38 54 45. 1 28 32. 2 31. 0 30. 2 45. 1 31. 3 24. 0 39 2. 6 Mass flow (tonne/hr) 10. 3 13. 3 0. 82 20. 5 6. 41 20. 5 0. 36 9. 2 20. 9 11. 6 Mole flow (kmol/hr) 108 114. 2 301. 0 1204. 0 758. 8 1204. 4 42. 6 1100. 8 142. 2 244. 0 Pressure (psi) Vapor fraction
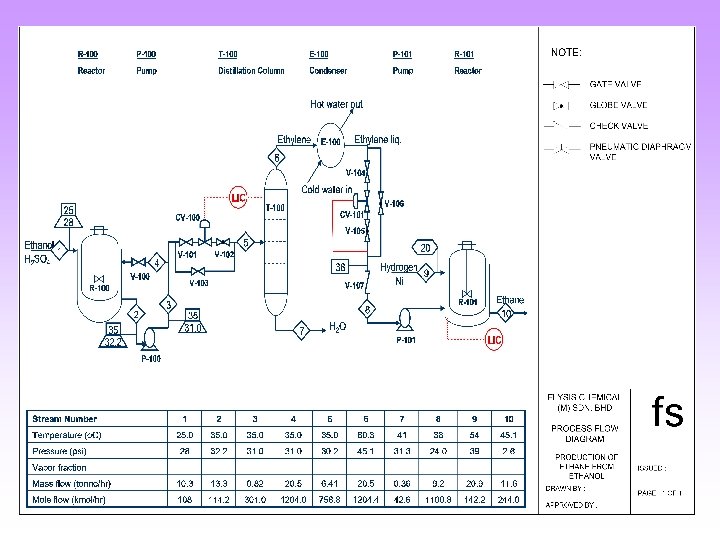
The Process Flow Diagram (PFD) PFD will contains the following information: - Basic control loops: showing the control strategy used to operate the process under normal operations.
Example 7 R-100 P-100 T-100 E-100 P-101 Reactor Pump Distillation Column Condenser Pump Reactor Hot water out Ethylene liq. E-100 6 V-104 Cold water in LIC 25 28 V-106 T-100 CV-101 V-105 5 Ethanol 1 H 2 SO 4 V-101 4 V-103 R-100 3 35 32. 2 Hydrogen 9 Ni 38 V-100 2 20 V-102 V-107 35 31. 0 7 Ethane 10 R-101 8 H 2 O LIC P-101 P-100 Stream Number 1 2 3 4 5 6 7 8 9 10 Temperature (o. C) 25. 0 35. 0 60. 3 41 38 54 45. 1 28 32. 2 31. 0 30. 2 45. 1 31. 3 24. 0 39 2. 6 Mass flow (tonne/hr) 10. 3 13. 3 0. 82 20. 5 6. 41 20. 5 0. 36 9. 2 20. 9 11. 6 Mole flow (kmol/hr) 108 114. 2 301. 0 1204. 0 758. 8 1204. 4 42. 6 1100. 8 142. 2 244. 0 Pressure (psi) Vapor fraction
QUESTIONS?