CHAS DATA Todd Richardson U S Department of


 n Affordability u Cost Burden - greater than 30% of income")


 and Block Group (part) files n")


 708 -3700 x 5706 u")
- Slides: 36
CHAS DATA Todd Richardson U. S. Department of Housing and Urban Development Office of Policy Development & Research
Presentation Summary Accessing the data n Downloading the data n Understanding the data n Using the data n
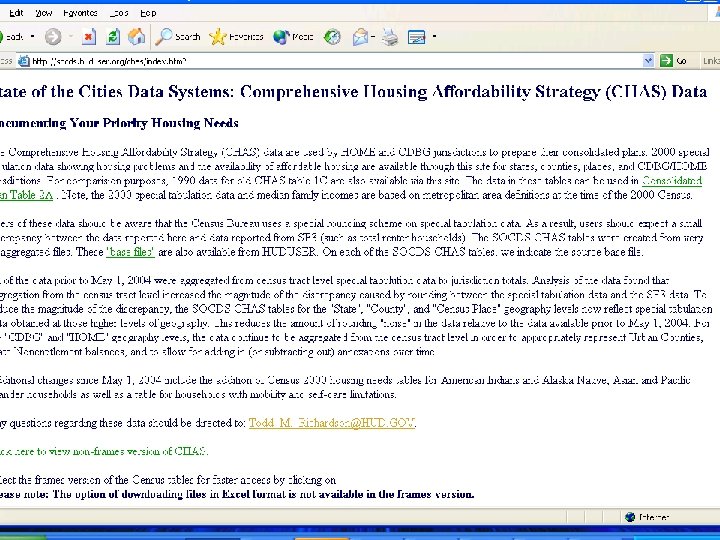
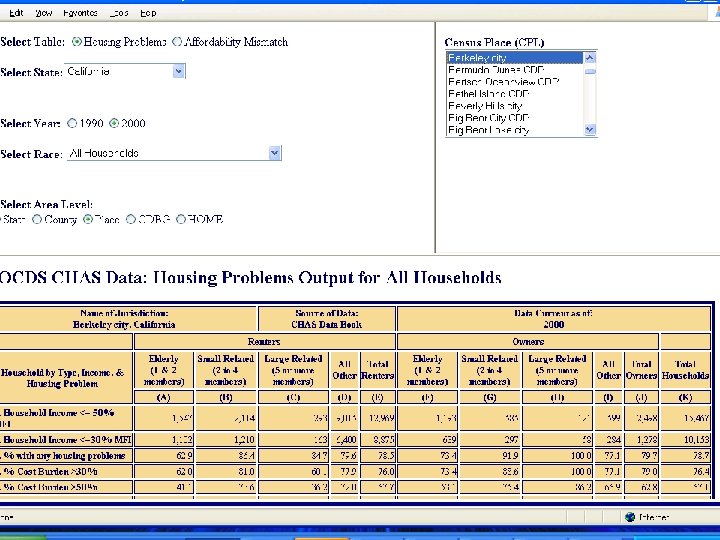
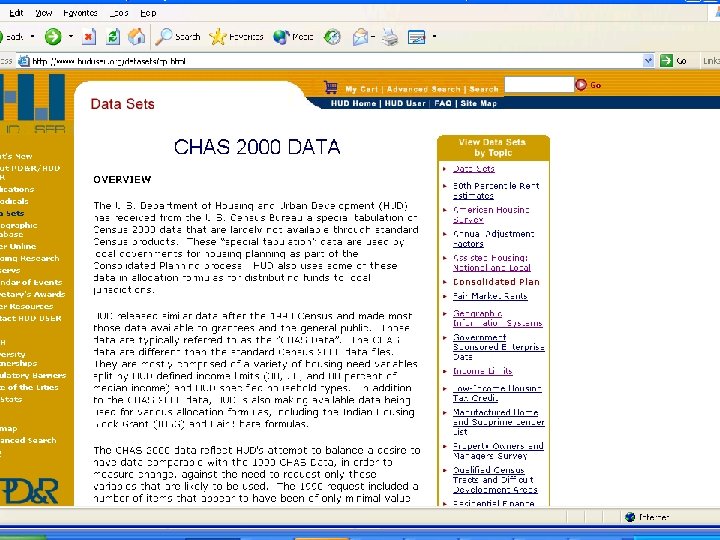
Accessing the data n State of the Cities Data System u http: //socds. huduser. org/scripts/odbic. ex e/chas/index. htm? n HUDUSER - data sets - consolidated plan u http: //www. huduser. org/datasets/cp. html
State of the Cities n Housing Problems Table u 1990 Data t All Households, White-nh, Black-nh, Hispanic u 2000 Data t All Households, White-nh, Black-nh, Hispanic, Asian-nh, Native American-nh, Pacific Islander-nh, Mobility and Self-Care Limitation
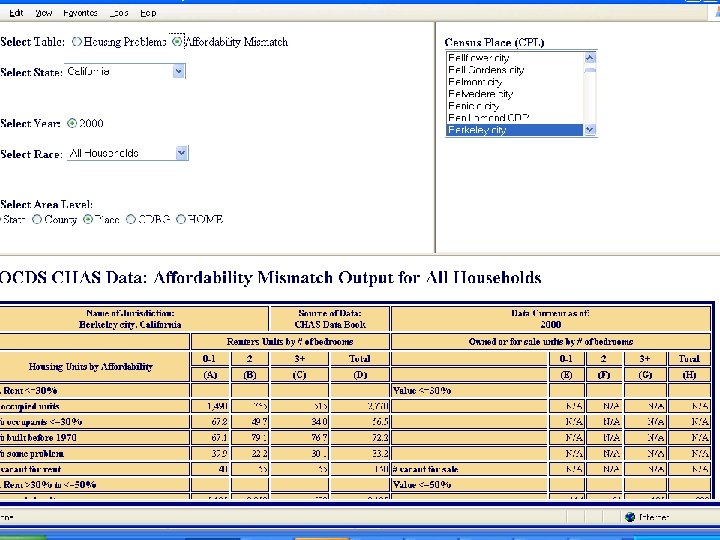
State of the Cities n Affordability Mismatch u 2000 Data t Occupancy, age, and vacancy rate of units affordable to persons in different income categories
Other helpful data at SOCDS n n n n http: //socds. huduser. org/index. html Data from the 1970, 1980, 1990, and 2000 Census Current Employment Statistics for City Residents Special City Extracts from County Business Patterns FBI Crime Data Building Permits Database Urban Public Finance Data
HUDUSER - Data Sets - Consolidated Plan n Detailed Tables u 59 tables Multiple Geographic Levels u State, County, Place, Consolidated City, Tract (part), a few tables at Block Group level Different Ways to Download u By State (DBF files only) u Nationally (SAS, SPSS, DBF Files)
Detailed Tables n n Example Table to Download: u A 1 A 040. DBF - Table, Geographic Summary Level, Data Format A Tables u General CHAS data tables at six geographies mentioned B Tables u Less disaggregated CHAS data at Block Group level F Tables u Tables created for running various formulas
Detailed Table Tips n n n Also download the data dictionary, files are highly disaggregated Use the highest level geography that makes sense u Rounding issue with special tabulation data Mapping with Tract and Block Group Data u The tract (part) and block group (part) data split at place boundaries requiring non-standard GIS shape files which HUD has created and can also be downloaded.
Downloading the Data n n SOCDS data tables downloadable in Excel File u VERY IMPORTANT - USE NON-FRAMES VERSION OF SOCDS IN ORDER TO DOWNLOAD HUDUSER data files are in zipped files. u The State Downloads, which most people will likely use, have data for every table and every geography all zipped into a single file. This allows the user to be selective about what they want to extract.
Understanding the Data These data are largely built around HUD’s Low/Mod area definitions 30%, 50%, and 80% of HUD Area Median Family Income (HAMFI) n HAMFI is calculated based on the median income for a metropolitan area, assuming that is income for 4 -person HH. n HAMFI is adjusted for family size n
HAMFI vs. Poverty n n n On average, households at less than 30% of HAMFI equate to households at the poverty level. However, in high cost/high income markets, the % of households less than 30% is much higher than poverty rate. Similarly in low cost/low income markets, the % of households less than 30% is much lower than poverty rate. We use HAMFI as a proxy to account for different costs of living.
Example of 1999 HAMFI
Do not confuse CHAS data with CDBG Low/Mod Area Data n CDBG Low/Mod Area Data are NOT based on the special tabulation data. They are created using a routine that extrapolates from SF 3 data. You can download CDBG Low/Mod Area Data from: http: //www. hud. gov/offices/cpd/systems/ce nsus/lowmod/index. cfm
Housing Needs - CHAS n n Housing Quality u Census Data weak measure on housing quality u Without complete kitchen or complete plumbing Overcrowding u Greater than 1. 01 persons per room u Severe Crowding GT 1. 51 persons per room u Increased over past decade
Housing Needs (cont) n Affordability u Cost Burden - greater than 30% of income for housing u Severe Cost Burden - greater than 50% of income for housing
Using the Data: Example A 3 B. HOUSEHOLD INCOME IN 1999 BY HOUSING UNIT PROBLEM SEVERITY (35) Universe: Renter occupied housing units Household income less than or equal to 30. 0% of HAMFI Lacking complete plumbing facilities or lacking complete kitchen facilities With 1. 51 or more person per room, none of the needs above With 1. 01 to 1. 50 persons per room, none of the needs above Housing cost burden over 50. 0 percent, none of the needs above Housing cost burden 30. 1 to 50 percent, none of the needs above Zero income No housing unit problems Household income 30. 1% to 50. 0% of HAMFI (Repeat HOUSING UNIT PROBLEM SEVERITY ) Household income 50. 1% to 80. 0% of HAMFI (Repeat HOUSING UNIT PROBLEM SEVERITY ) Household income 80. 1% to 95. 0% of HAMFI (Repeat HOUSING UNIT PROBLEM SEVERITY ) Household income above 95. 0% of HAMFI (Repeat HOUSING UNIT PROBLEM SEVERITY )
Source: Table A 3 B 040 r Census 2000 CHAS Special Tabs
Source: Table A 3 B 040 r Census 2000 CHAS Special Tabs
Other Favorite Tables The F 5 Tables: n n HOUSING UNIT PROBLEMS AND COST BURDEN BY HOUSEHOLD INCOME IN 1999 BY HOUSEHOLD TYPE F 5 A – Owners with a mortgage F 5 B – Owners without a mortgage F 5 C – Renters of Single Family Homes F 5 D – Renters of Multifamily Units
Other Favorite Tables Mobility and Self-Care Limitations by housing needs and age of household members – Tables A 7 A, A 7 B, A 7 C n Housing Need by Income Breaks of 20%, 30%, 40%, 50%, 65%, 80%, 95%, 100%, 115%, 120% and 140% of HAMFI – Tables A 6 A & A 6 B n
Other Favorite Tables Poverty Rates with and without college students – Table A 13 n Income and Age of Housing for Families with Children Age 6 and Under – Tables A 14 A and A 14 B n
GIS – Shape Files for Census Tract (part) and Block Group (part) files n Shape files for Summary Levels 080, 090, and 091 are not standard products so HUD created them. You can download at: http: //www. huduser. org/geo/summarylevel. asp
www. huduser. org/geo/summarylevel. asp
Select a Summary Level
Select a State
Select a County
Join CHAS or CDBG Low/Mod Data to Boundary File For CDBG Low/Mod Use common LOGRECNO field For CHAS Tables, join on SUM 080 (for Tract) or SUM 091 (for Block Group)
Example: Map Low/Mod Areas with Local Projects
Questions or Comments n Todd Richardson u Phone: (202) 708 -3700 x 5706 u Email: Todd_M. _Richardson@HUD. GOV