Chartrunner Tutorial Introduce basic operations Some useful tips

Chartrunner Tutorial • Introduce basic operations • Some useful tips– Where to store your charts – How to organize your data – Variable names, Chart names
 Data Yes � –R More than one")
Decide on type of data Continuous (Variables) Data Yes � –R More than one observation per subgroup? < 10 observations per subgroup? Discrete (Attributes) Data No No � –s No Yes Xm. R Are there equal area of opportunity? c-chart Can both occurrences & non-occurrences be counted? No u-chart No Yes Are the subgroup sizes equal? p-chart Yes np-chart

Look at a sample chart • Open the program and select the chart that says: “Measurement control chart (01) health, Individuals, Average days positive mammogram”

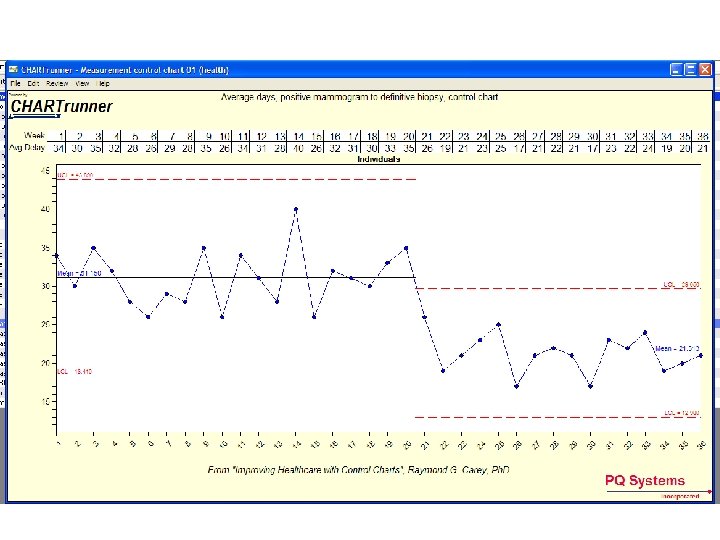

What did their data look like to get that chart? • In Text file or Excel, data needs to be in columns with Time and Measurement headings • Now, go to the main menu and let’s see if we can re-create this chart • Make a new chart by clicking on the green + symbol, +

Step 1: Chart Name/Data Type • • Name: “Example 1” Description: optional Chart Categories: Measurement Control Chart Type: Individuals

Step 2: Data Source • Select: Microsoft Excel from drop down menu • Database or filename: Browse: Day 1. xls

Step 3: Data Definition • Table: select Example 1 • How to treat the columns by: – Avg Delay: select “Measurement” – Week: select: “Unique Identifier” • Click “OK”
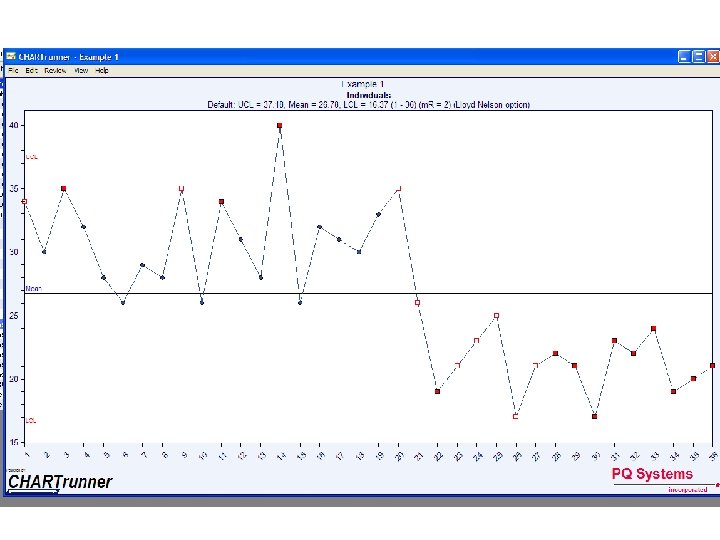

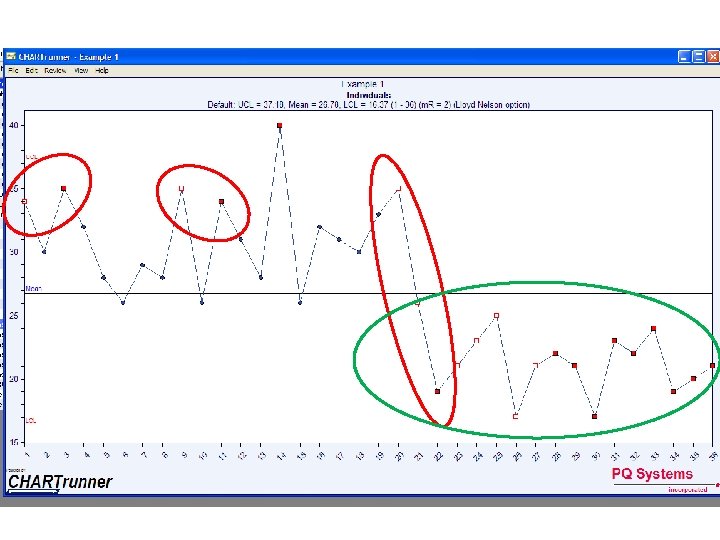
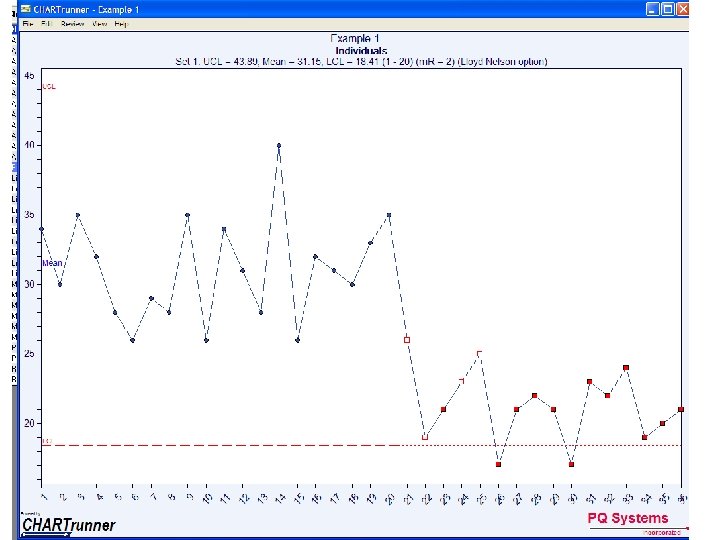
Is this the same chart? • Is the process stable? • How many criteria for special cause does this meet? • What’s different compared to the sample chart?

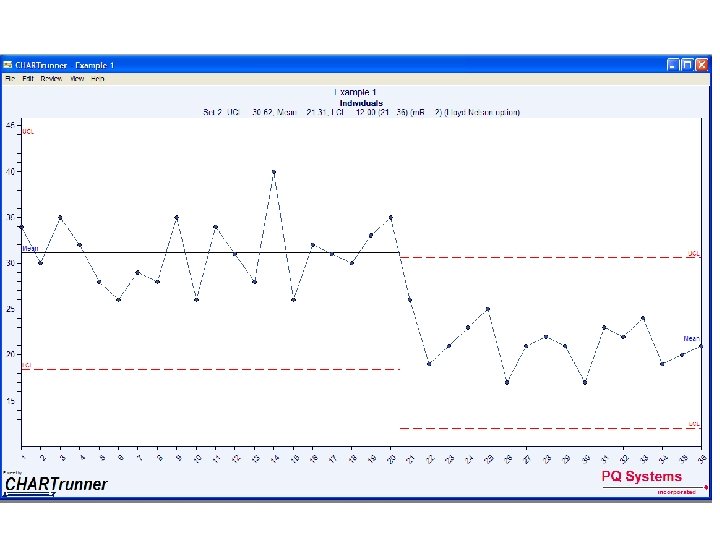
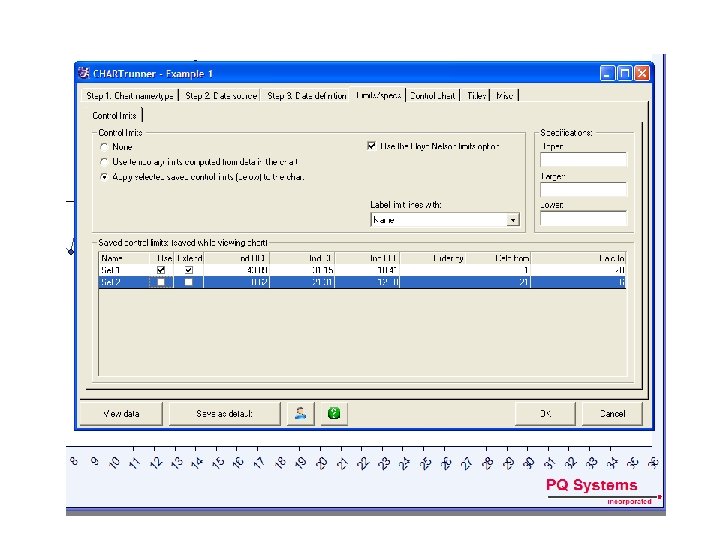
Setting Control Limits • Left click to draw a box around all the points up to and including 20 • Right click and scroll down to “compute limits” • Select , name “baseline”, then click compute and OK • Now, do the same for the reset of the data, points 21 -36. Call this set “Post” • How dose this look now? Is it in control?

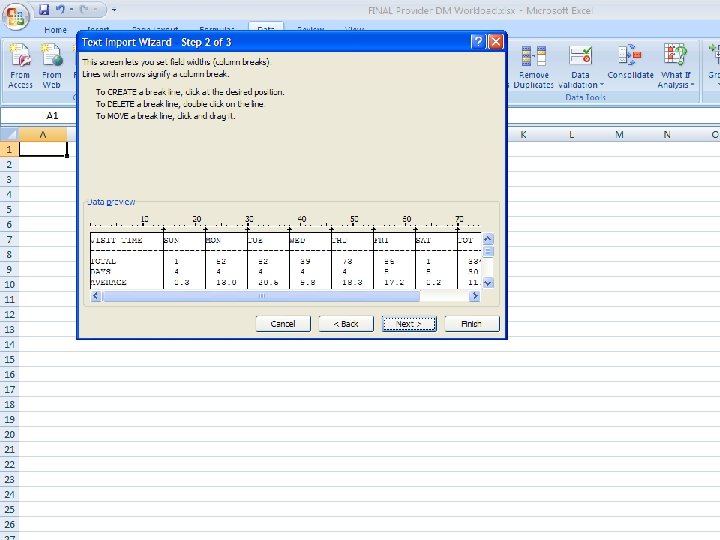
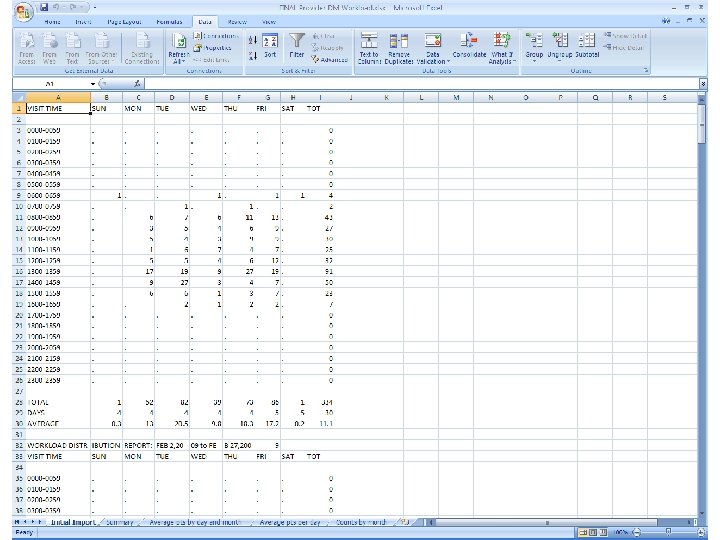
Importing Data from Text to Excel
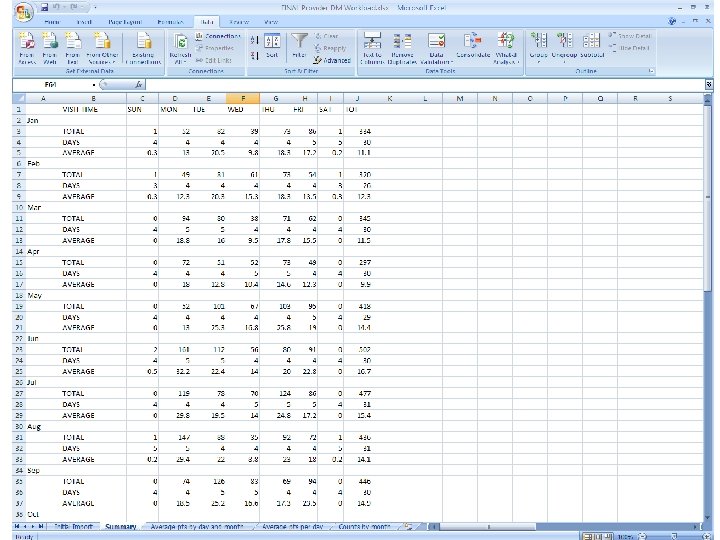

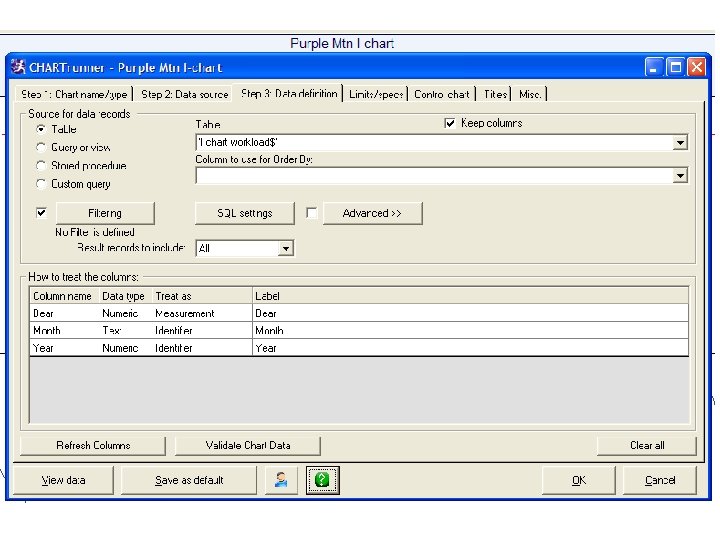
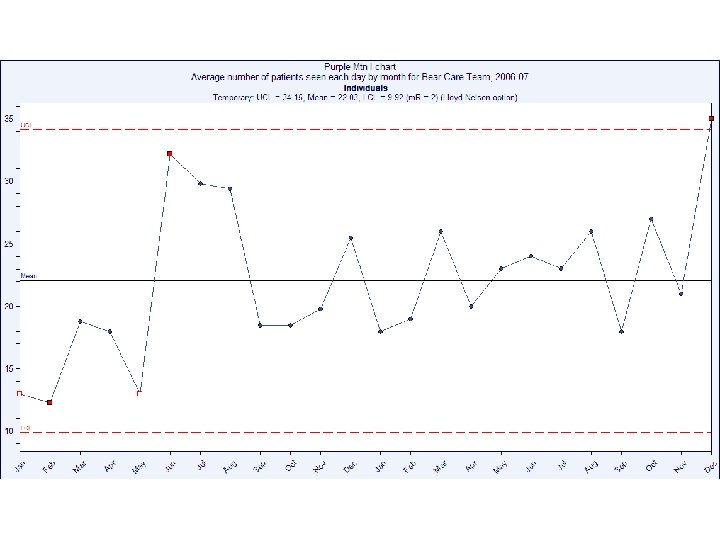
Make an Individuals chart of the number of patients seen per day • Use Day 1. xls • Select the I Chart sheet • Pick the care team you wish to measure (Bear, Orca, Eagle, Raven or Wolf) column for the measurement, Month is the identifier

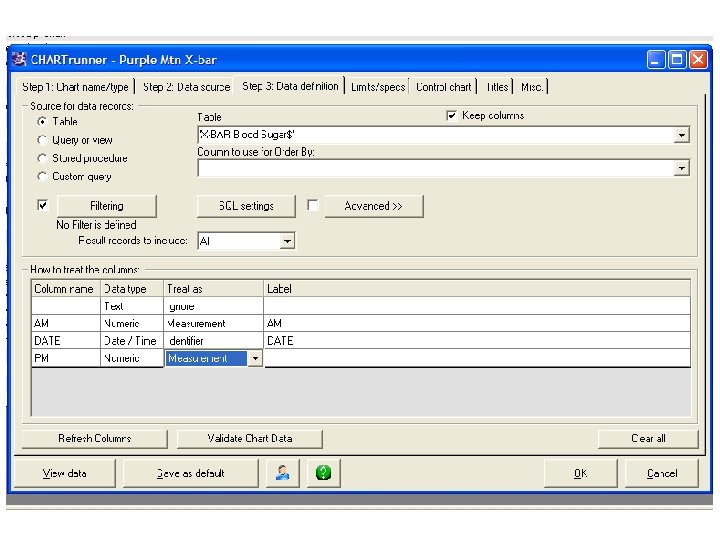
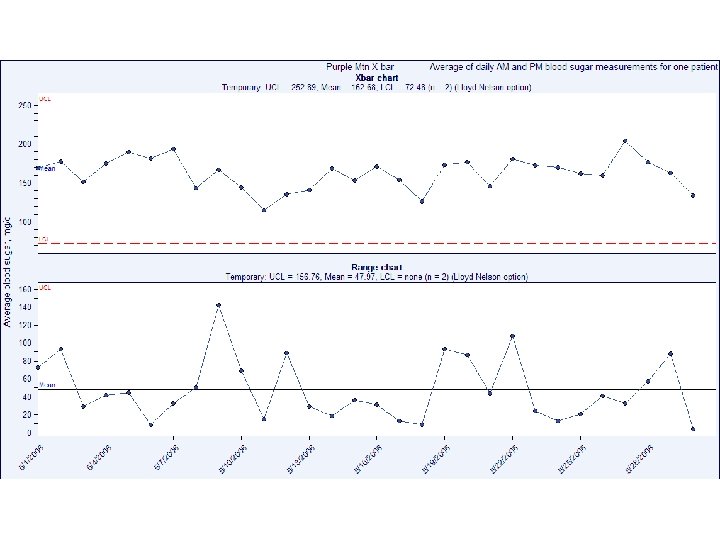
Make an X-bar/range chart of the average daily blood sugar • Use Day 1. xls • Select the X-Bar sheet • Use the AM column and the PM column for the measurement, Date is the identifier (n=2: AM & PM)

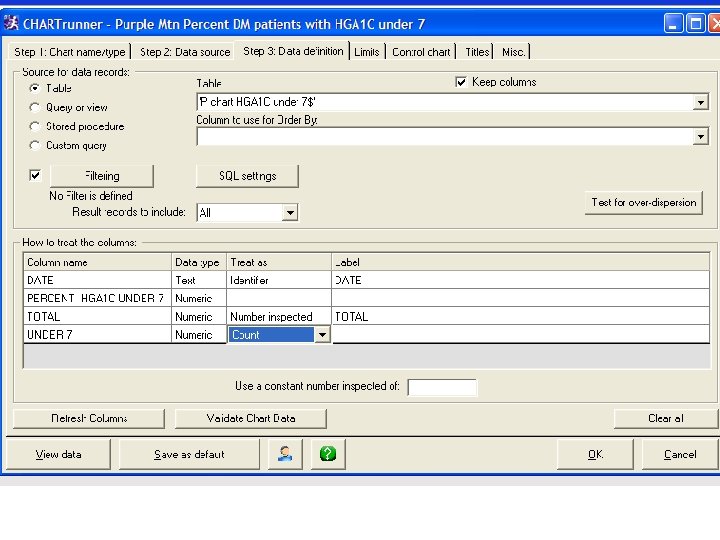
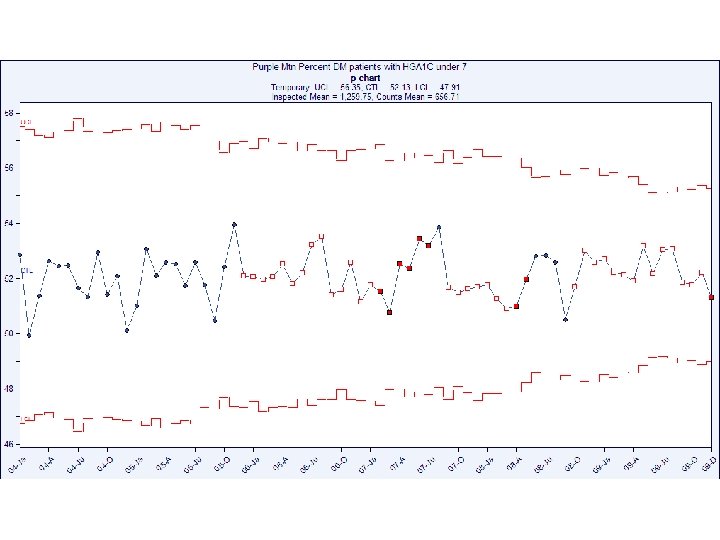
Make a P-chart of the percent of patients each month with HGA 1 C < 7 • Use Day 1. xls • Select the P Chart sheet • Use the Total column for the “number inspected” (aka denominator) and the Under 7 column for the count (numerator), Date is the identifier • Ignore “percent”

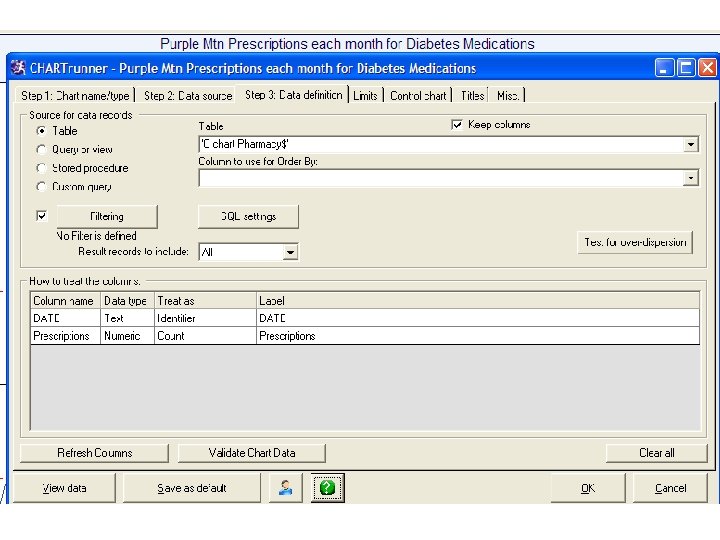
Make a C-chart of the prescriptions each month for diabetes medications • Use Day 1. xls • Select the C Chart sheet • Use the Prescriptions column for the measure, Date is the identifier

- Slides: 32