Charting Tool A tool for a computerised Master


- Slides: 7
Charting Tool A tool for a computerised Master chart (developed for Mumbai Central Division, Western Railway) IIT Bombay Presentation adapted from Mumbai Central Division, Western Railway Acknowledgement: Mr. S. S. Chandrayan
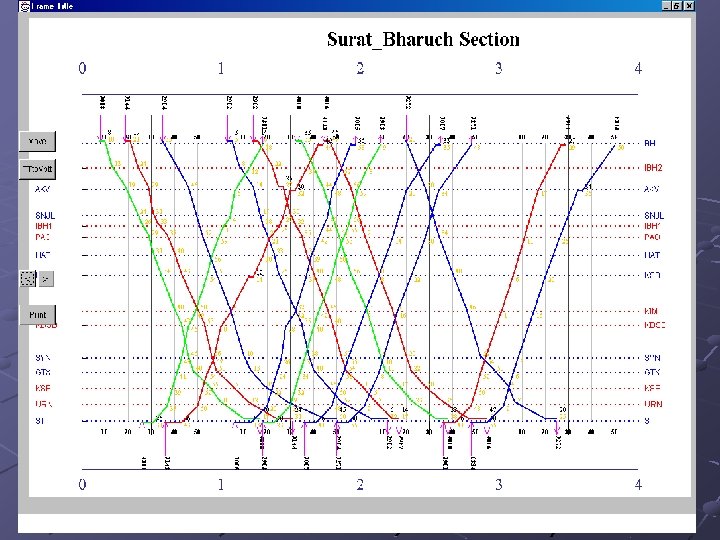
Master chart Scaled graphical representation of trains over a section (i. e group of stations) depicted on ‘Y’ axis for a particular duration of time interval (say 6 , 8 or 24 hrs) depicted on ‘X’ axis.
Why a Computerised Master chart ? Advantages n Flexibility - sections and duration can be varied n Replication - ‘n’ no. of copies can be made n Modification - easier to alter or rectify data n Moving a Train - simulations n Portability - easier to carry
Technical details Uses Java 2 as development platform. Input tables in MS Access n n n Dimensions : Dimensions of axis Station list ( Hold Network) : Station name & distance Time Table Up Time Table Down Blocks : Details of block timing & stations Databases : Drivers or Connectivity names
Output chart can be manoeuvred Section can be altered Duration of plot can be varied 24 hrs, 8 hrs etc. Selected groups of train can be plotted such as only Up, Down, Mail/Exp, Goods trains Chart of any size A 3, A 4, plotter Blocks can be displayed
Applications Addition of new services can be viewed easily Timing of selected services can be changed and impact on rest can be seen Train movement in unusual condition like accidents, rains or maintenance blocks can be viewed.