ChartgoWeb 2 0 Tool Examples Examples How to

Chartgo-Web 2. 0 Tool

Examples

Examples

How to use Chartgo? STEP 1: • When you visit Chart. Go you will land on the home page. To start creating charts, click on the Create Chart link on top. • You can also explore the home page further and find other useful pages like the help section, the guide, the blog and the examples page. The home page also contains a carousel with different charts which you can use as your own.


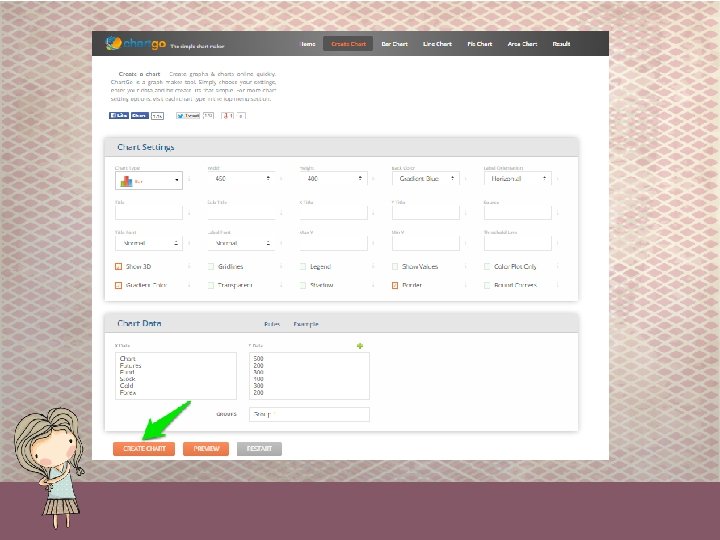
Step 2: • he create chart page is where you enter all the necessary information to generate your chart. The page consists of two important sections, the Settings section and the Data section. • The Settings section contains options that control what you want your chart to look like. • The Data section is where you enter your data values that you want represented on your chart. • When you're satisfied with your choices, press the Create Chart button to generate your chart. Your chart will appear in the Result Page.

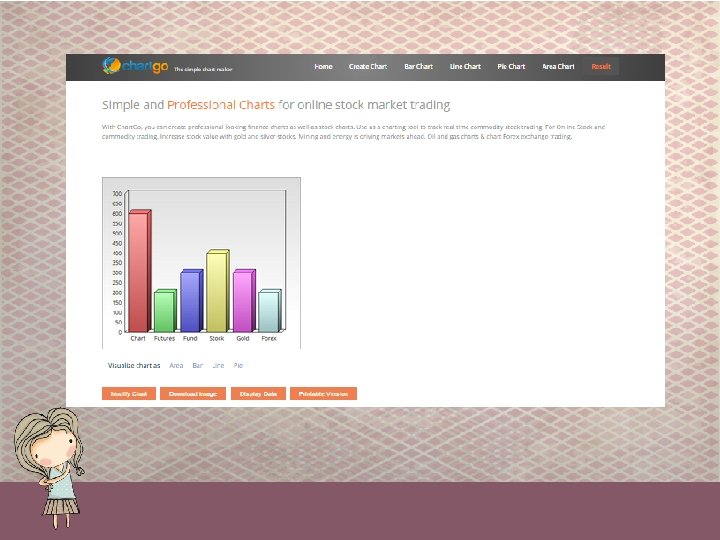
Step 3: • Your generated chart appears here in the result page. From here you have the option of making further changes to your chart, saving the image on your computer or sharing your chart.

Their main goal is to make chart creation simple and visually appealing. Complicated and boring charts should be a thing of the past. Whether you want to create a pie chart or a stock chart, They make it simple for you!!!

The End Thanks!
- Slides: 11