CHARACTERIZING WORK DISABILITY AND HEALTH IN WORKLIFE A

CHARACTERIZING WORK, DISABILITY AND HEALTH IN WORK-LIFE: A MULTI-STATE APPROACH Amal Harrati Peter Hepburn Mark Cullen August 3, 2017

Aims What are common trajectories of work and disability? How, if at all, do demographic, health and job characteristics differ across the individuals in these different trajectories? • Characterize common trajectories between work and disability in a cohort of workers. • Identify differences in trajectories across sociodemographic and health status.

Background • While changed employee incentives have resulted in longer work-life, disability claims are also rising at all ages • Transitions into short and long-term disability is associated with: • Loss of lifetime earnings (Breslin et al. 1999) • Increased medical cost (Sears et al. 2012) • Family disruption (Eriksen 1999) • Psychological distress (Bultmann 2002) • Little known about the transitions in and out of disability in individual’s working life

Health Workplace Safety & Environment • Injury experience • Hygenius workplace samples • Job Demand Survey • Production/Quantity & Quality by month • Community Health Indices (Census/BRFSS) • Employee Engagement Survey Stanford-Yale Alcoa Data Vault • OHM: Cardiovascular data, PFTS, Audiometry, and Workplace Medical Surveillance Files • Medical Claims Files • EAP (roll-up by plant) • Disability claims • Injury Management System • Medicare Claims linked to worklife claims • Death - NDI • Health Risk Scores Financial • Payroll (hours) • W-2’s • 401 K and Pension • Housing Values • Links to SSA-household earnings, life-work and disability Demographic Data • SSN – Childhood Locale • Geocoded addresses • Human Resources • Dependent Information

Empirical Strategy • Human Resources data from Jan. 1996 – Dec. 2013 • 6 states, monthly data • Regular work, STD, LTD, On Leave, Left Alcoa, Retire • N= 49, 529 workers • 10+ million worker-time observations

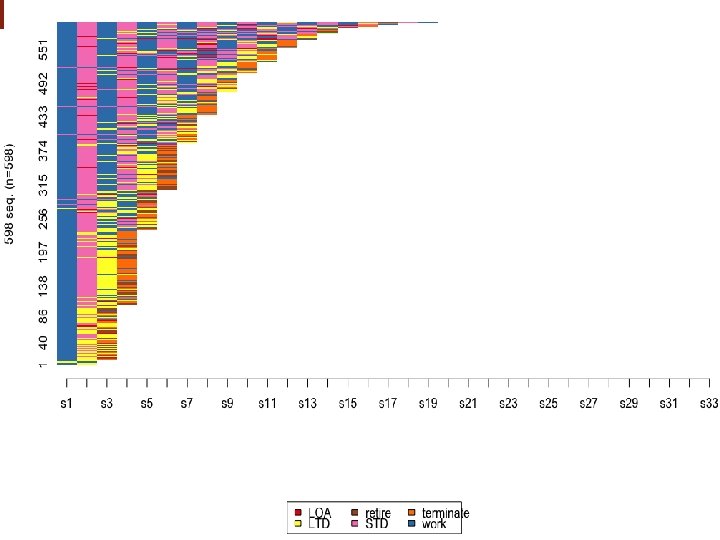
Empirical Strategy • Human Resources data from Jan. 1996 – Dec. 2013 • 6 states, weekly data • Regular work, STD, LTD, On Leave, Left Alcoa, Retire • N= 49, 529 workers • 10+ million worker-time observations • Use sequence analysis to build trajectories of work/disability and cluster analysis to create groups • Optimal distance matching insertion/deletion costs set to observed transition rates • Partitioning around Mediods, ASW: 0. 723

Empirical Strategy • Human Resources data from Jan. 1996 – Dec. 2013 • 6 states, weekly data • Regular work, STD, LTD, On Leave, Left Alcoa, Retire • N= 49, 529 workers • 10+ million worker-time observations • Use sequence analysis to build trajectories of work/disability and cluster analysis to create groups • Multinomial logistical models to explore associations to person-, job-, and plant-level characteristics

Multiple Transitions across States Are Possible Regular Work On Leave STD Left Alcoa LTD Leave Retire Alcoa

Cohort Characteristics N = 49, 594 % Gender Male % Risk Score 82. 2 Race/Ethnicity 0 -1 1 -2 64. 6 26. 0 White 82. 3 2 -3 6. 4 Black 8. 3 3 -4 2. 0 Hispanic 6. 3 4 -6 0. 98 Asian 2. 2 Chronic Disease Other 0. 8 Employee Type COPD/Asthma 3. 4 Depression 3. 4 Hourly 76. 6 Hypertension 20. 0 Median Age 40. 7 IHD 3. 1 Musculoskeletal 30. 5 Median Annual Salary $53, 312
 WORK TERM")
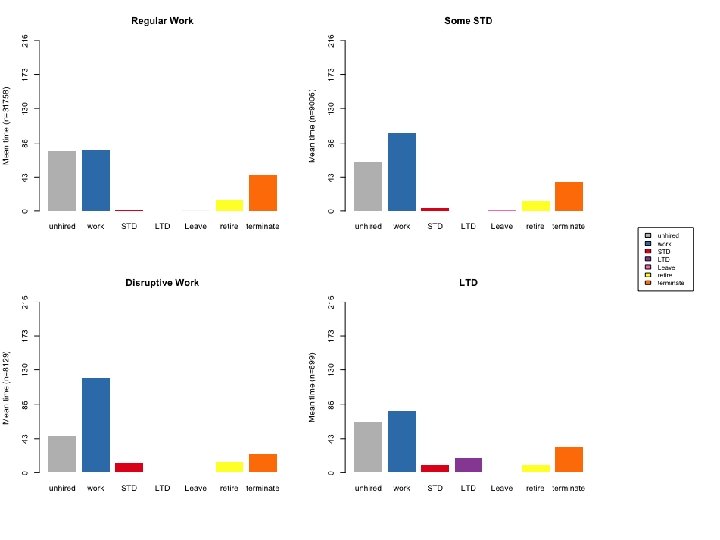
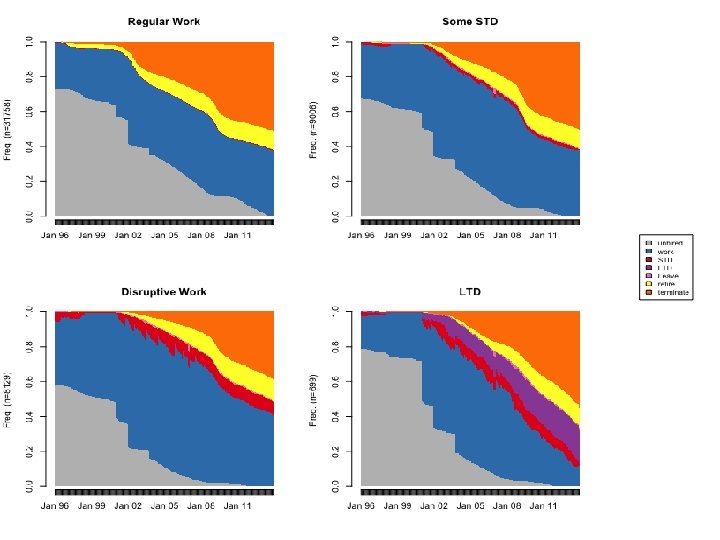
Identifying typologies: “Continuous Work” WORK ( N= 12, 177; 24. 5% ) WORK TERM (16, 231; 32. 7%) WORK Retire (3350, 6. 7% ) 64% (N=31, 758) of the sample stays continuously employed (and/or leave Alcoa for other reasons) through sample period.
 WORK STD WORK TERM WORK STD")
Identifying typologies: “Minor STD” (4, 477; 9% ) WORK STD WORK TERM WORK STD (4, 529, 9. 1% ) WORK (3, 936, 7. 9% )
 WK STD")
Identifying typologies: “Disruptive” WK STD WK ( 2, 931; 5. 9% ) WK STD WK ( 1, 262; 2. 5% ) STD WK
")
Identifying typologies: “Ever LTD” WORK LTD ( 1. 4% )
 Age STD (minor) STD")
Demographics differ across trajectory groups (Relative to continuous work group) Age STD (minor) STD (disruptive)) LTD Tenure Hourly Male Health

What demographic, health and job-related characteristics are associated with cluster membership?

Cum TPM Q 4 Cum TPM Q 3 Cum TPM Q 2 Ann TPM Q 4 Ann TPM Q 3 Ann TPM Q 2 Musculoskeletal Hypertension Ischemic Heart Disease Depression Arthritis Disruptive Work Asthma Short STD Risk Score Smelter W 2 Tenure Unionized Other Black Female Age Squared Age 0, 000 0, 500 1, 000 1, 500 2, 000 2, 500 3, 000 3, 500

Cum TPM Q 4 Cum TPM Q 3 Cum TPM Q 2 Ann TPM Q 4 Ann TPM Q 3 Ann TPM Q 2 Musculoskeletal Hypertension Ischemic Heart Disease Depression Arthritis Disruptive Work Asthma Short STD Risk Score Smelter W 2 Tenure Unionized Other Black Female Age Squared Age 0, 000 0, 500 1, 000 1, 500 2, 000 2, 500 3, 000 3, 500

Cum TPM Q 4 Cum TPM Q 3 Cum TPM Q 2 Ann TPM Q 4 Ann TPM Q 3 Ann TPM Q 2 Musculoskeletal Hypertension Ischemic Heart Disease Depression Arthritis Disruptive Work Asthma Short STD Risk Score Smelter W 2 Tenure Unionized Other Black Female Age Squared Age 0, 000 0, 500 1, 000 1, 500 2, 000 2, 500 3, 000 3, 500

Conclusions • There a number of disparate work/disability transitions and trajectories; some very disruptive • Differences exist across a number of demographic and health conditions. • Physical occupational exposures are strongly associated with disruptive job trajectories. • 40% of U. S. workers have jobs that require some physical demand (Johnson, 2004)

Data Limitations • No measure of work-status and income post-Alcoa • No measure of spouse working status • No measure of household income • No measure of SSDI claiming

Next steps • Event history analysis: exploring timing of onset and repeat episodes. • Link to Social Security Administration data to understand retirement patterns

Thanks to: Valerie Meausonne NIA R 01 AG 026291 Sloan Foundation Working Longer President’s Grant aharrati@stanford. edu

Total Particulate Matter and health
- Slides: 26