
CHARACTERIZING AND SELECTING FRESH DATA SOURCES THEODOROS REKATSINAS





- Slides: 43
CHARACTERIZING AND SELECTING FRESH DATA SOURCES THEODOROS REKATSINAS XIN LUNA DONG DIVESH SRIVASTAVA UNIVERSITY OF MARYLAND GOOGLE INC. AT&T LABS-RESEARCH
DATA IS A COMMODITY myriads of data sources
DATA IS A COMMODITY myriads of data sources FREELY AVAILABLE SOURCES open data initiative world data bank crawling the web
DATA IS A COMMODITY myriads of data sources FREELY AVAILABLE SOURCES DATA MARKETS: SELL YOUR DATA TO OTHERS datasift microsoft azure marketplace datamarket. com infochimps
DATA IS A COMMODITY myriads of data sources FREELY AVAILABLE SOURCES DATA MARKETS: SELL YOUR DATA TO OTHERS HETEROGENEOUS DATA SOURCES different quality - cost cover different topics static or dynamic exhibit different update patterns
“Truth, like gold, is to be obtained not by its growth, but by washing away from it all that is not gold. ” –LEO TOLSTOY
So, can we find gold in a systematic and automated fashion? Yes! Use source selection to reason about the benefits and costs of acquiring and integrating data sources [Dong et al. , 2013] Techniques agnostic to time and focus on accuracy of static sources
Select sources before actual data integration When do we need to use the integration result ? matters Data in the world and the sources changes
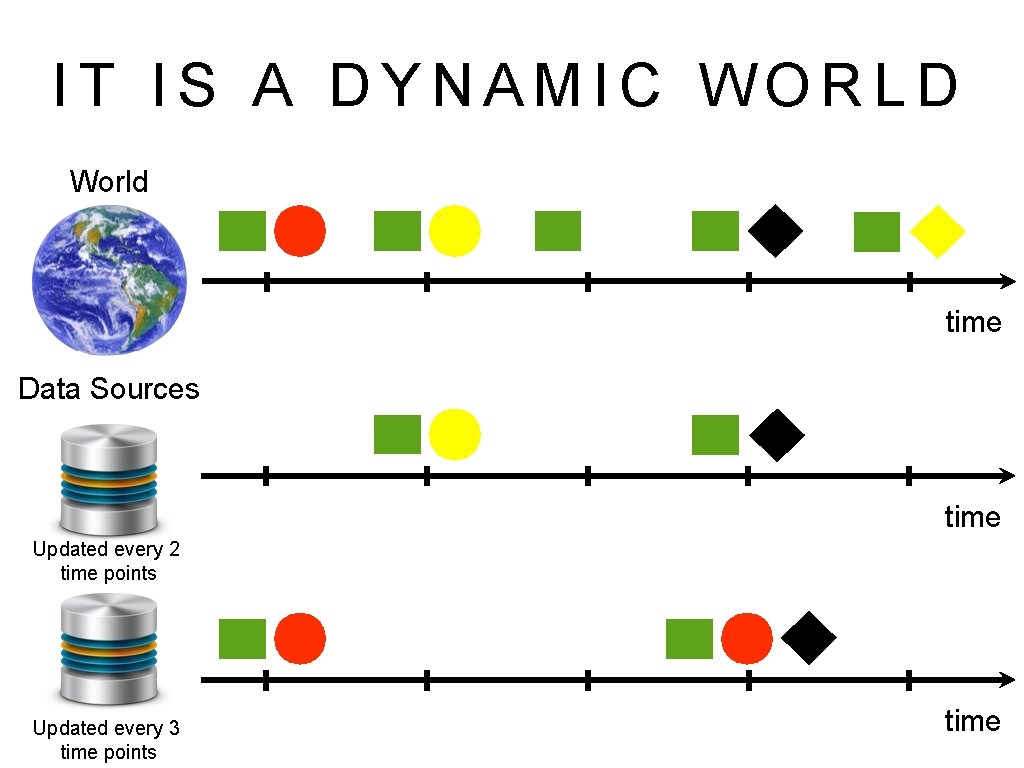
IT IS A DYNAMIC WORLD World time Data Sources time Updated every 2 time points Updated every 3 time points time
CHALLENGES AND OPPORTUNITIES Business listings (BL) ~40 sources, 2 years ~1, 400 categories, 51 locations
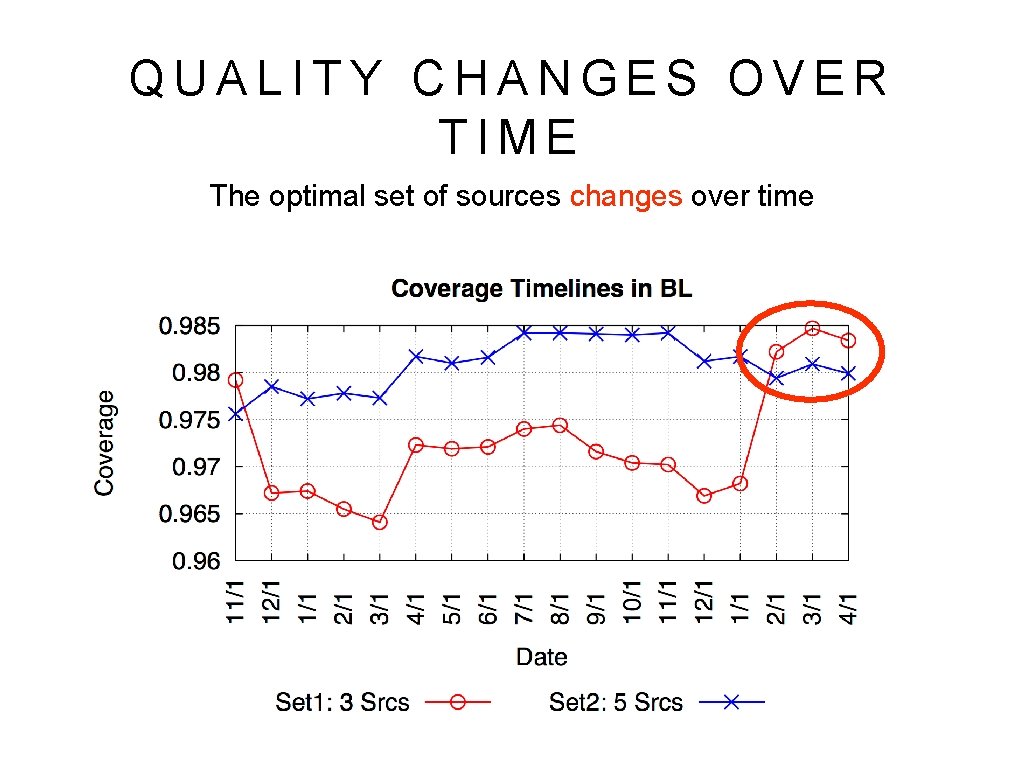
QUALITY CHANGES OVER TIME The optimal set of sources changes over time
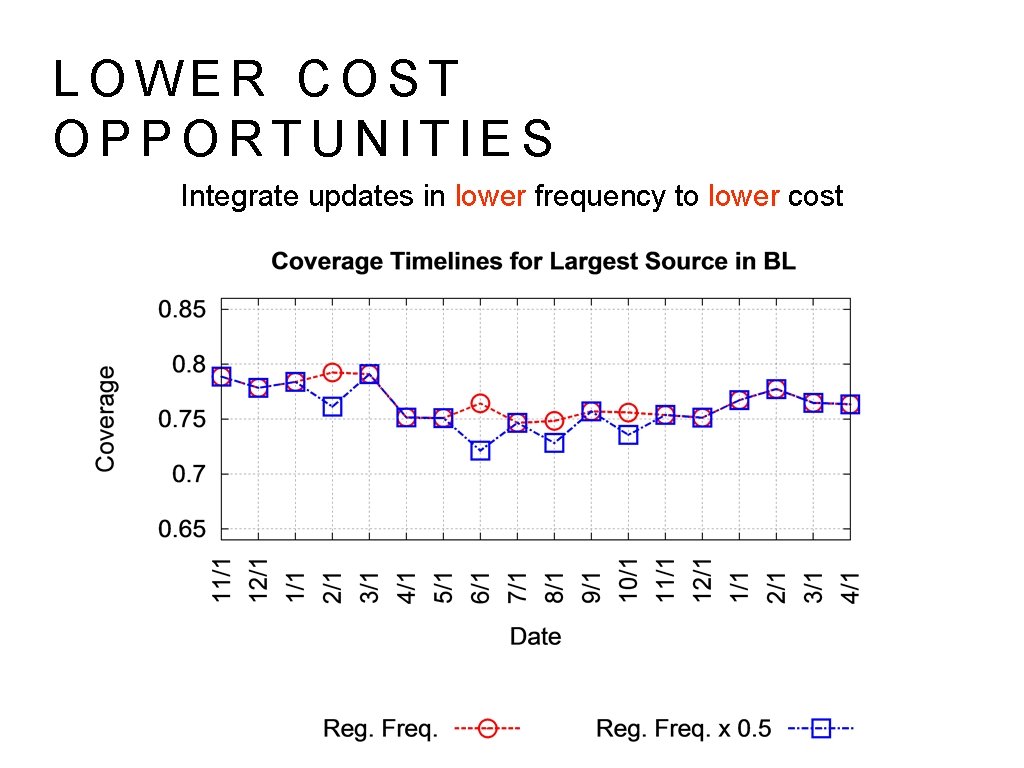
LOWER COST OPPORTUNITIES Integrate updates in lower frequency to lower cost
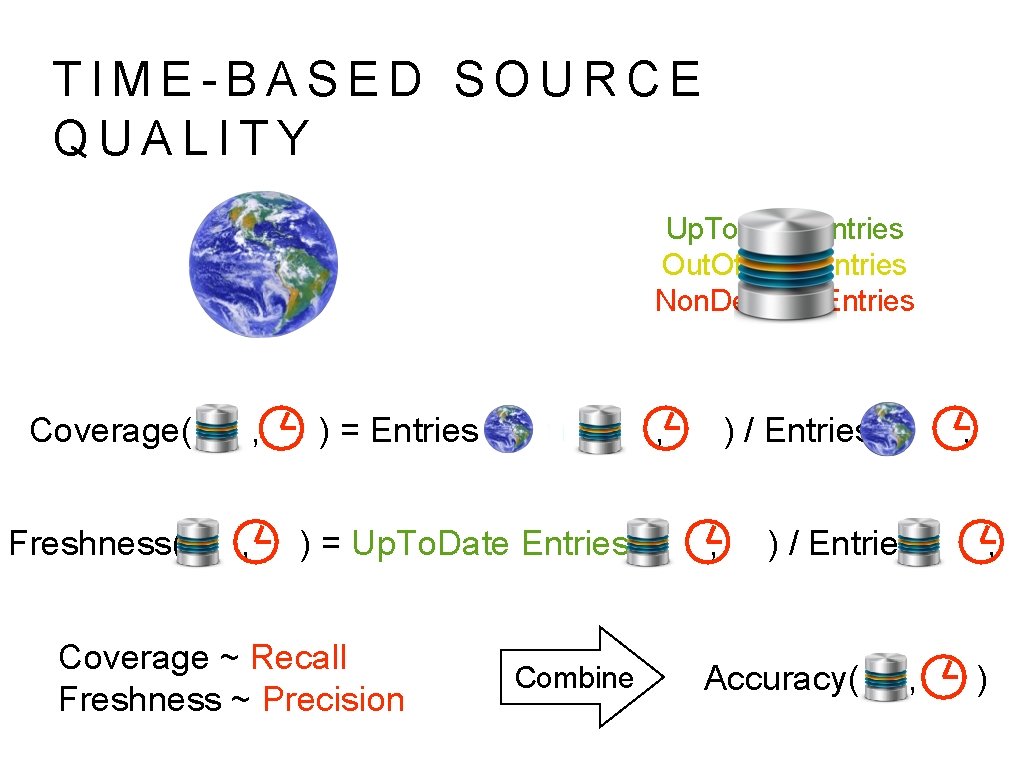
TIME-BASED SOURCE QUALITY Up. To. Date Entries Out. Of. Date Entries Non. Deleted Entries Coverage( , Freshness( , ) = Entries ( , ) = Up. To. Date Entries ( Coverage ~ Recall Freshness ~ Precision Combine ) / Entries ( , , ) / Entries ( Accuracy( , , )
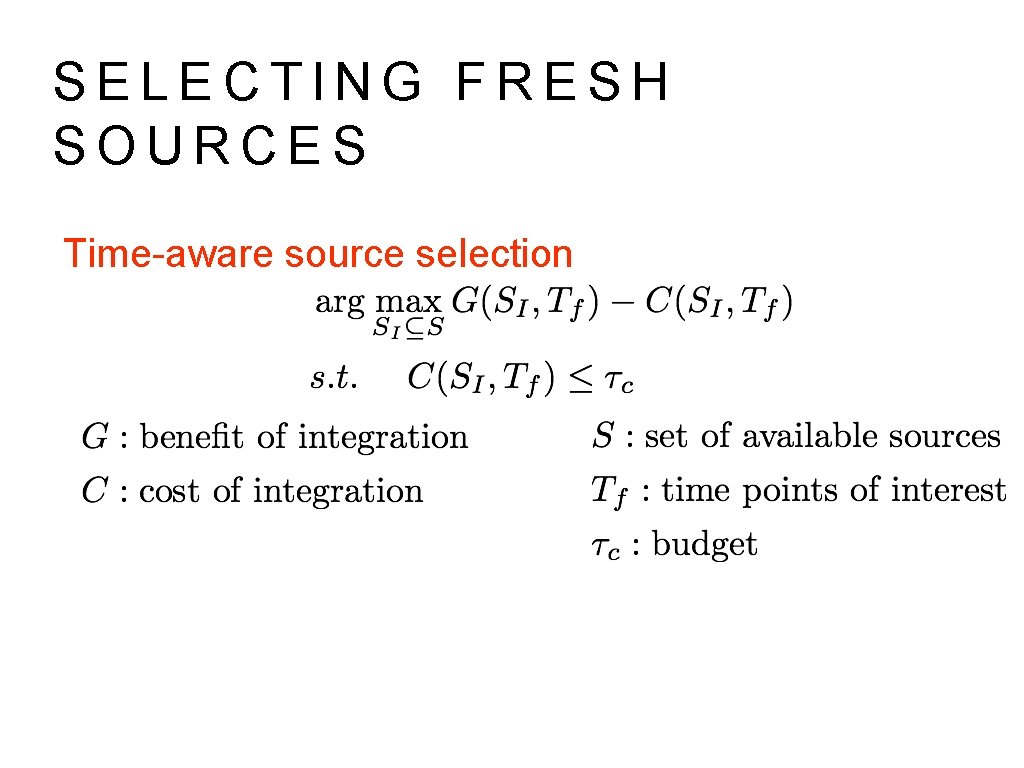
SELECTING FRESH SOURCES Time-aware source selection
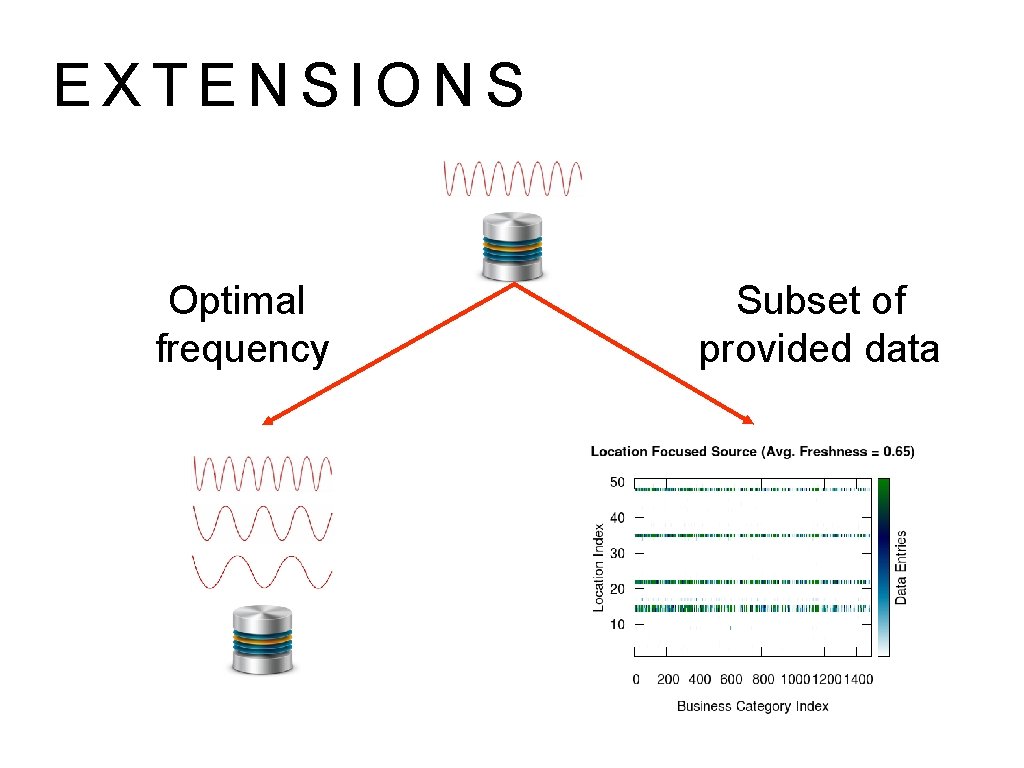
EXTENSIONS Optimal frequency Subset of provided data
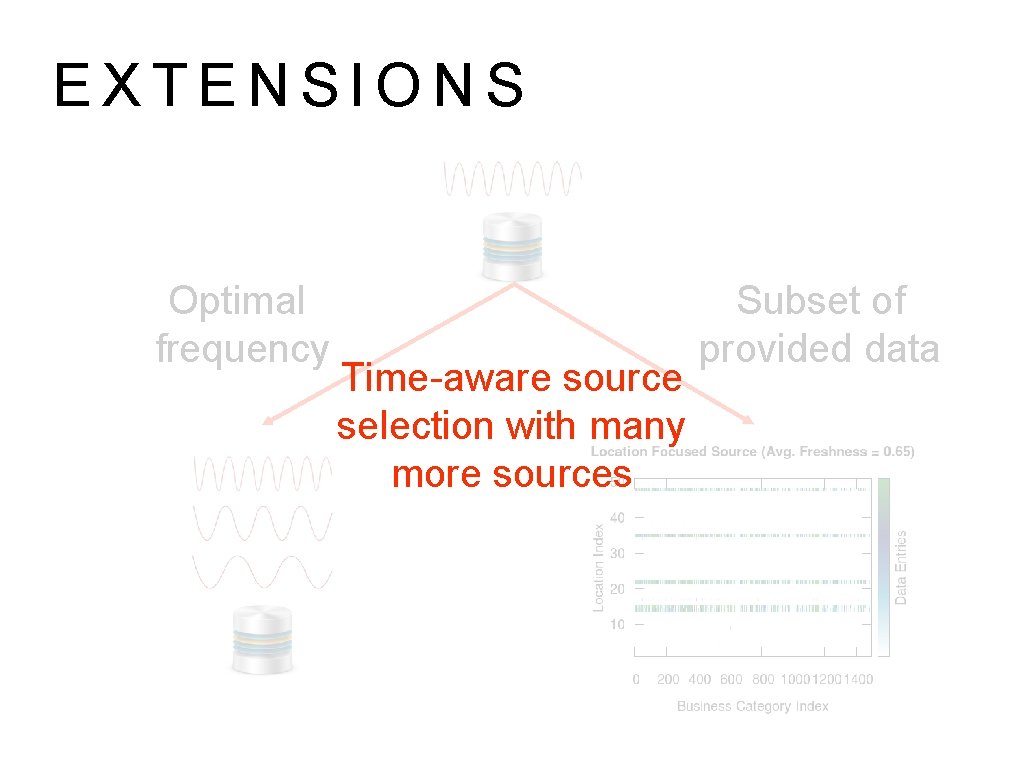
EXTENSIONS Optimal frequency Time-aware source selection with many more sources Subset of provided data
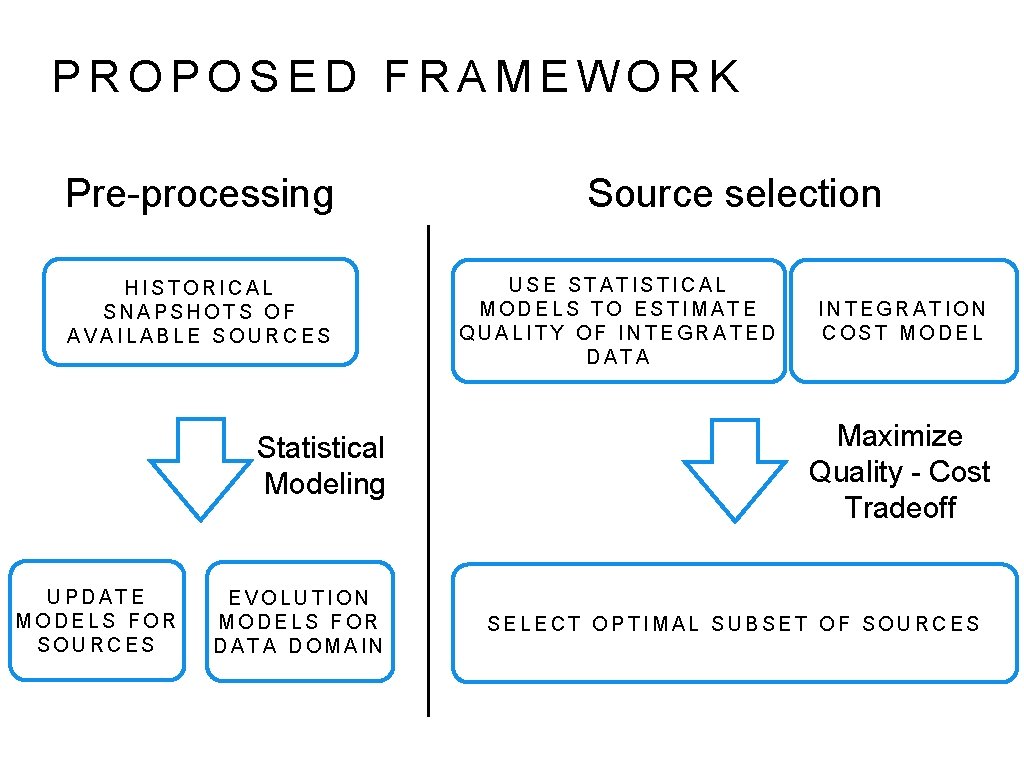
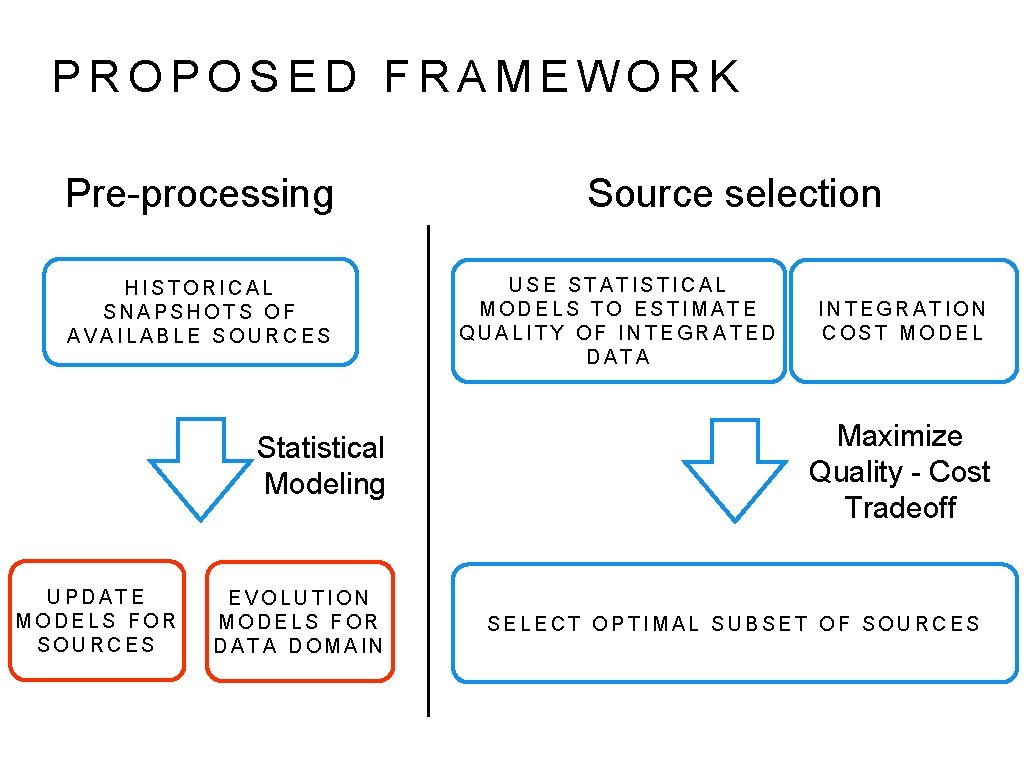
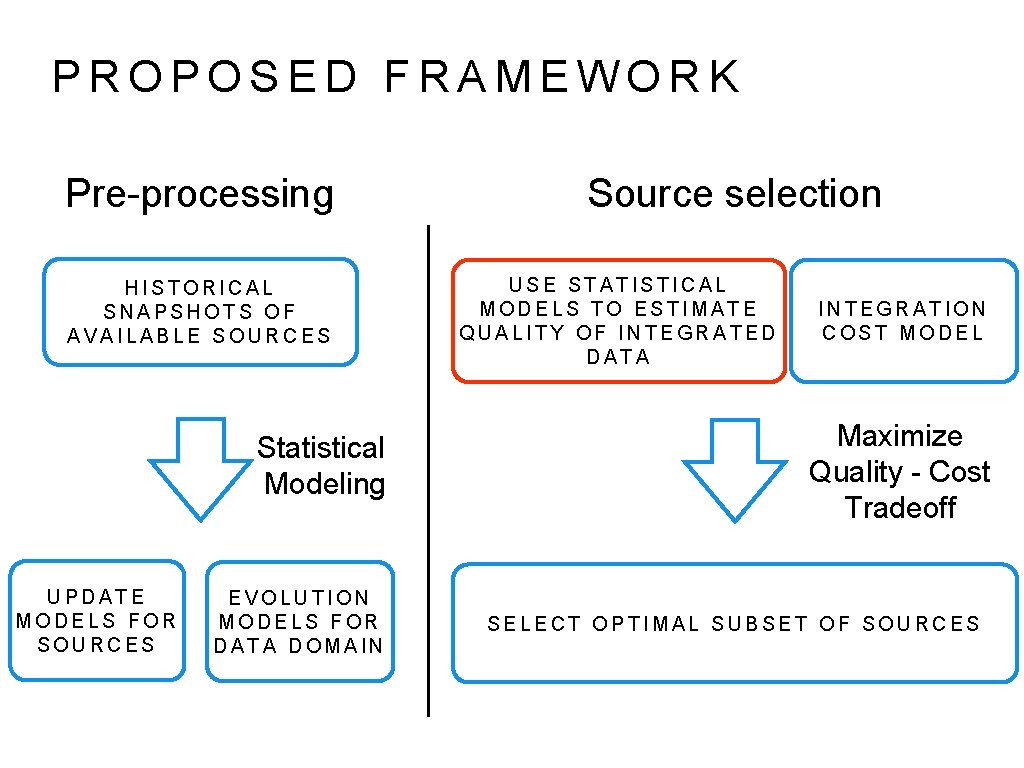
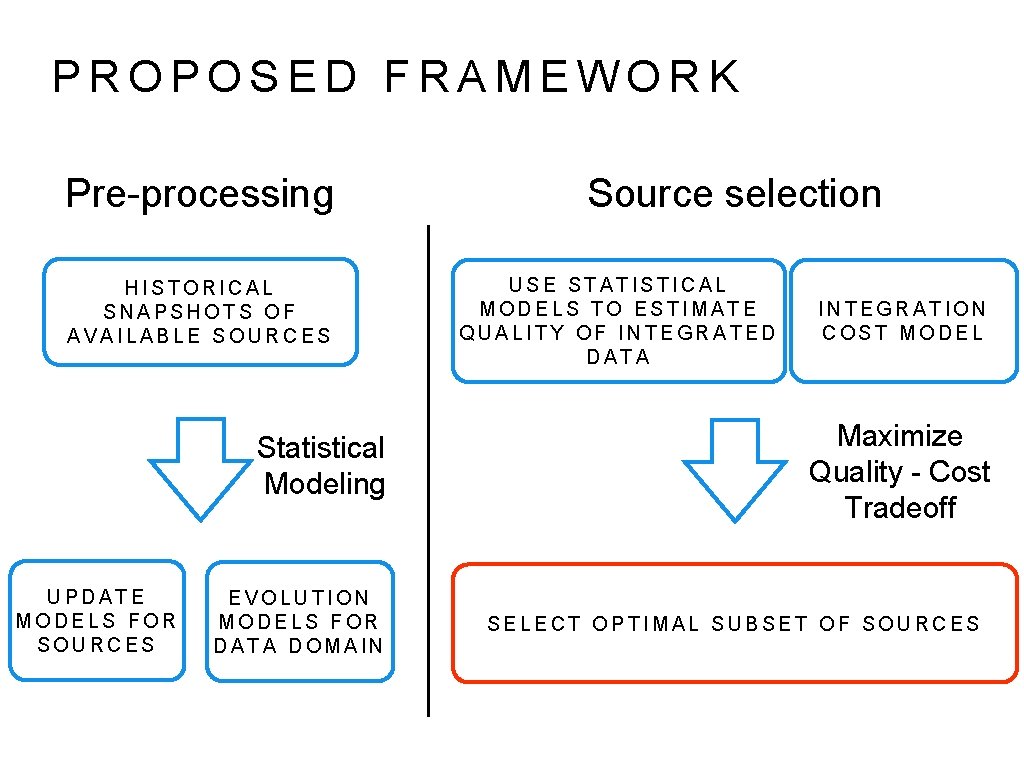
PROPOSED FRAMEWORK Pre-processing HISTORICAL SNAPSHOTS OF AVAILABLE SOURCES Statistical Modeling UPDATE MODELS FOR SOURCES EVOLUTION MODELS FOR DATA DOMAIN Source selection USE STATISTICAL MODELS TO ESTIMATE QUALITY OF INTEGRATED DATA INTEGRATION COST MODEL Maximize Quality - Cost Tradeoff SELECT OPTIMAL SUBSET OF SOURCES
PROPOSED FRAMEWORK Pre-processing HISTORICAL SNAPSHOTS OF AVAILABLE SOURCES Statistical Modeling UPDATE MODELS FOR SOURCES EVOLUTION MODELS FOR DATA DOMAIN Source selection USE STATISTICAL MODELS TO ESTIMATE QUALITY OF INTEGRATED DATA INTEGRATION COST MODEL Maximize Quality - Cost Tradeoff SELECT OPTIMAL SUBSET OF SOURCES
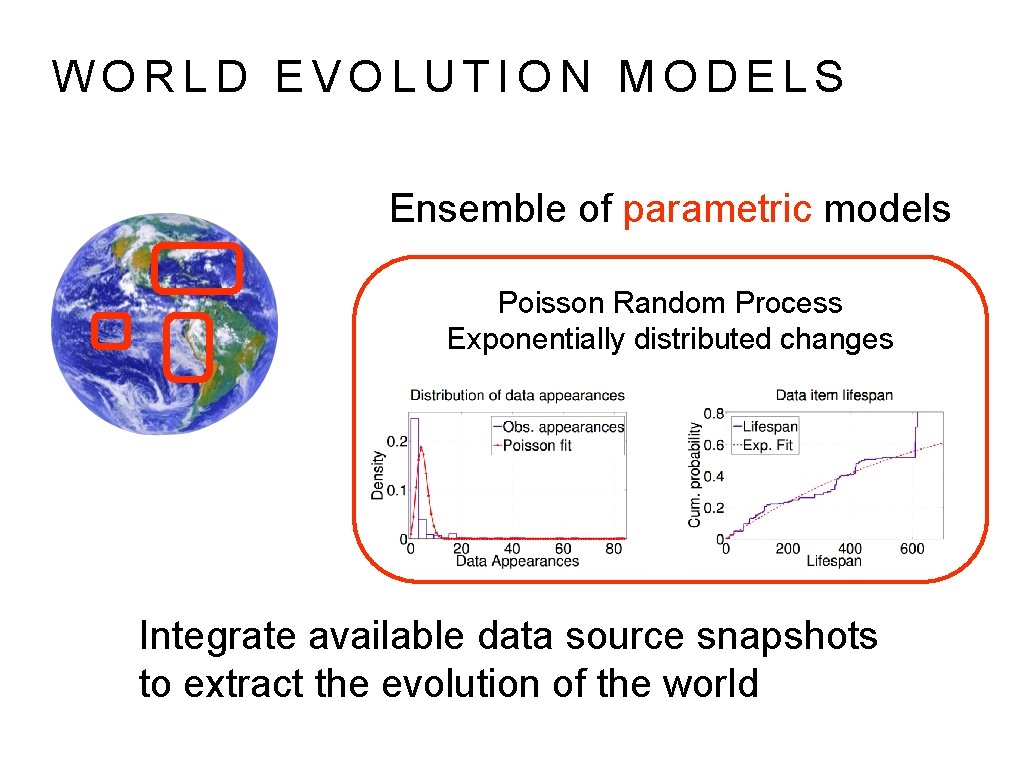
WORLD EVOLUTION MODELS Ensemble of parametric models Poisson Random Process Exponentially distributed changes Integrate available data source snapshots to extract the evolution of the world
SOURCE UPDATE MODELS Shall we consider only the update frequency?
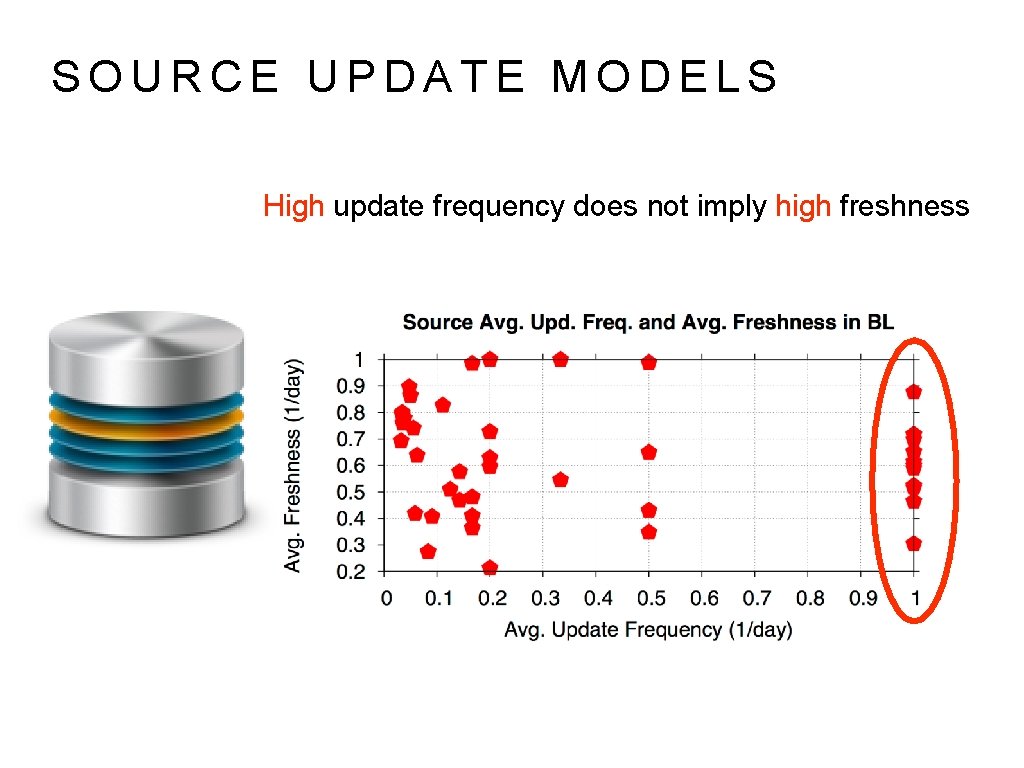
SOURCE UPDATE MODELS High update frequency does not imply high freshness
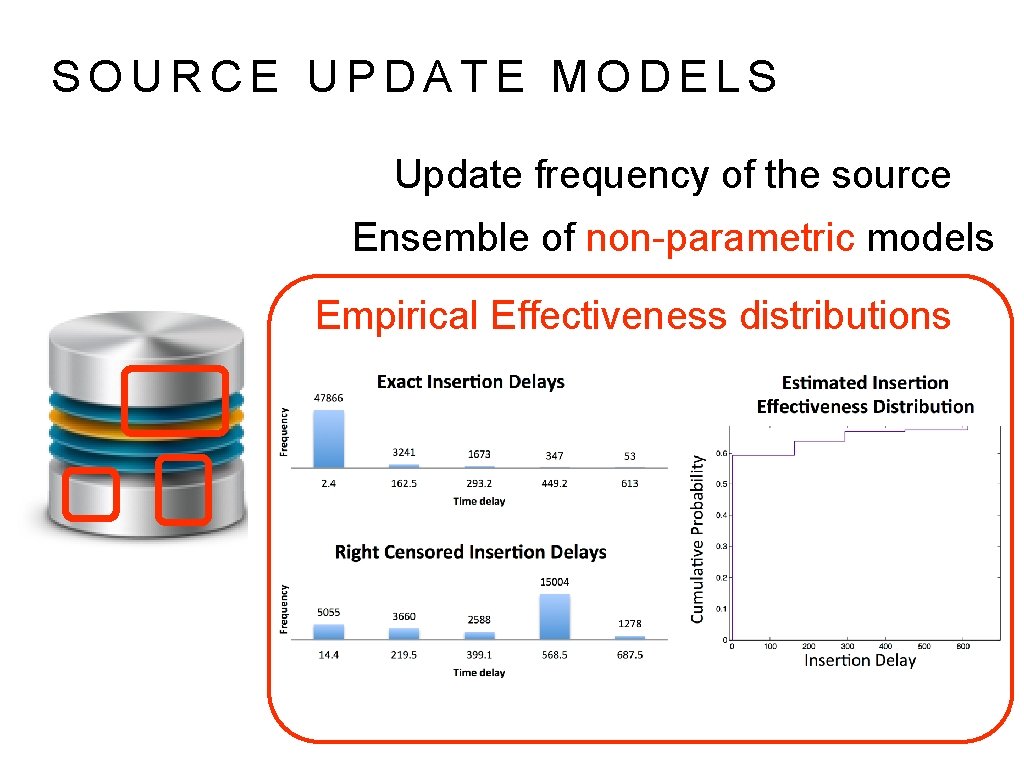
SOURCE UPDATE MODELS Update frequency of the source Ensemble of non-parametric models Empirical Effectiveness distributions
PROPOSED FRAMEWORK Pre-processing HISTORICAL SNAPSHOTS OF AVAILABLE SOURCES Statistical Modeling UPDATE MODELS FOR SOURCES EVOLUTION MODELS FOR DATA DOMAIN Source selection USE STATISTICAL MODELS TO ESTIMATE QUALITY OF INTEGRATED DATA INTEGRATION COST MODEL Maximize Quality - Cost Tradeoff SELECT OPTIMAL SUBSET OF SOURCES
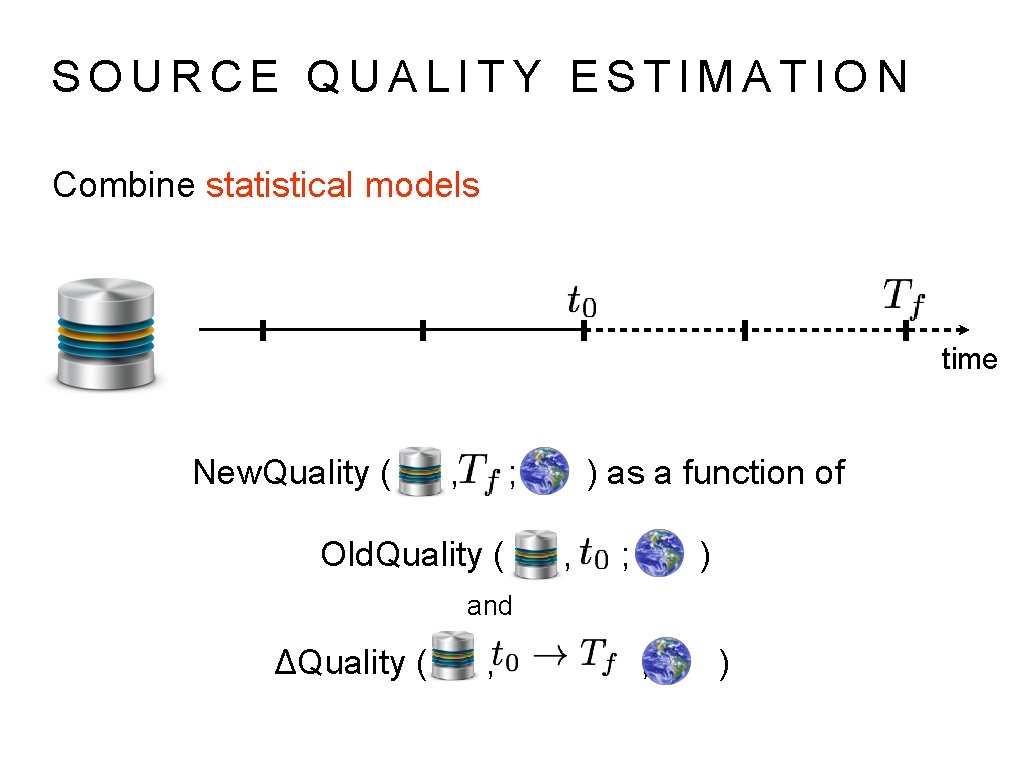
SOURCE QUALITY ESTIMATION Combine statistical models time New. Quality ( , ; Old. Quality ( ) as a function of , ; ) and ΔQuality ( , ; )
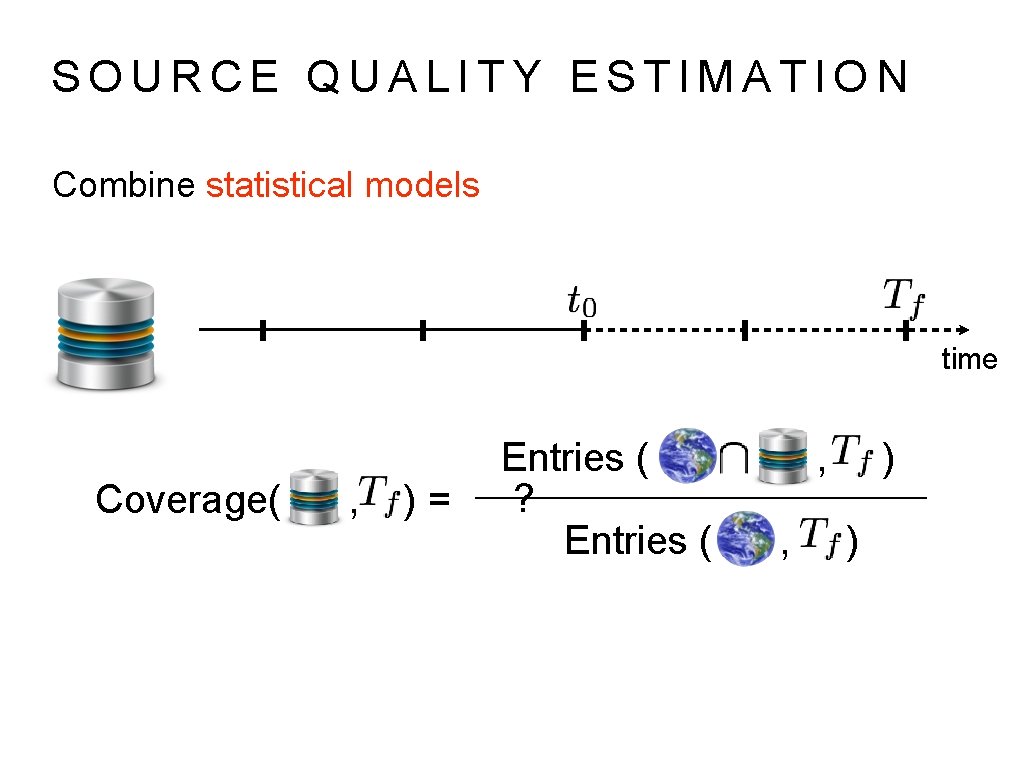
SOURCE QUALITY ESTIMATION Combine statistical models time Coverage( , )= Entries ( ? Entries ( , , ) )
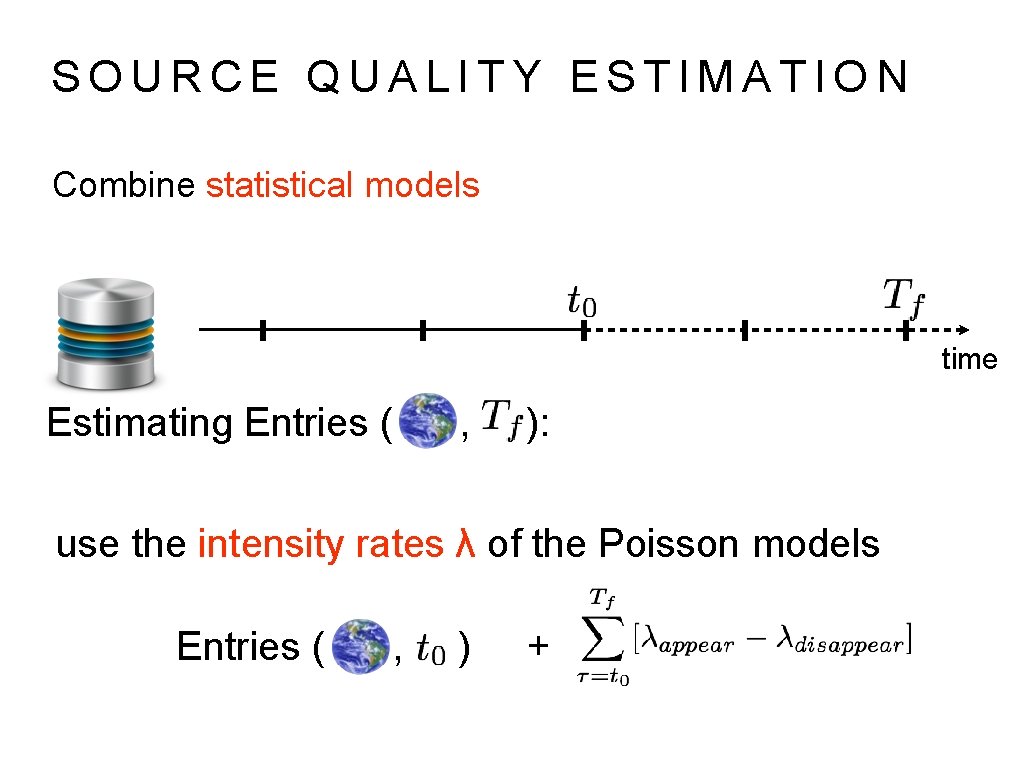
SOURCE QUALITY ESTIMATION Combine statistical models time Estimating Entries ( , ): use the intensity rates λ of the Poisson models Entries ( , ) +
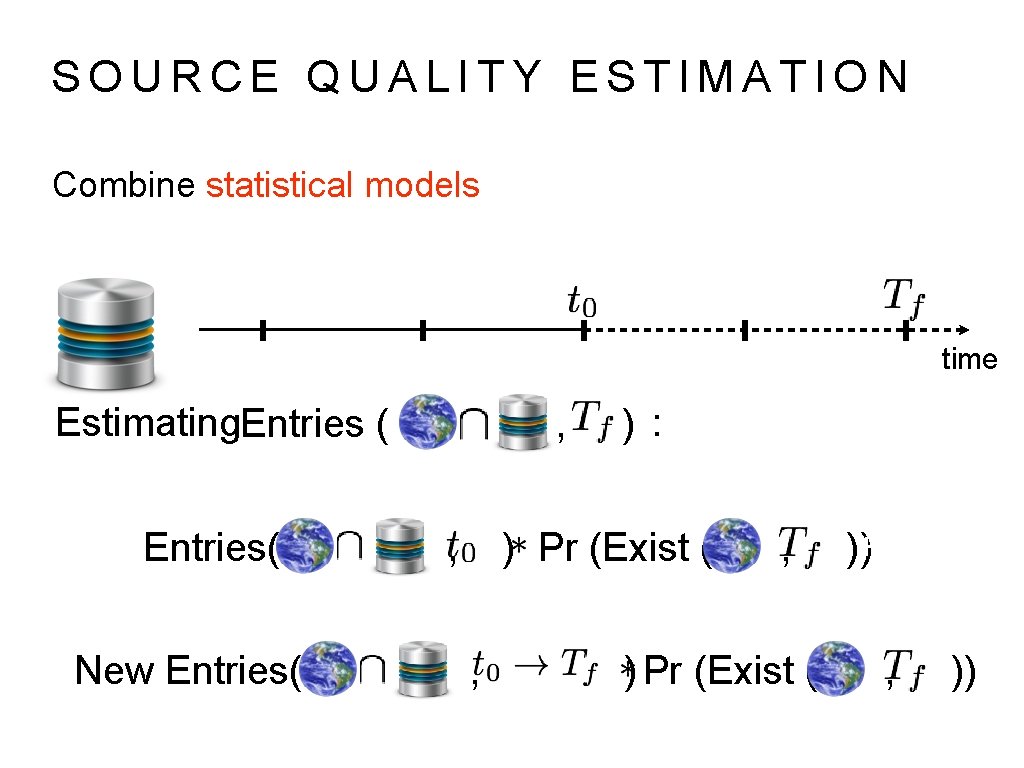
SOURCE QUALITY ESTIMATION Combine statistical models time Estimating. Entries ( Entries( New Entries( , , ) : ) Pr (Exist ( , , ) Pr (Exist ( ))+ , ))
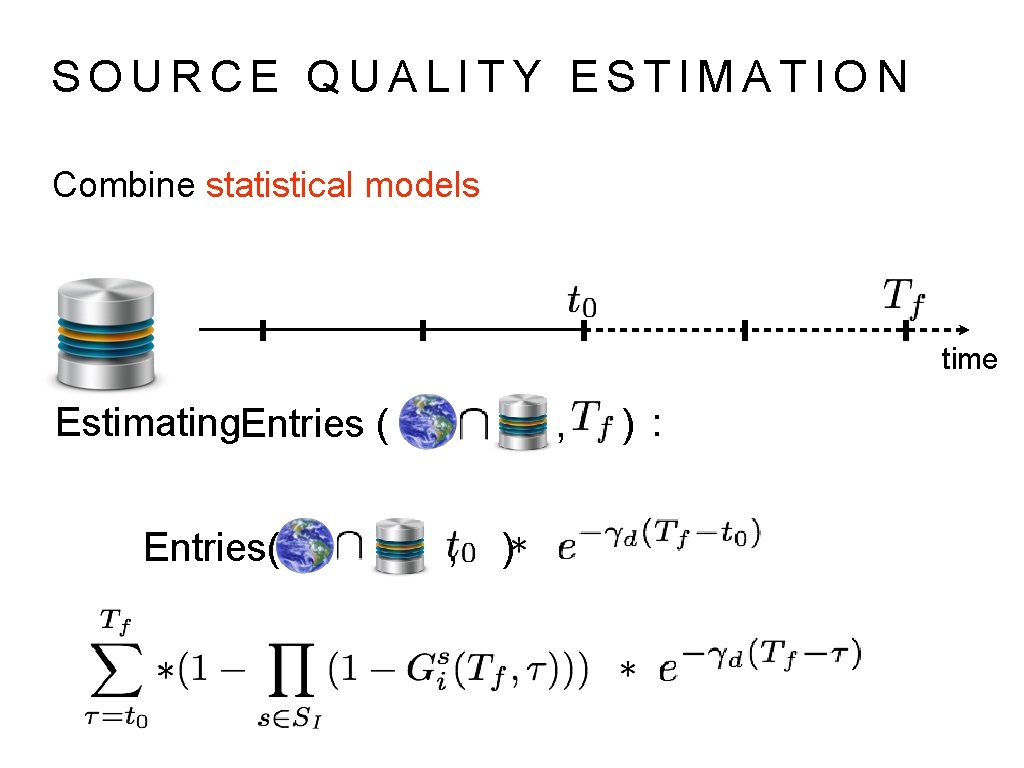
SOURCE QUALITY ESTIMATION Combine statistical models time Estimating. Entries ( Entries( , , ) ) :
PROPOSED FRAMEWORK Pre-processing HISTORICAL SNAPSHOTS OF AVAILABLE SOURCES Statistical Modeling UPDATE MODELS FOR SOURCES EVOLUTION MODELS FOR DATA DOMAIN Source selection USE STATISTICAL MODELS TO ESTIMATE QUALITY OF INTEGRATED DATA INTEGRATION COST MODEL Maximize Quality - Cost Tradeoff SELECT OPTIMAL SUBSET OF SOURCES
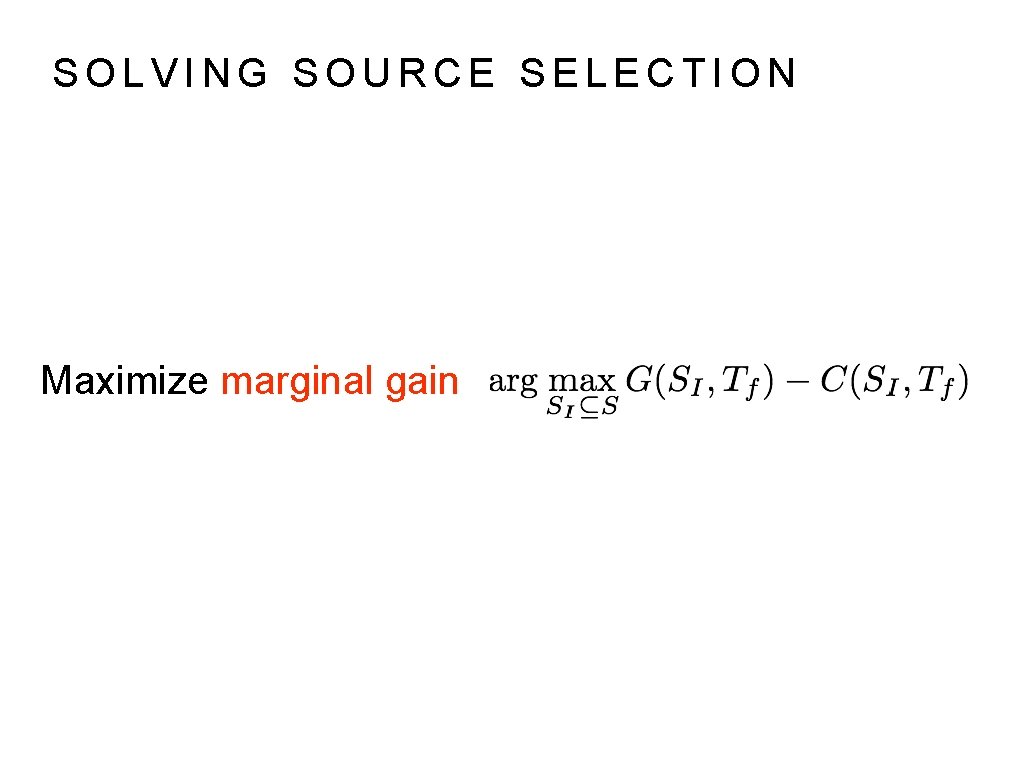
SOLVING SOURCE SELECTION Maximize marginal gain
SOLVING SOURCE SELECTION Greedy Start with an empty solution and add sources greedily Highly efficient No quality guarantees with arbitrarily bad solutions
ARBITRARY OBJECTIVE FUNCTIONS GRASP (k, r) [used in Dong et al. , `13] Local-search and randomized hill-climbing Run r times and keep best solution Empirically high-quality solutions Very expensive
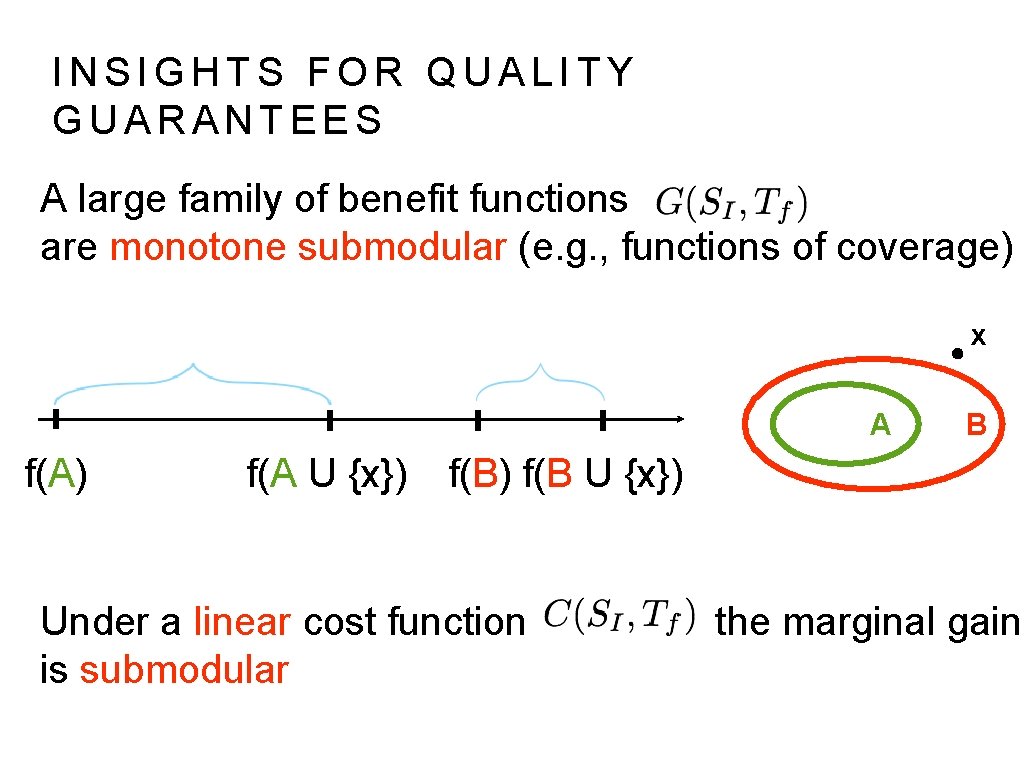
INSIGHTS FOR QUALITY GUARANTEES A large family of benefit functions are monotone submodular (e. g. , functions of coverage) x A f(A) B f(A U {x}) f(B U {x}) Under a linear cost function is submodular the marginal gain
SUBMODULAR OBJECTIVE FUNCTIONS Submodular Maximization (Max. Sub) Start by selecting the best source Explore local neighborhood: add/delete sources Either selected set or complement is a local optimum Highly efficient Constant factor approximation [Feige, `11] Empirically high-quality even for non-sub functions
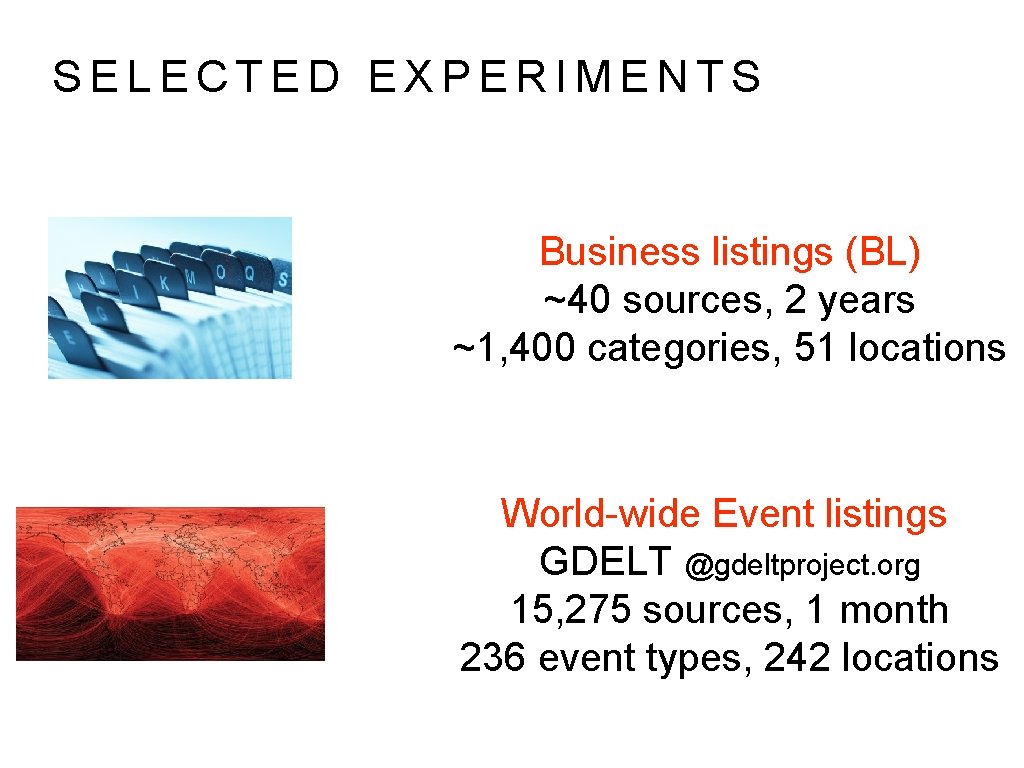
SELECTED EXPERIMENTS Business listings (BL) ~40 sources, 2 years ~1, 400 categories, 51 locations World-wide Event listings GDELT @gdeltproject. org 15, 275 sources, 1 month 236 event types, 242 locations
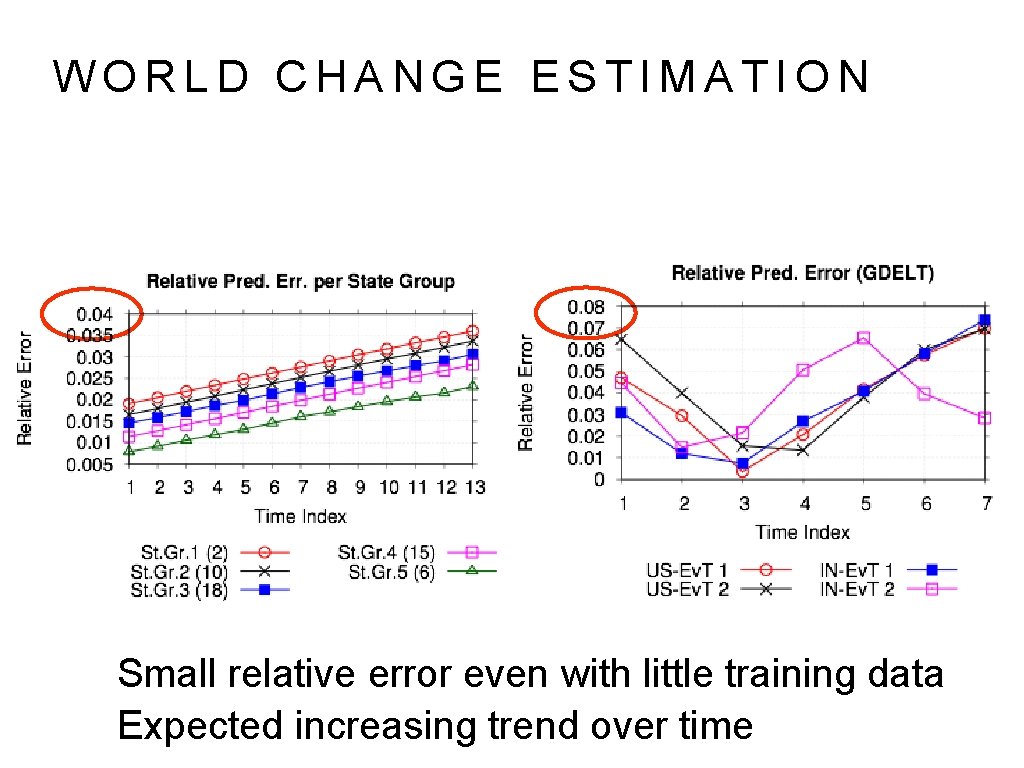
WORLD CHANGE ESTIMATION Small relative error even with little training data Expected increasing trend over time
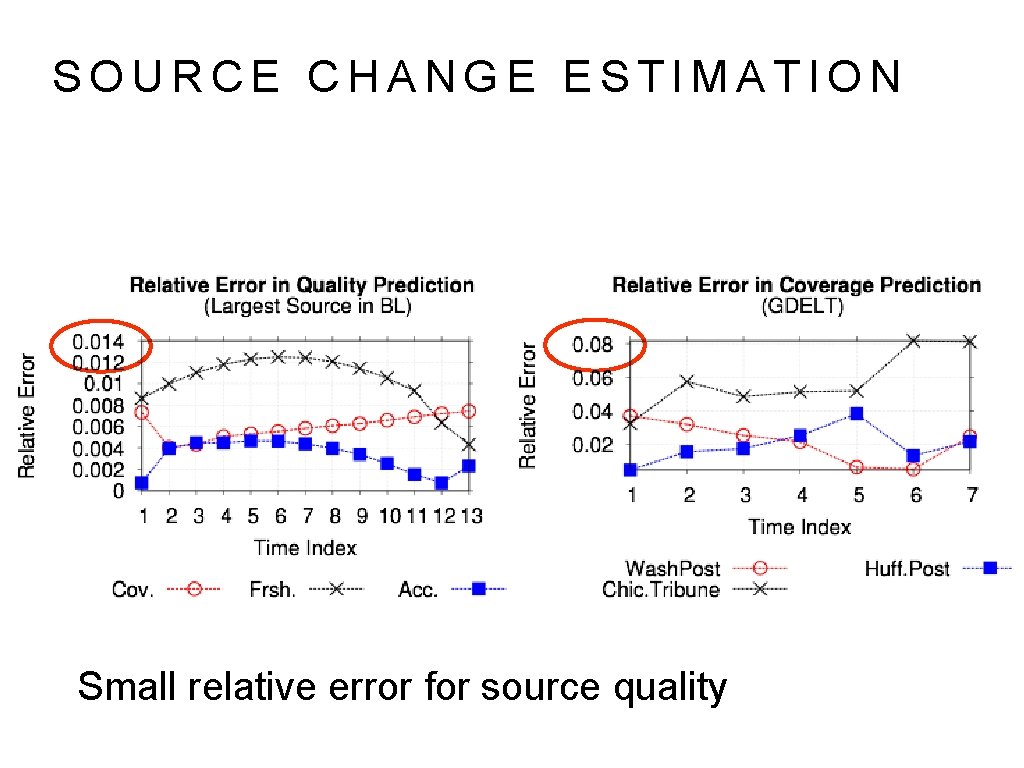
SOURCE CHANGE ESTIMATION Small relative error for source quality
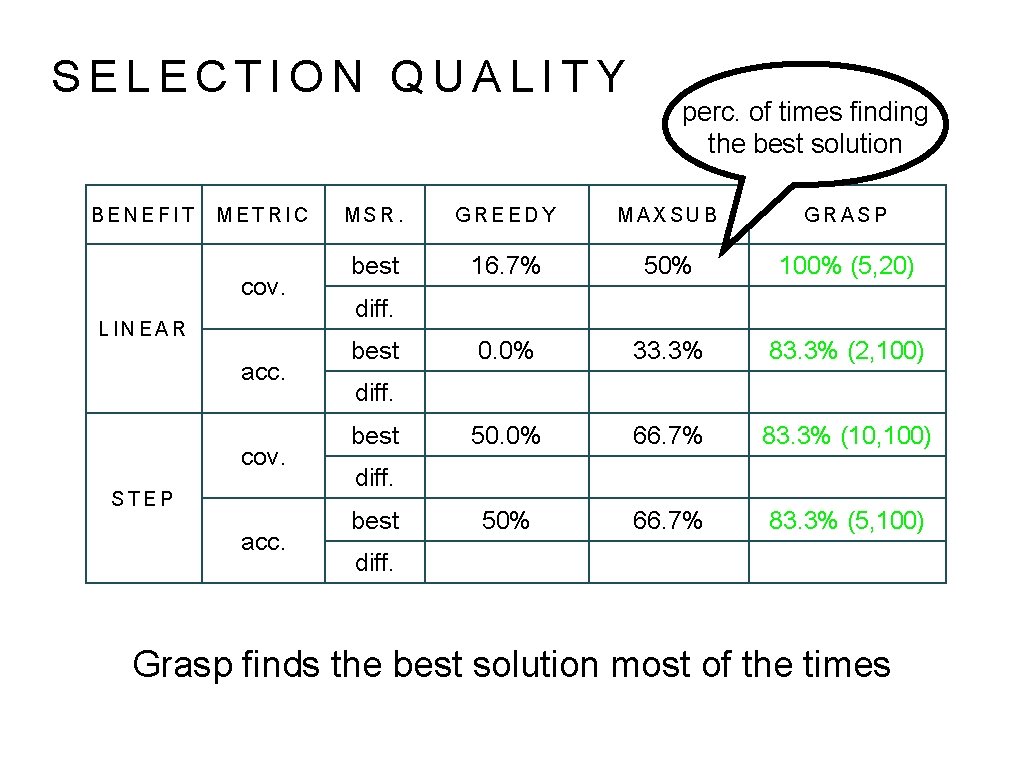
SELECTION QUALITY BENEFIT METRIC cov. LINEAR acc. cov. STEP acc. perc. of times finding the best solution MSR. GREEDY MAXSUB GRASP best 16. 7% 50% 100% (5, 20) 0. 0% 33. 3% 83. 3% (2, 100) 50. 0% 66. 7% 83. 3% (10, 100) 50% 66. 7% 83. 3% (5, 100) diff. best diff. Grasp finds the best solution most of the times
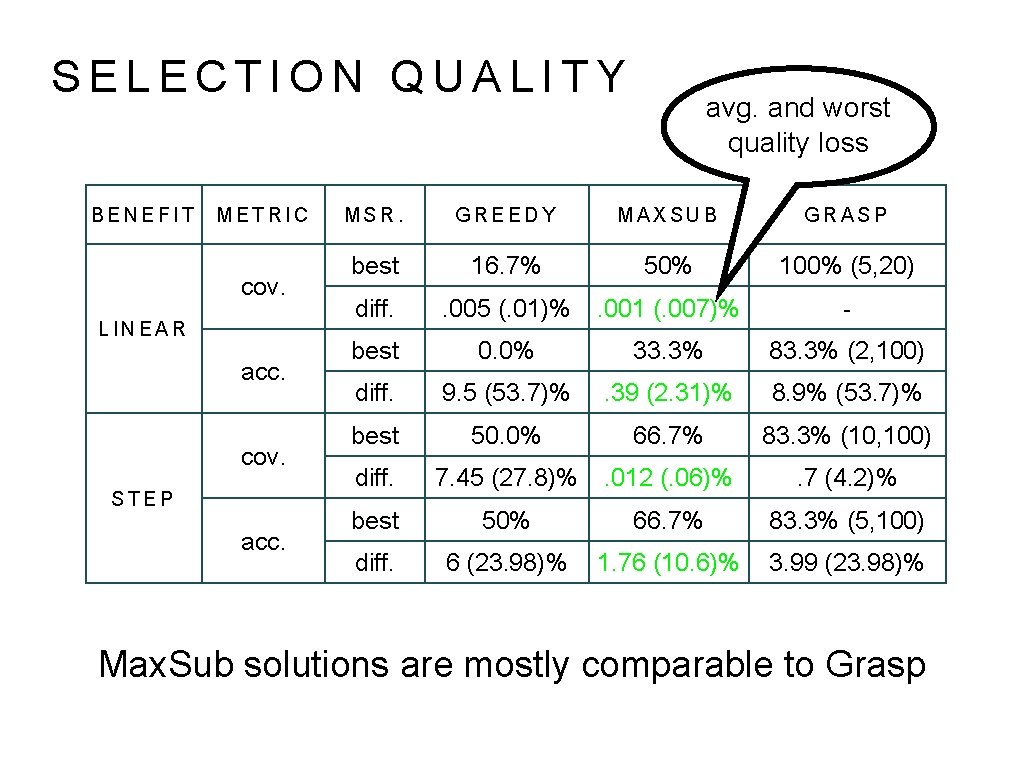
SELECTION QUALITY BENEFIT METRIC cov. LINEAR acc. cov. STEP acc. avg. and worst quality loss MSR. GREEDY MAXSUB GRASP best 16. 7% 50% 100% (5, 20) diff. . 005 (. 01)% . 001 (. 007)% - best 0. 0% 33. 3% 83. 3% (2, 100) diff. 9. 5 (53. 7)% . 39 (2. 31)% 8. 9% (53. 7)% best 50. 0% 66. 7% 83. 3% (10, 100) diff. 7. 45 (27. 8)% . 012 (. 06)% . 7 (4. 2)% best 50% 66. 7% 83. 3% (5, 100) diff. 6 (23. 98)% 1. 76 (10. 6)% 3. 99 (23. 98)% Max. Sub solutions are mostly comparable to Grasp
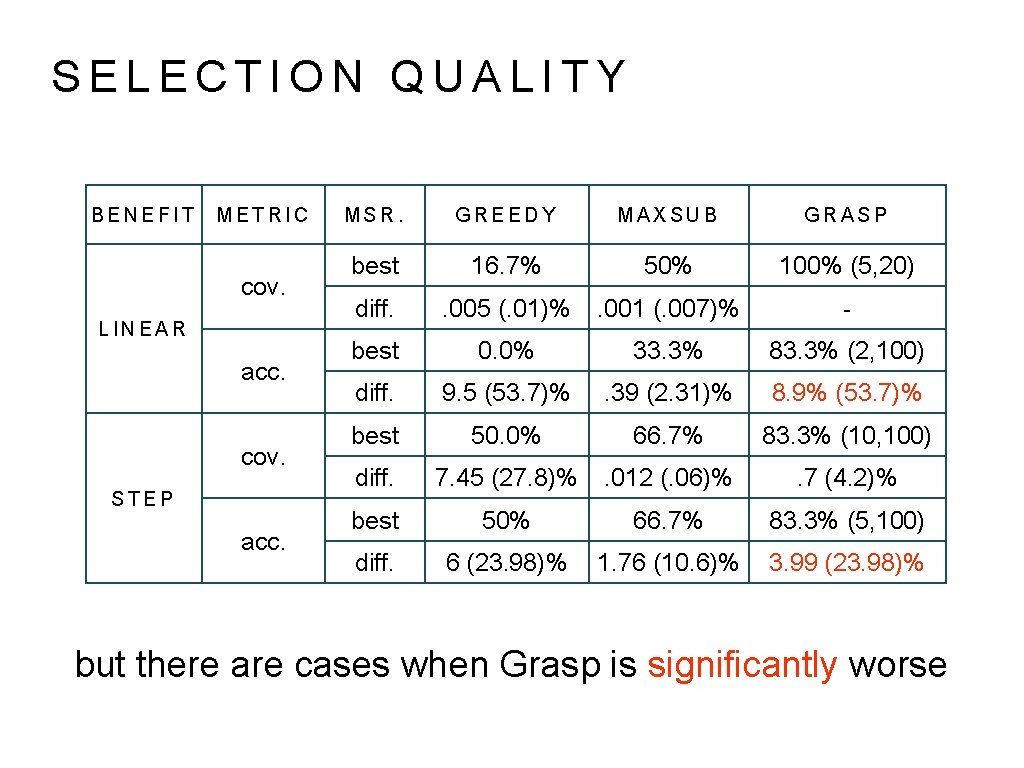
SELECTION QUALITY BENEFIT METRIC cov. LINEAR acc. cov. STEP acc. MSR. GREEDY MAXSUB GRASP best 16. 7% 50% 100% (5, 20) diff. . 005 (. 01)% . 001 (. 007)% - best 0. 0% 33. 3% 83. 3% (2, 100) diff. 9. 5 (53. 7)% . 39 (2. 31)% 8. 9% (53. 7)% best 50. 0% 66. 7% 83. 3% (10, 100) diff. 7. 45 (27. 8)% . 012 (. 06)% . 7 (4. 2)% best 50% 66. 7% 83. 3% (5, 100) diff. 6 (23. 98)% 1. 76 (10. 6)% 3. 99 (23. 98)% but there are cases when Grasp is significantly worse
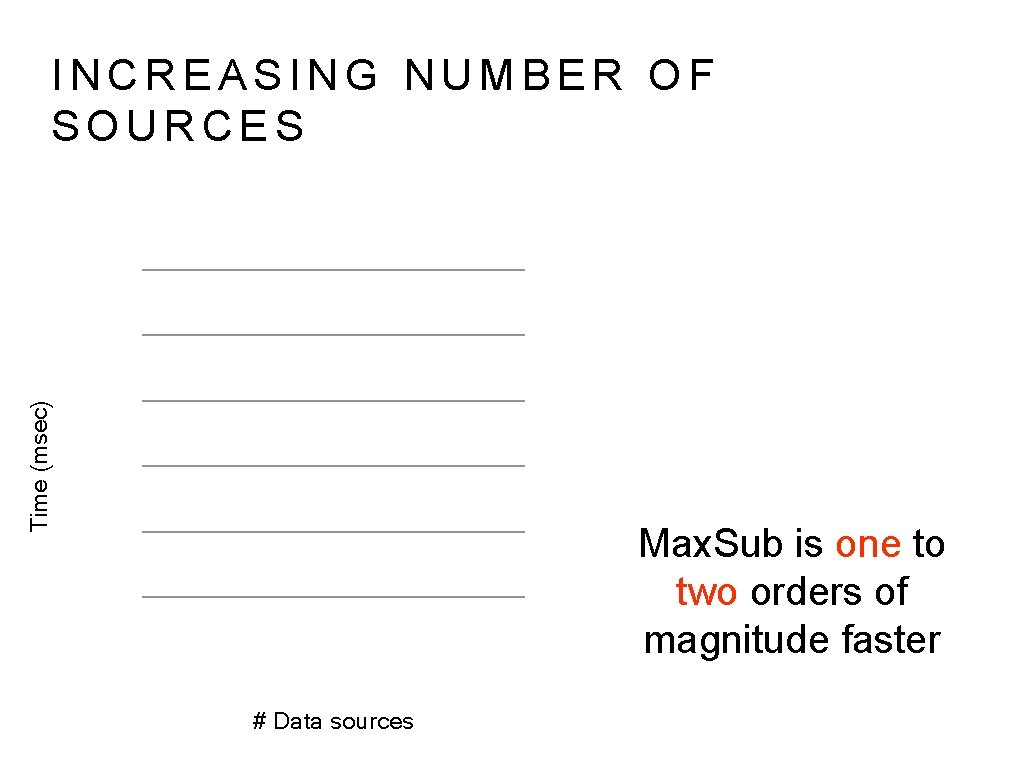
Time (msec) INCREASING NUMBER OF SOURCES Max. Sub is one to two orders of magnitude faster # Data sources
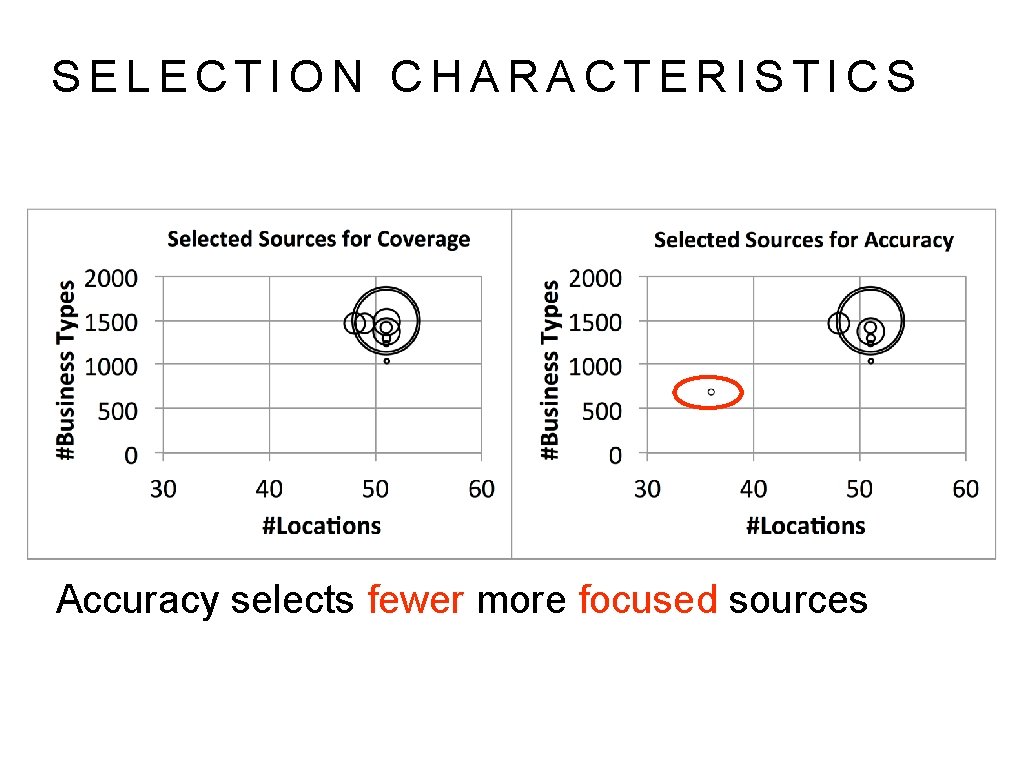
SELECTION CHARACTERISTICS Accuracy selects fewer more focused sources
CONCLUSIONS Source selection before data integration to increase quality and reduce cost Collection of statistical models to describe the evolution of the world and the updates of sources Exploiting submodularity gives more efficient solutions with rigorous guarantees Thank you! thodrek@cs. umd. edu