Characterizing a faultzone and associated fractures using lab

Characterizing a fault-zone and associated fractures using lab experiments and attribute-based seismic analysis: An example from Woodford Shale, Anadarko basin, Oklahoma Zonghu Liao 1* (zonghuliao@ou. edu ), Nabanita Gupta 1, 2, Ze’ev Reches 1, & Kurt Marfurt 1 1 University of Oklahoma, Norman, Oklahoma 2 Current in Shell Oil Company, Houston, Texas 1

Study area In Canadian and Dewey Counties, 350+ horizontal completions have been made in the Woodford shale gas Map Adapted from (Davis, 1988 ) (Gupta, 2012) 2

Motivations: Controlling fault & Fractures Production Prime principle Drill perpendicular to fracture system! Permeability (Gidley et al, 1990) Method: • • • Field observations; Log image analysis of neighbor-wells Seismic analysis based on geology. 3

Time slice cross the Woodford formation Amplitude Positive N A A’ Negative Coherence 1 10, 000 ft Data courtesy of CGG 0 4

Hypothesis: it could be a strike-slip fault Time slice 5

Objectives: – Confirm the structure of strike-slip fault – Characterize the fault and associated fracture system – Suggestions for horizontal well placement Approach: – 1. Clay model experiments as analog for the fault – 2. Geomechanic basis of strike-slip fault – 3. Seismic attribute calculation and analysis – 4. Further analysis and recommendations 6
, Wilcox et al.")
First, Riedel shears appear; 5 cm The analysis/experiments follows Riedel (1929), Wilcox et al. (1973) Naylor et al (1986), and Reches (1988) etc. 7

First, Riedel shears appear; ~17 -20° Then, Splays appear ~45° Also, P shears occur ~160° 5 cm 8 After Naylor et al. 1986; Reches, 1988 et al.

Coherence Amplitude Riedel shears Splay shears Positive Negative Coherence 1 5000 ft 0 5 cm 9

Dip azimuth Amplitude Positive Influenced by a normal fault Compressed folding Negative Dip azimuth 360 5000 ft 240 120 0 10
 Amplitude Positive Fold Depression Negative Curvature Positive 5000 ft 0 Negative")
Curvature (Sterns, 1976) Amplitude Positive Fold Depression Negative Curvature Positive 5000 ft 0 Negative 11

Damage zones C 3 C 2 C 1 Coherence samples normal to the fault 5, 000 ft (Dieterich and Smith, 2009; Powers and Jordan, 2010) Background coherence 12

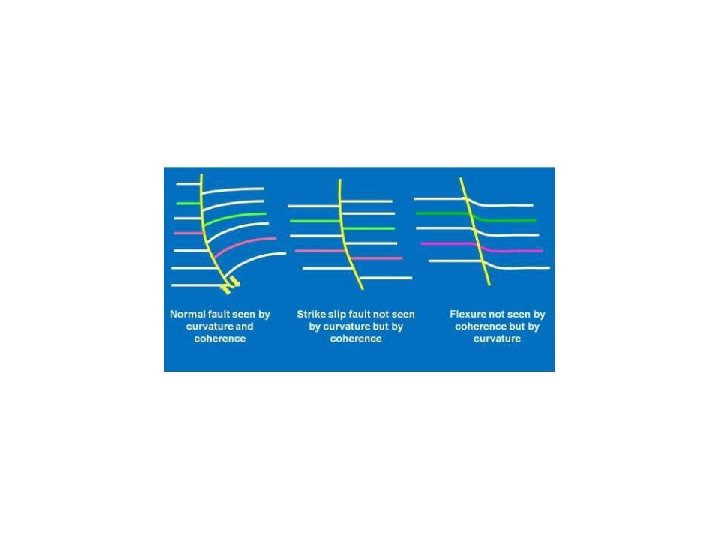
Conclusions and Discussions • The clay experiments suggest a fault pattern at the proximity of a major strike-slip fault in the basement. • The seismic attributes of dip-azimuth, coherence, and curvature (K 1+) could serve as good indicators of strike-slip fault, among which coherence is best to indicate the faults, splay fractures & damage zone; • Compressed fold zones suggested natural fractures for horizontal drilling 13
, Characterization and origin of fracture patterns")
Main references • Arroyal, R. M. P. (2009), Characterization and origin of fracture patterns in the Woodford Shale in southeastern Oklahoma for application to exploration and development, Master Thesis, The University of Oklahoma, Norman, OK. • Busetti, S. (2009), Fracturing in layered reservoir rocks, Ph. D thesis of University of Oklahoma, Norman, OK. • Bradra, H. (2011), Field characterization and analog modeling of natural fractures in the Woodford Sahle, southeast Oklahoma, Thesis of University of Oklahoma, Norman, OK. • Gupta, N. , Marfurt, K. J. (2012), Multi-scale characterization of the Woodford Shale in west-central Oklahoma: From scanning electron microscope to 3 D seismic, Ph. D thesis of University of Oklahoma, Norman, OK. • Marfurt, K. J. , and J. Rich (2010), Beyond curvature – Volumetric estimation of reflector rotation and convergence: 80 th Annual International Meeting of the SEG, Expanded Abstracts, 1467 -1472. • Naylor, M. A. , Mandl, G. , Supesteun, C. H. K. (1986), Fault geometries in basement-induced wrench faulting under different initial stress states, Journal of Structural Geology, (8)7: 737 -752. • Reches, Z. (1983), Faulting of rocks in three-dimensional strain field, II, Theoretical analysis, Tectonophysics, 95: 133 -156. • Reches, Z. (1988), Evolution of fault patterns in clay experiments. Tectonophysics 145. 1, 141 -156. • Slatt. , R. M. , Portas, R. , N. , Buckner, Abousleiman, Y. , O’Borien, N. , M. , Sierra, R. , Philp, P. , Miceli-Romero, A. , Davis, R. , Wawrzyniec, T. (2010) Outcrop/behind outcrop, multi-scale characterization of the Woodford gas shale, Oklahoma: in press. • Staples, E. , K. J. Marfurt, and Z. Reches (2011), Curvature-fracture relations in clay experiments, SEG Expanded Abstract, San Antonio, TX, USA, 1908 -1912. 14

Field observation and measurements Core sample 16 Credit: OGS
 17")
Bernal et al. , (2012) 17

Log image analysis for the natural fracture system • log N Drilling-induced fracture; Longitudinal-induced fractures; Transverse-induced fractures; Natural fractures S 18 Credit: Oklahoma Shale Gas
 N Azimuth: 358. 70 B(1946000, 224000, 6660) E Unit: ft")
T (194580, 225000, 6660) N Azimuth: 358. 70 B(1946000, 224000, 6660) E Unit: ft N 19
 S: surface point; B: bottom point; T:")
N 2 mi S (1946000, 224000, 0) S: surface point; B: bottom point; T: target point; Note: horizontal part BT is not exact in north direction, If you check the coordinates, there is an angle there. 3110 ft shale 1 350 ft sand/shale 2 Staples, 2011 3200 ft shale 3 B (1946000, 224000, 6660) Upper Entry Recommended Lower T(1945800, 225000, 6660) Depth, ft Disclaimer: Depth by interpreting the seismic data; Rock properties were assumed based on references Layer shale 1 Sand/shale 2 Shale 3 Prosity (%) 3 4. 0 -13. 0 3. 2 Density bulk g/cm 3 2. 2 2. 3 2. 42 Density Grain g/m 3 2. 23 2. 35 2. 47 thickness 3110 350 3200 20
 21")
(Davis, 1988 ) 21

Wellbore Profile 5900 Turning Radius = 409 ft Build Up Rate = 14 deg/100 ft Depth of Horizontal Well = 6500 ft 6000 Wellbore Path 6100 Kick Off Point 6091 [ft] 6200 Depth [ft] Bottom of Formation @ 6660 ft 6300 Top of Formation @ 6460 ft 6400 6500 6600 6700 750 650 550 450 350 Horizontal Displacement [ft] 250 150 50 -50
- Slides: 22