Characterization Studies on Metallic Bipolar Plates and Membrane
 for (PEM) Fuel")
Characterization Studies on Metallic Bipolar Plates and Membrane Electrode Assembly (MEA) for (PEM) Fuel Cells by Hazem Tawfik, Ph. D. , P. E. C. Mfg. E Director of the Institute for Research & Technology Transfer SUNY Distinguished Service Professor NHA Annual Conference 2007 Tuesday, 20 March 2007

MOTIVATION • High Oil Cost Threatens our National Economy • Hydrogen Fuel Cells Promised Clean and Efficient Alternative Energy

Agenda – Hydrogen Economy – Hydrogen Fuel Cells – PEM Fuel Cells – Metal Vs Graphite Bipolar Plates – Metal Bipolar Plates – Performance of Metal Bipolar Plates – PEM Fuel Cell Applications – Possible Collaboration Between IRTT and ME

U. S. Energy Dependence is Driven By Transportation Passenger Vehicles US Oil Use for Transportation • Transportation accounts for 2/3 of the 20 million barrels of oil our nation uses each day. • The U. S. imports 55% of its oil, expected to grow to 68% by 2025 under the status quo. • Nearly all of our cars and trucks currently run on either gasoline or diesel fuel.

Hydrogen Economy or Hydrogen Energy System electricity generation water H 2 water transportation residential commercial industry primary energy sources energy carrier energy consuming sectors
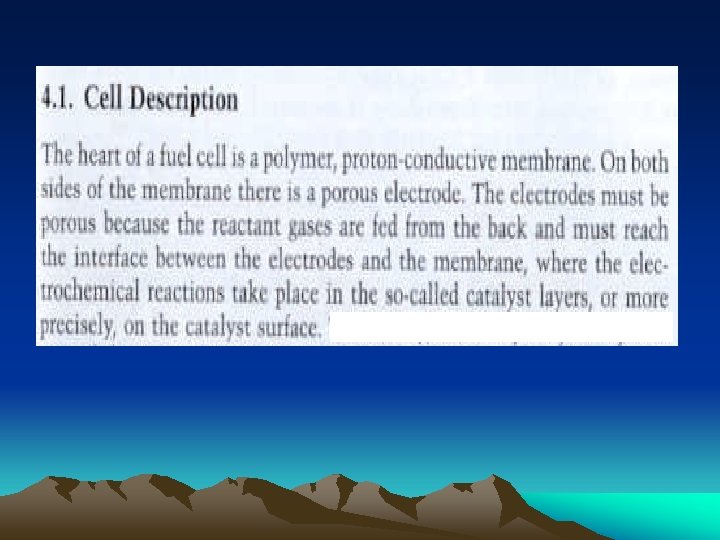
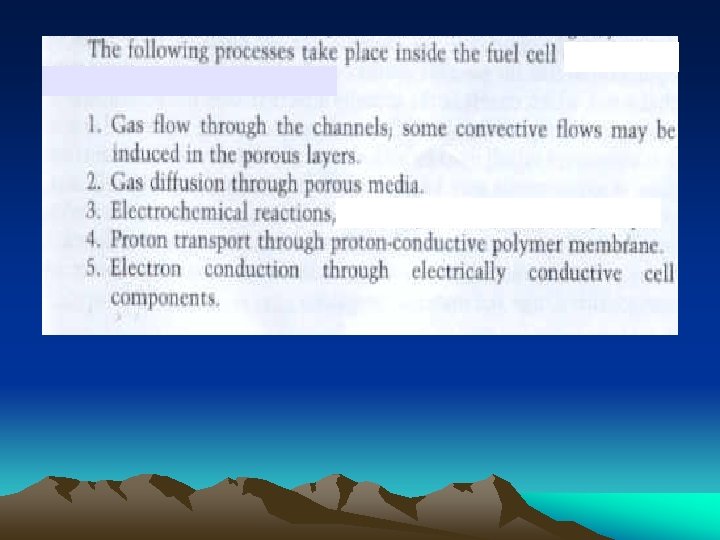
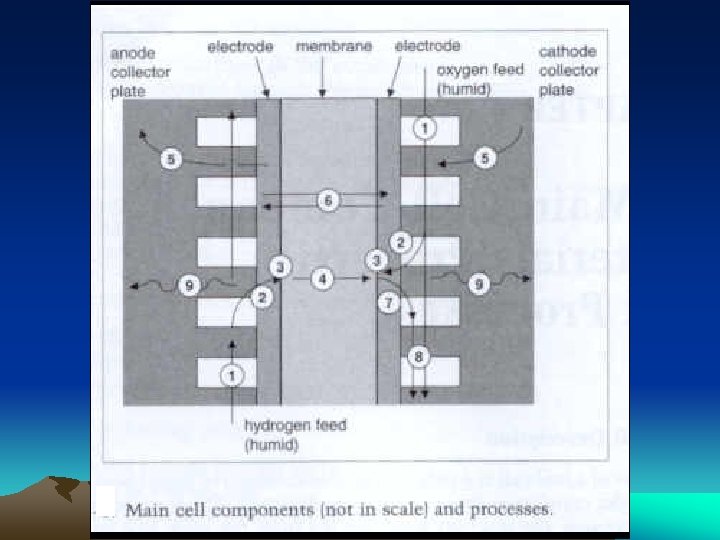

The Bipolar Plate Functions

The Membrane is a high proton conductive – typically made of perfluorocarbon-sulfonic acid ionomer (Nafion)

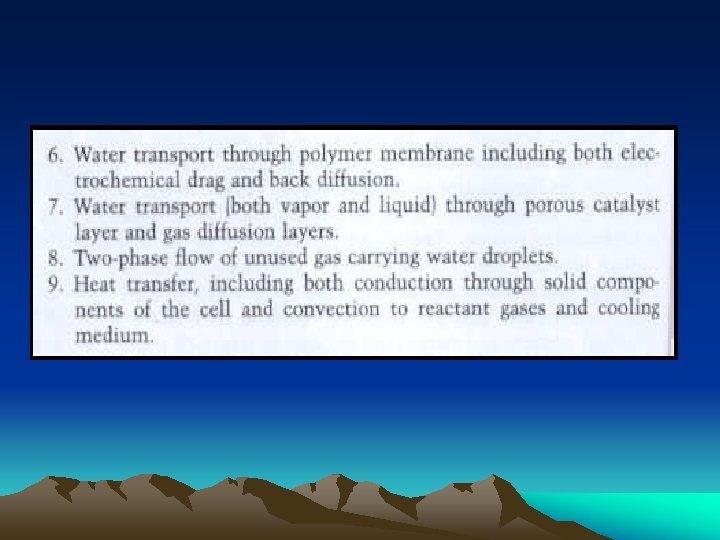
Water Transfer Mechanisms Across the MEA

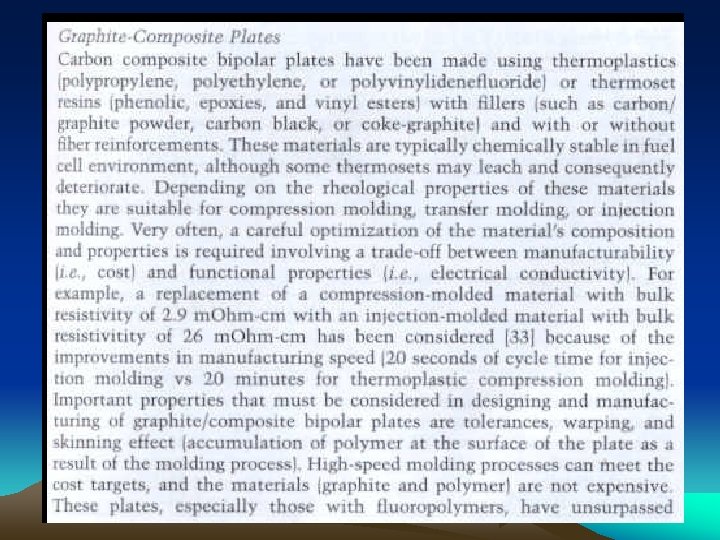
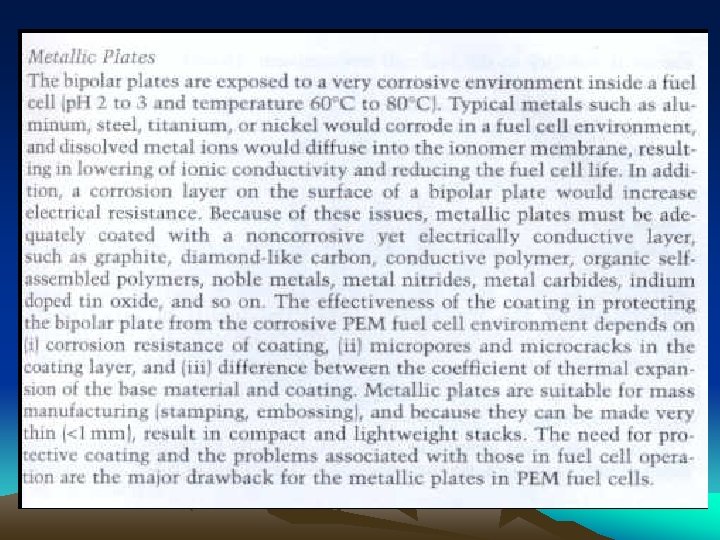
Challenge • Bipolar plates represent the backbone of the PEM fuel Cell and are currently made of graphite or graphite composites that have excellent corrosion resistance but suffer brittleness, permeability to gases, poor manufacturability and lower electric conductivity relative to most metals. • Metallic bipolar plates hold excellent potential for durability and cost effectiveness, but very corrosive in the fuel cell acidic and humid environment that could tarnish the catalyst and poison the electrolyte.

Why Metallic Bipolar Plates • Better mechanical properties than Graphite composites – No brittleness • Higher electrical and thermal conductivities than graphite • Amenable to low cost/high volume manufacturing techniques • Better manufacturability than graphite • Gas impermeable

Brief History of Bipolar Plates’ material • More than thirty years ago, GE used Gold coatings on metal plates –performed better than graphite – delamination problems – very high cost • Graphite and graphite composites – brittle, permeable to gases – poor manufacturability • Oakridge National lab – Nitridation of Stainless steel – low production – very thin layer – expensive • Carbide based alloy coatings on Aluminum and Stainless steel – IRTT /Farmingdale State •

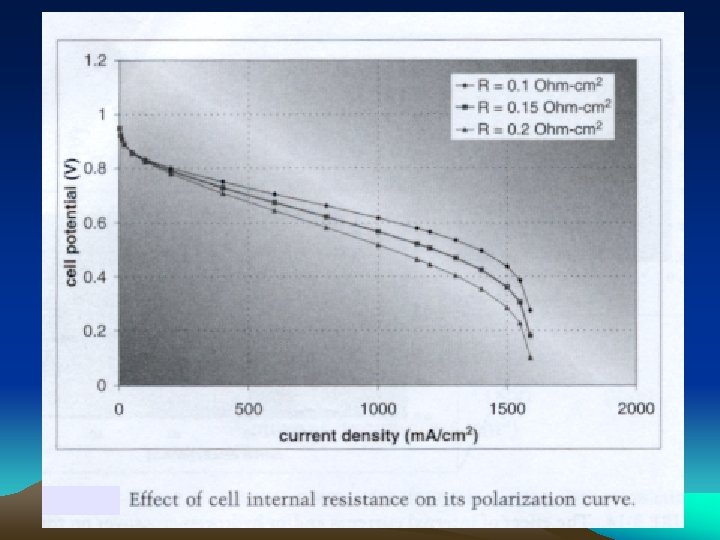
Typical Polarization Curve

Contact Resistance Experimental Setup
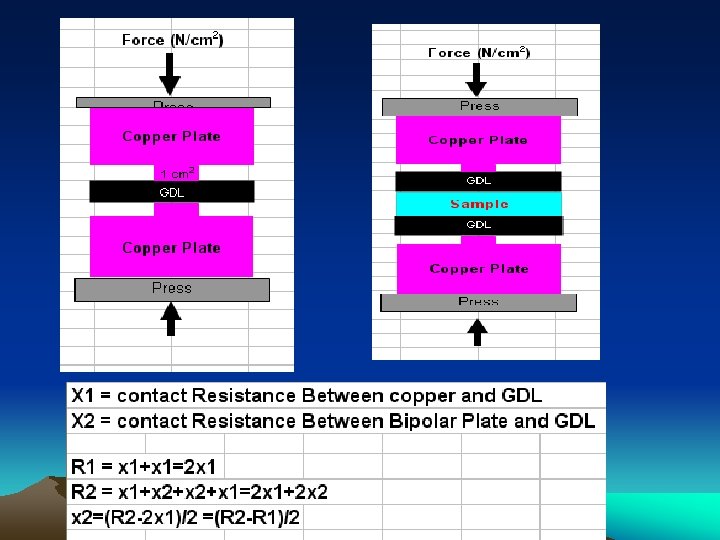

Circuit for Measuring Contact Resistance

Corrosion Measurements Setup

Completed Intensive Corrosion Evaluation Program on Various metals and conductive ceramic alloys

0. 5 M H 2 SO 4+200 ppm HF (@ room temperature

CNC Machining Center

Equipments for flatness measurements

Research procedure to reduce deformation MASK AIR COOLING TUBE

Single Cell Aluminum Bipolar Plates

Single Cell Graphite Bipolar Plates

Hydrogen Safety System For Fuel Cell Testing

Variable Loading Testing M/C

Lifetime Testing of Metallic Bipolar plates vs. Graphite • Metallic bipolar plates real-time testing is being performed under cyclic loading at 70 OC for 1000 hours without power degradation

Polarization and Power Curves for Carbide based coating at Various Operation Hours – Max percentage difference -0. 33

Polarization and Power Curves for graphite Composite Bipolar Plates at Various Operation Hours – Max percentage difference -0. 49

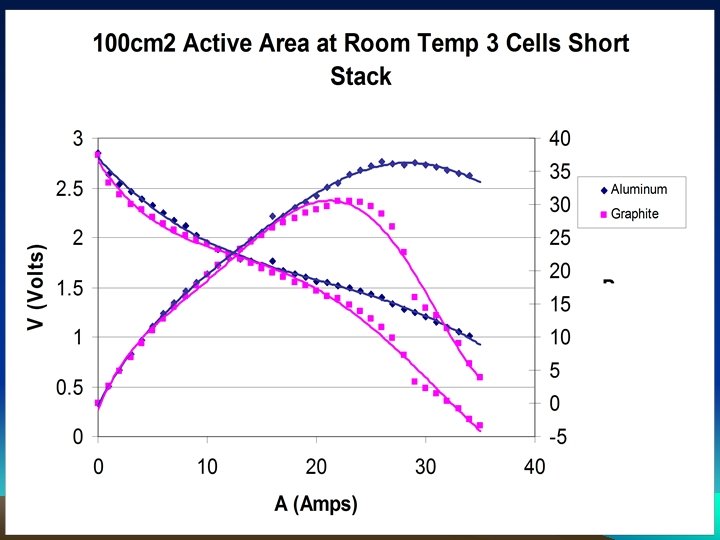
Power Density Curve For Comparison Between Aluminum Coated and Graphite Bipolar Plates

Power Density & Efficiency Curve For Comparison Between Aluminum Coated and Graphite Bipolar Plates

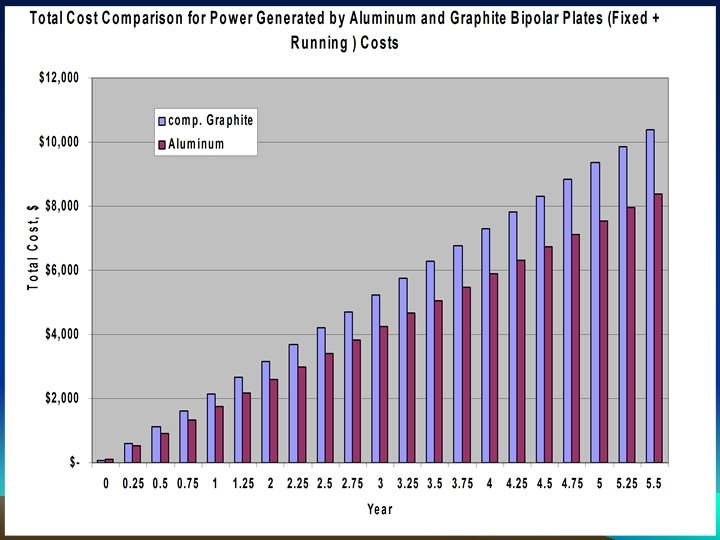
Economics of Metal Vs. Graphite • Relative savings in hydrogen Consumption and efficiency improvement by at least 12% due to higher electric and thermal conductivity of Aluminum vs. graphite bipolar plates at 20 o C.

Polarization and Power Curves - After 30 hours of operation at 70 o C For Comparison Between Aluminum Coated and Graphite Bipolar Plates

Efficiency and Power Curves - After 30 hours of operation at 70 o C

Hydrogen consumption and Power Curves - After 30 hours of operation at 70 o C – Hydrogen Consumption Savings of 24%

IRTT Carbide based Alloy Performed better than graphite in DMFC Comparison of Performance in Graphite and Metallic Plates Using 5% Methanol

Characterization Study • Characterization Studies were Performed on Bipolar plates and the Membrane Electrode Assembly (MEA) samples • Scan Electron Microscope (SEM), measurements were collected from the lands and valleys of the surfaces of the reactant flow conduits at the anode and the cathode. • X-ray Diffraction (XRD) analysis was performed on samples scraped from the anode and cathode electrodes of the MEA used in the metallic bipolar plates • Water as a byproduct produced during the single fuel cells operation were also collected and tested for the existence of chromium, nickel, carbon, iron, sulfur and aluminum using mass spectroscopy.

Thermal Spray Coated Bipolar Plate High Velocity Oxygen Fuel HVOF
 and Electron Dispersive X-ray (EDAX) Analysis")
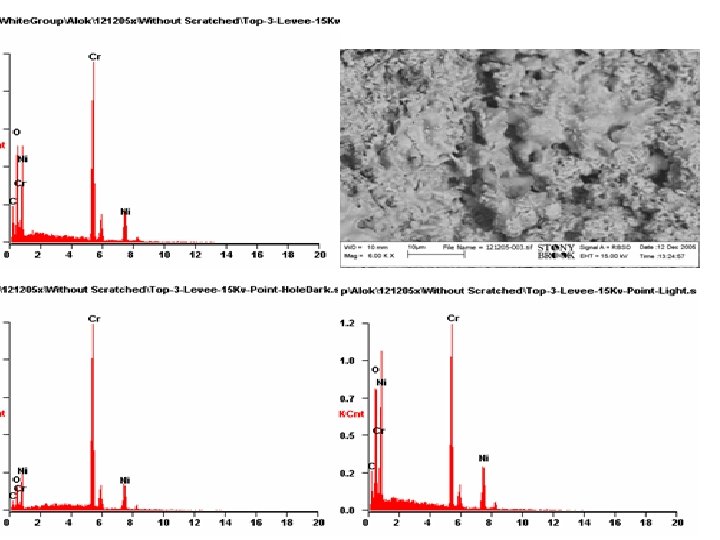
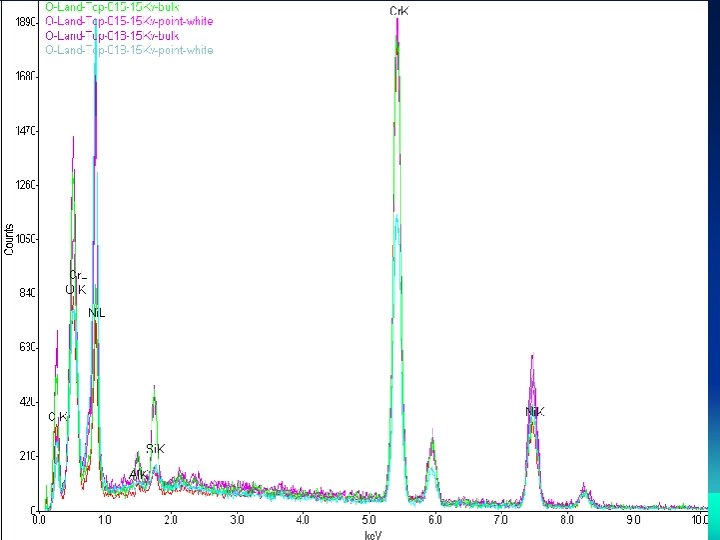
Scanning Electron Microscopy (SEM) and Electron Dispersive X-ray (EDAX) Analysis
 analysis was performed on samples powder scraped from the anode and")
X-ray Diffraction (XRD) analysis was performed on samples powder scraped from the anode and cathode electrodes of a MEA operated for 1000 hrs in metallic bipolar plates fuel cell

Catalyst Clustered

MASS SECTROSCOPY ANALYSIS • Samples are passed into argon plasma and their emission intensity is measured for each element of interest and compared to the calibration curve to yield a concentration of each element in the sample solution. • Al, Cr, Pt, Fe and Ni, are all < 1 ppm each. • Carbon less than 0. 12%
 Clustering effect was observed in the XRD • SEM/EDX showed")
CONCLUSIONS • Catalyst (Pt) Clustering effect was observed in the XRD • SEM/EDX showed no variation in the surface composition after 1000 hrs of operation • Water Analysis also exhibited the Stability of the corrosion resistant coating with no loss of Pt, Al, Fe, Cr and Ni, are all at < 1 ppm each. • Sulfur and carbon need to be checked in the water byproduct of fuel cells
- Slides: 57