
Characterization of Spatial Heterogeneity for Scaling Non Linear

- Slides: 21
Characterization of Spatial Heterogeneity for Scaling Non Linear Processes S. Garrigues 1, D. Allard 2, F. Baret 1. 1 INRA-CSE, Avignon, France 2 INRA-Biométrie, Avignon, France 1
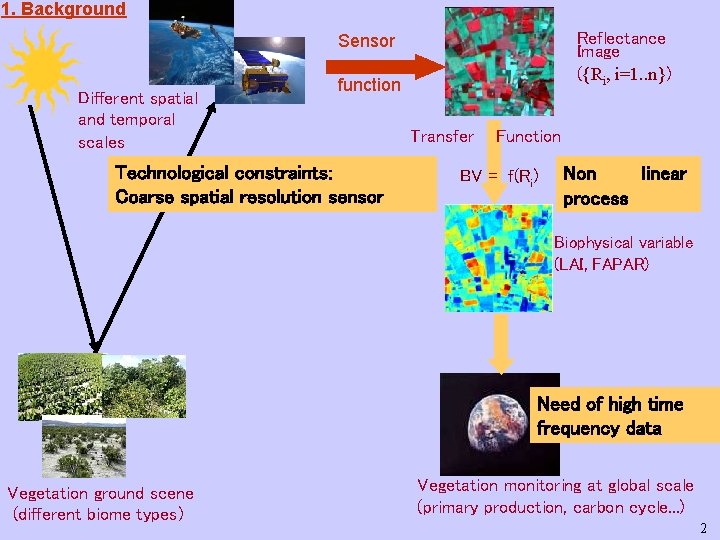
1. Background Reflectance Image ({Ri, i=1. . n}) Sensor Different spatial and temporal scales function Technological constraints: Coarse spatial resolution sensor Transfer Function BV = f(Ri) Non linear process Biophysical variable (LAI, FAPAR) Need of high time frequency data Vegetation ground scene (different biome types) Vegetation monitoring at global scale (primary production, carbon cycle. . . ) 2
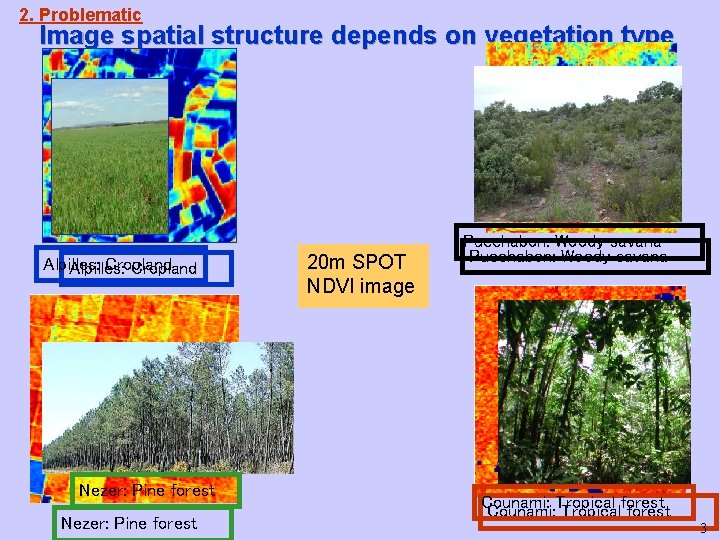
2. Problematic Image spatial structure depends on vegetation type Alpilles: Cropland Nezer: Pine forest 20 m SPOT NDVI image Puechabon: Woody savana Counami: Tropical forest 3
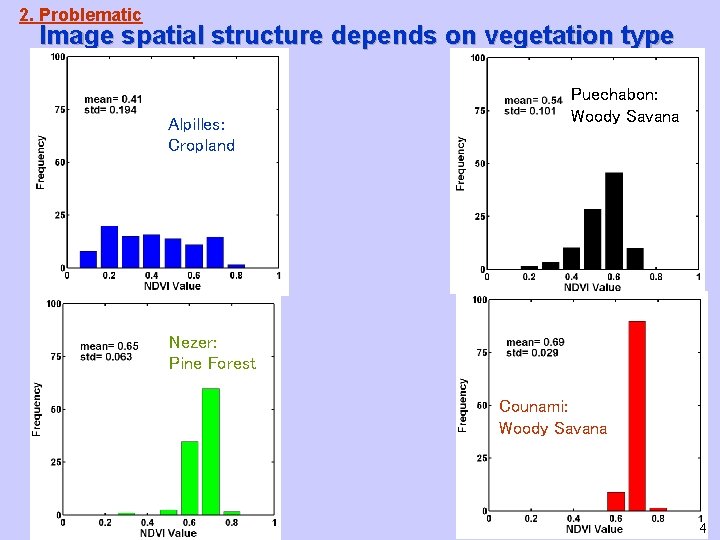
2. Problematic Image spatial structure depends on vegetation type Alpilles: Cropland Puechabon: Woody Savana Nezer: Pine Forest Counami: Woody Savana 4
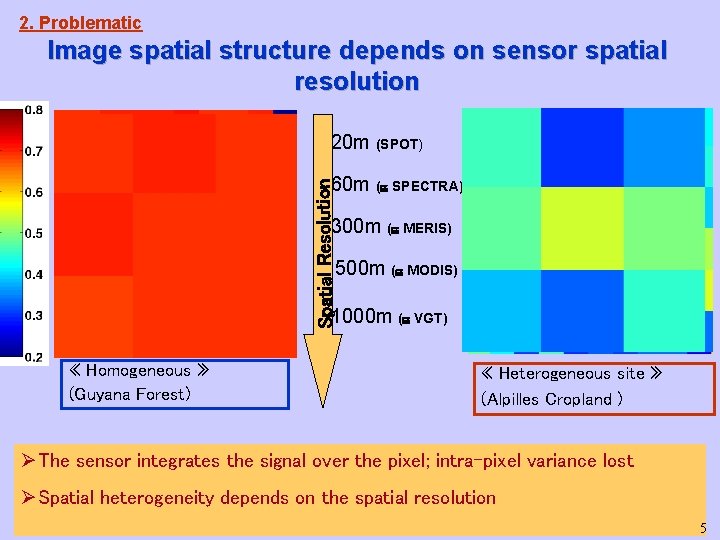
2. Problematic Image spatial structure depends on sensor spatial resolution 20 m (SPOT) Spatial Resolution 60 m ( SPECTRA) 300 m ( MERIS) 500 m ( MODIS) 1000 m ( VGT) « Homogeneous » (Guyana Forest) « Heterogeneous site » (Alpilles Cropland ) ØThe sensor integrates the signal over the pixel; intra-pixel variance lost ØSpatial heterogeneity depends on the spatial resolution 5
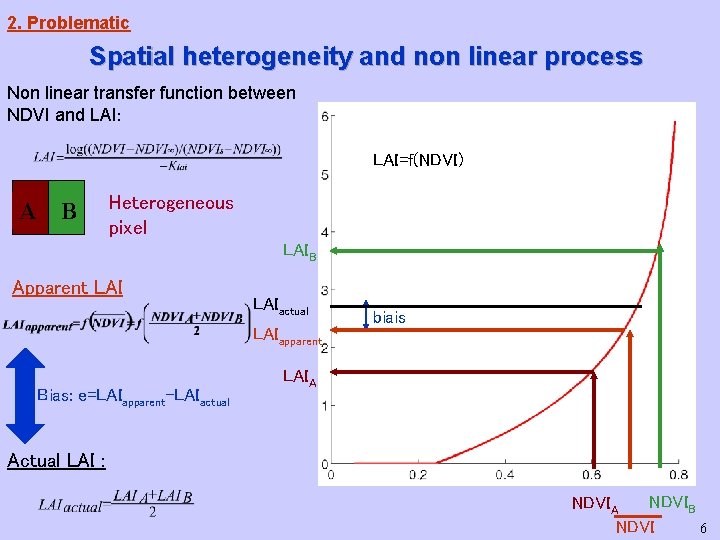
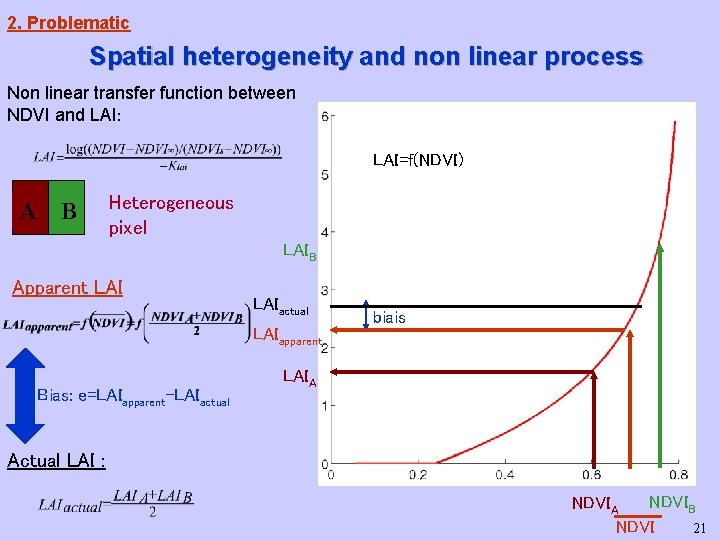
2. Problematic Spatial heterogeneity and non linear process Non linear transfer function between NDVI and LAI: LAI=f(NDVI) A B Heterogeneous pixel LAIB Apparent LAIactual LAIapparent Bias: e=LAIapparent-LAIactual biais LAIA Actual LAI : NDVIB NDVIA 6 NDVI
2. Problematic Ø Spatial structure (i. e. spatial heterogeneity) depends on: - surface property variation - sensor regularization - spatial characteristics: spatial resolution, support geometry (PSF), viewing angle… - spectral characteristic, atmospheric effects - image extent Ø Working scale: the field scale Utilisation of high spatial resolution (SPOT 20 m) to characterize ground spatial structure at field spatial frequency. ØSpatial heterogeneity definition: • quantitative information characterizing the ground spatial structure • spatial variance distribution of the variable considered, within the coarse resolution pixel ØOur aim: using spatial heterogeneity as an a priori information to correct biophysical estimation biais, i. e. to scale up the transfer function at coarser spatial resolution 7
3. Spatial heterogeneity characterization Stochastic framework for image exploitation ØThe image is a realization of a random process (random function model) with the following characteristics: • Ergodicity: one realization of the random process allows to infer the statistical properties of the random function. • Stationarity of the two first moments: - the mean image value is constant over the image - the correlation between two pixel values depends only on the distance between them. ØData support: SPOT pixel considered as punctual - No accounting for SPOT regularization (PSF) - No accounting for SPOT pixel radiometric uncertainties (measurement errors) ØVariable studied : NDVI 8
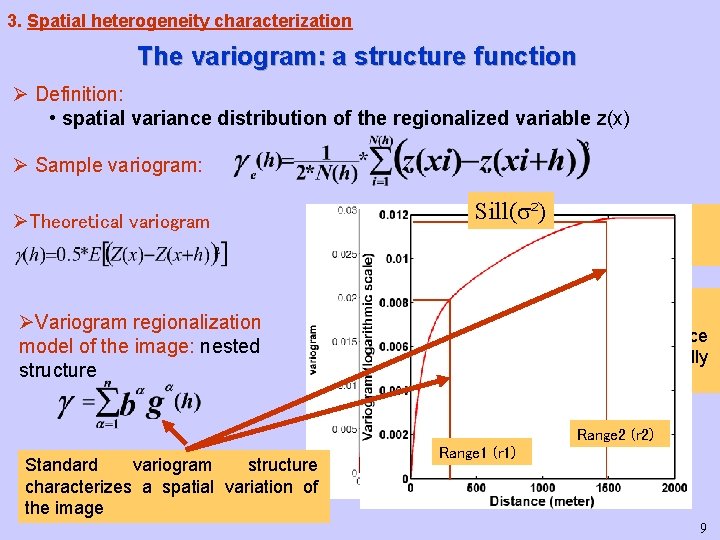
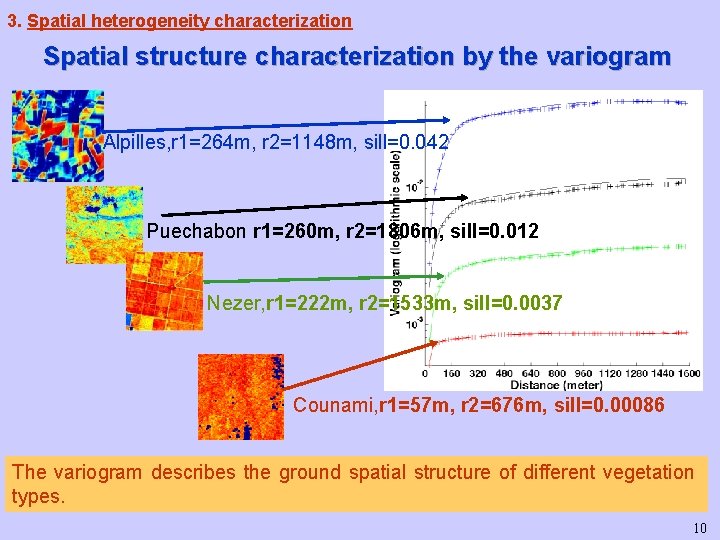
3. Spatial heterogeneity characterization The variogram: a structure function Ø Definition: • spatial variance distribution of the regionalized variable z(x) Ø Sample variogram: ØTheoretical variogram Sill( ²) Sill ( ²) True Variance Range (r) ØVariogram regionalization model of the image: nested structure Up to this distance data are spatially correlated Range 2 (r 2) Standard variogram structure characterizes a spatial variation of the image Range 1 (r 1) 9
3. Spatial heterogeneity characterization Spatial structure characterization by the variogram Alpilles, r 1=264 m, r 2=1148 m, sill=0. 042 Puechabon r 1=260 m, r 2=1806 m, sill=0. 012 Nezer, r 1=222 m, r 2=1533 m, sill=0. 0037 Counami, r 1=57 m, r 2=676 m, sill=0. 00086 The variogram describes the ground spatial structure of different vegetation types. 10
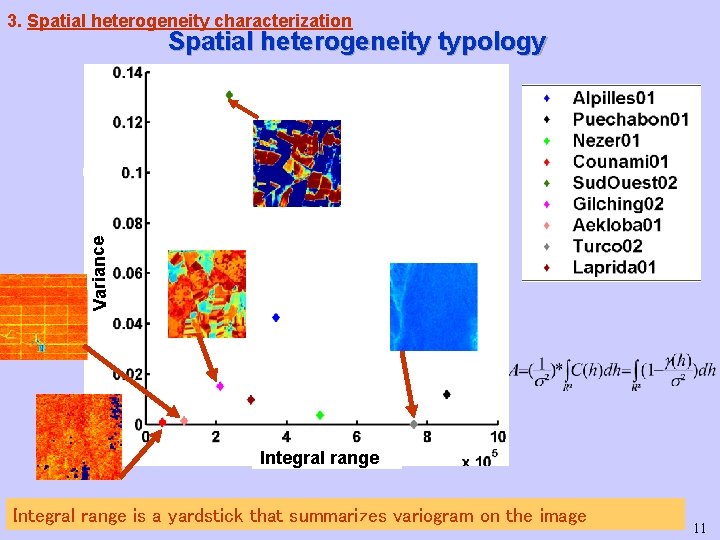
3. Spatial heterogeneity characterization Variance Spatial heterogeneity typology Integral range is a yardstick that summarizes variogram on the image 11
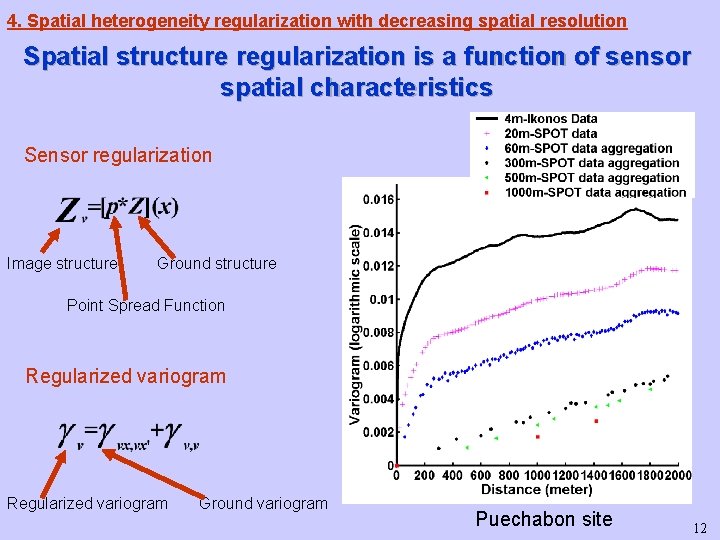
4. Spatial heterogeneity regularization with decreasing spatial resolution Spatial structure regularization is a function of sensor spatial characteristics Sensor regularization Image structure Ground structure Point Spread Function Regularized variogram Ground variogram Puechabon site 12
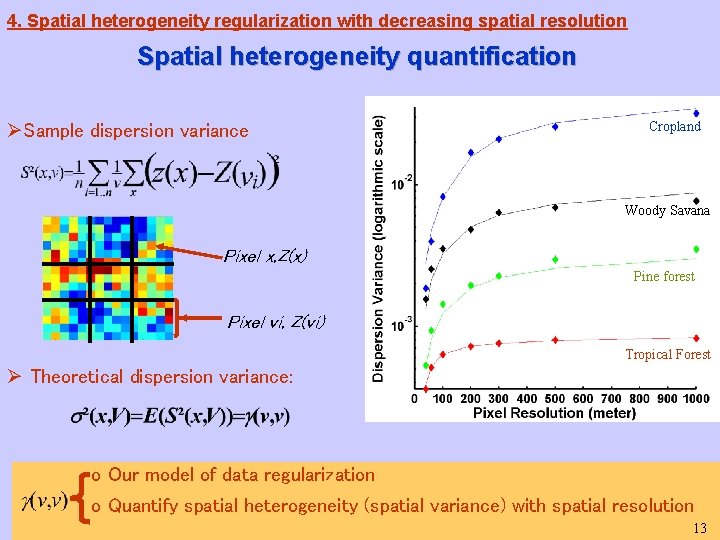
4. Spatial heterogeneity regularization with decreasing spatial resolution Spatial heterogeneity quantification ØSample dispersion variance Cropland Woody Savana Pixel x, Z(x) Pine forest Pixel vi, Z(vi) Tropical Forest Ø Theoretical dispersion variance: o Our model of data regularization o Quantify spatial heterogeneity (spatial variance) with spatial resolution 13
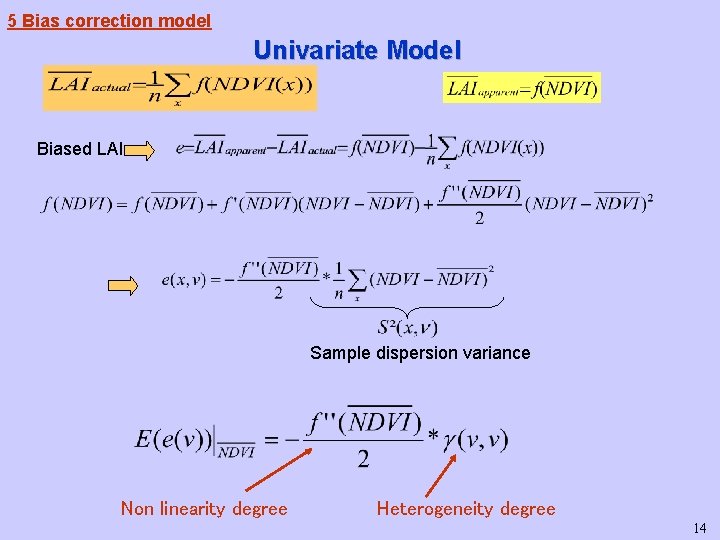
5 Bias correction model Univariate Model Biased LAI Sample dispersion variance Non linearity degree Heterogeneity degree 14
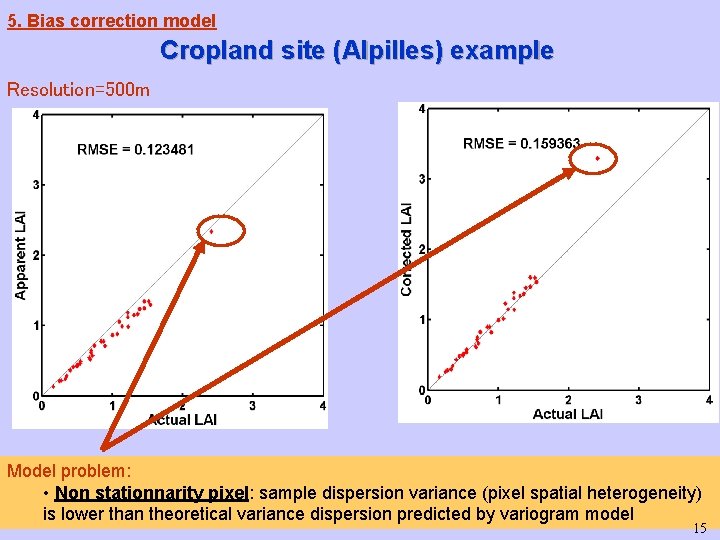
5. Bias correction model Cropland site (Alpilles) example Resolution=500 m Model problem: • Non stationnarity pixel: sample dispersion variance (pixel spatial heterogeneity) is lower than theoretical variance dispersion predicted by variogram model 15
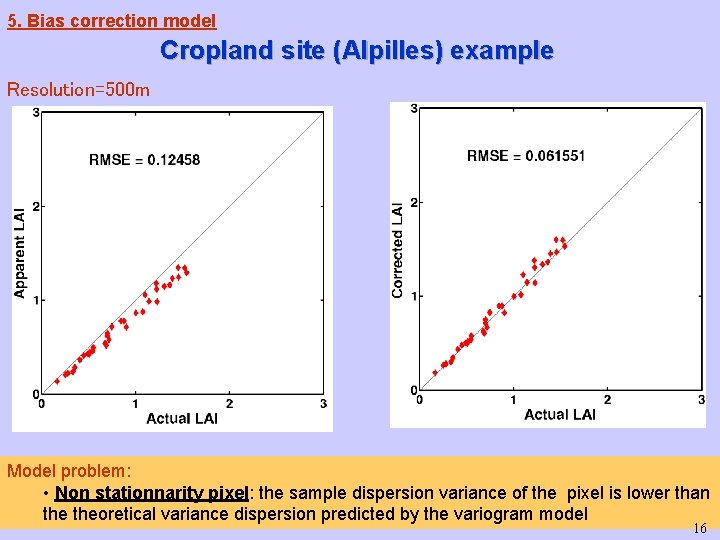
5. Bias correction model Cropland site (Alpilles) example Resolution=500 m Model problem: • Non stationnarity pixel: the sample dispersion variance of the pixel is lower than theoretical variance dispersion predicted by the variogram model 16
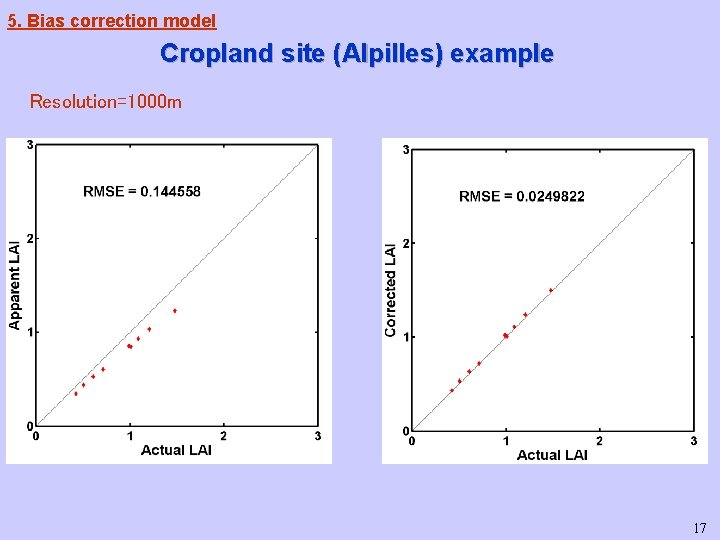
5. Bias correction model Cropland site (Alpilles) example Resolution=1000 m 17
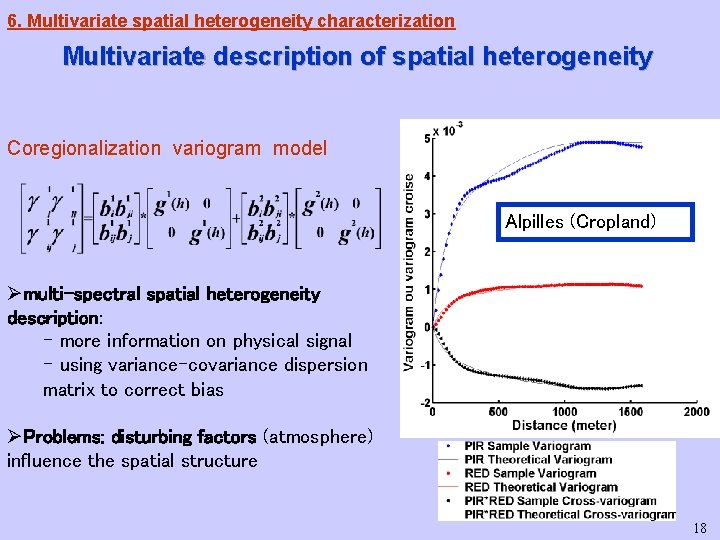
6. Multivariate spatial heterogeneity characterization Multivariate description of spatial heterogeneity Coregionalization variogram model Alpilles (Cropland) Ømulti-spectral spatial heterogeneity description: - more information on physical signal - using variance-covariance dispersion matrix to correct bias ØProblems: disturbing factors (atmosphere) influence the spatial structure 18
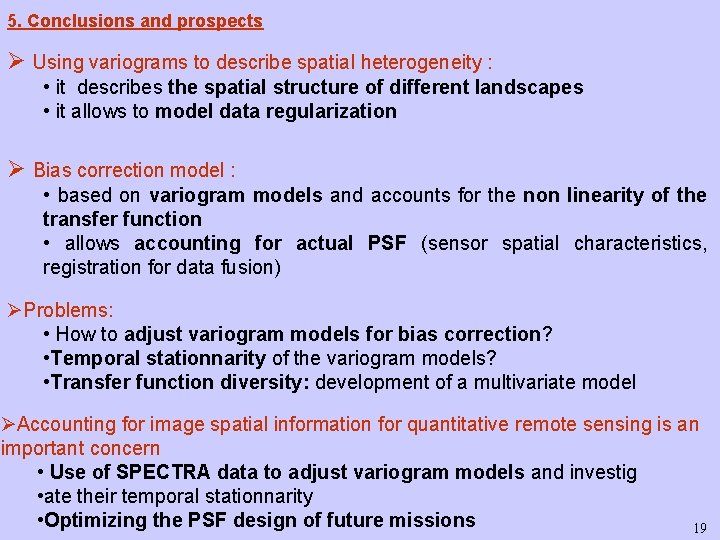
5. Conclusions and prospects Ø Using variograms to describe spatial heterogeneity : • it describes the spatial structure of different landscapes • it allows to model data regularization Ø Bias correction model : • based on variogram models and accounts for the non linearity of the transfer function • allows accounting for actual PSF (sensor spatial characteristics, registration for data fusion) ØProblems: • How to adjust variogram models for bias correction? • Temporal stationnarity of the variogram models? • Transfer function diversity: development of a multivariate model ØAccounting for image spatial information for quantitative remote sensing is an important concern • Use of SPECTRA data to adjust variogram models and investig • ate their temporal stationnarity • Optimizing the PSF design of future missions 19
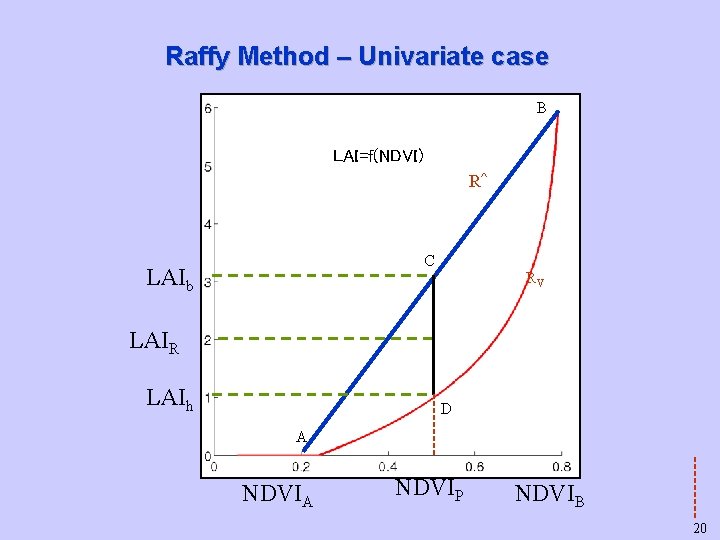
Raffy Method – Univariate case B LAI=f(NDVI) R^ C LAIb RV LAIR LAIh D A NDVIP NDVIB 20
2. Problematic Spatial heterogeneity and non linear process Non linear transfer function between NDVI and LAI: LAI=f(NDVI) A B Heterogeneous pixel LAIB Apparent LAIactual LAIapparent Bias: e=LAIapparent-LAIactual biais LAIA Actual LAI : NDVIB NDVIA 21 NDVI