Characterization of MPI Usage on a Production Supercomputer




- Slides: 46

Characterization of MPI Usage on a Production Supercomputer Sudheer Chunduri, Scott Parker, Pavan Balaji, Kevin Harms, Kalyan Kumaran Argonne National Laboratory www. anl. gov 1

Acknowledgements § This research used resources of the Argonne Leadership Computing Facility, which is a DOE Office of Science User Facility supported under Contract DE-AC 02 -06 CH 11357 § This research was supported by the Exascale Computing Project (17 -SC-20 -SC), a collaborative effort of the U. S. Department of Energy Office of Science and the National Nuclear Security Administration § ANL Darshan Team § ANL Computational Scientists § ALCF Operations Team § Anonymous reviewers 2

Why this study? § MPI is a prominent programming model used for production scientific computing § Around 90% of all the applications run on ANL’s production machine (Mira) use MPI • IBM BG/Q MPI based on ANL MPICH Different applications have different requirements for parallelism and could be using different features of MPI § How scientific computing applications use MPI in production? § § It is imperative to glean into the MPI feature set exploration by production applications To assess how efficiently MPI is being used § Identify areas of concern in terms of performance of MPI features § § Why such a study is not common? Performance overhead with profiling tools § Lack of production quality lightweight profiling tools § § Related: “A survey of MPI usage in the US exascale computing project”, David Bernholdt et al. 3

Motivation § How the insights from this study can be used? § Facility Perspective How important is MPI? o What fraction of the total core-hours is spent in MPI? o If MPI performance is improved by X%, we could save on Y% of resource usage • What is the typical use of MPI in key production codes o Which collectives are crucial in terms of core-hour usage? o Explore site-specific tuning of MPI • § MPI developers “An application perspective feedback to the MPI forum is missing” – Exa. MPI 2018 Panel • Message size distributions or ranges – to explore algorithmic tuning optimizations • § Application users • Feedback to users on how the MPI usage could be improved 4

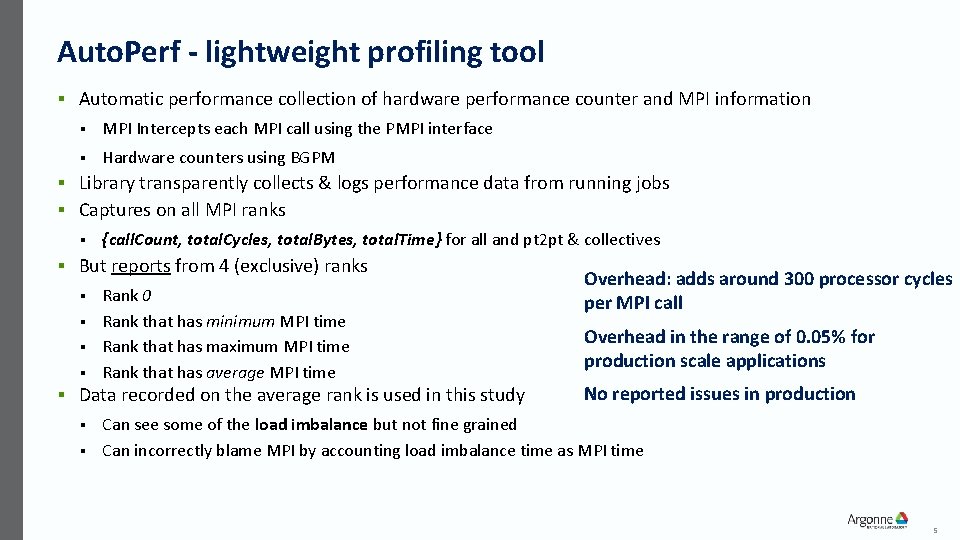
Auto. Perf - lightweight profiling tool § Automatic performance collection of hardware performance counter and MPI information § MPI Intercepts each MPI call using the PMPI interface § Hardware counters using BGPM § Library transparently collects & logs performance data from running jobs § Captures on all MPI ranks § {call. Count, total. Cycles, total. Bytes, total. Time} for all and pt 2 pt & collectives § But reports from 4 (exclusive) ranks Rank 0 § Rank that has minimum MPI time § Rank that has maximum MPI time § Rank that has average MPI time § § Data recorded on the average rank is used in this study Overhead: adds around 300 processor cycles per MPI call Overhead in the range of 0. 05% for production scale applications No reported issues in production Can see some of the load imbalance but not fine grained § Can incorrectly blame MPI by accounting load imbalance time as MPI time § 5

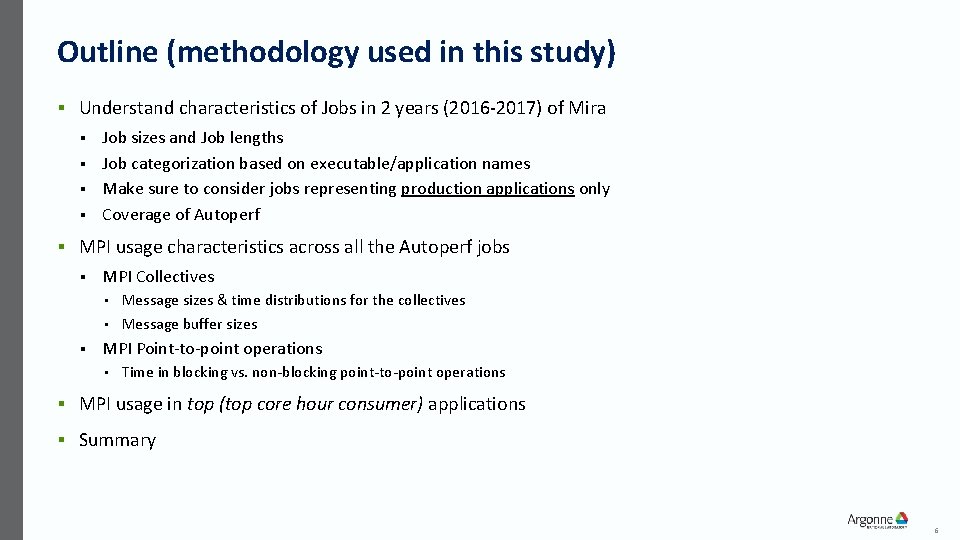
Outline (methodology used in this study) § Understand characteristics of Jobs in 2 years (2016 -2017) of Mira Job sizes and Job lengths § Job categorization based on executable/application names § Make sure to consider jobs representing production applications only § Coverage of Autoperf § § MPI usage characteristics across all the Autoperf jobs § MPI Collectives Message sizes & time distributions for the collectives • Message buffer sizes • § MPI Point-to-point operations • Time in blocking vs. non-blocking point-to-point operations § MPI usage in top (top core hour consumer) applications § Summary 6

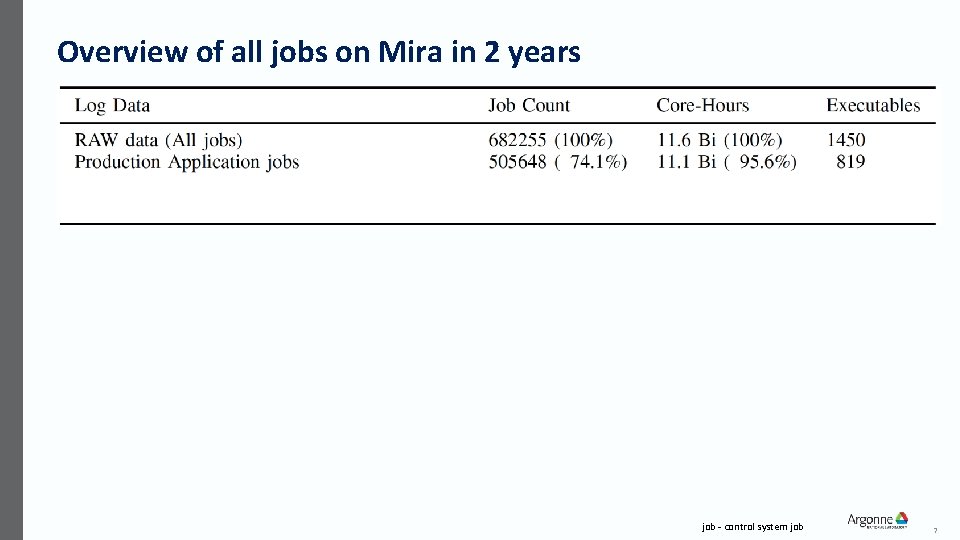
Overview of all jobs on Mira in 2 years job - control system job 7

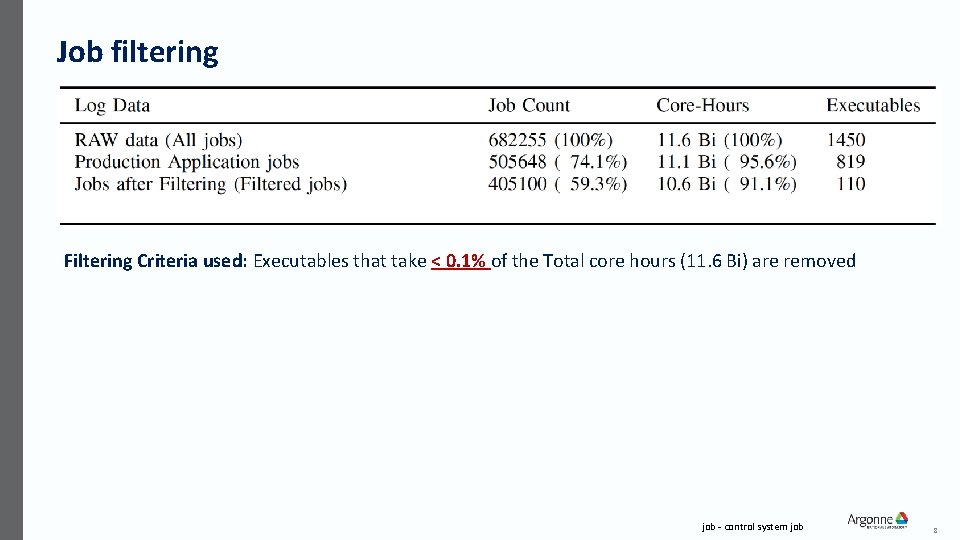
Job filtering Filtering Criteria used: Executables that take < 0. 1% of the Total core hours (11. 6 Bi) are removed job - control system job 8

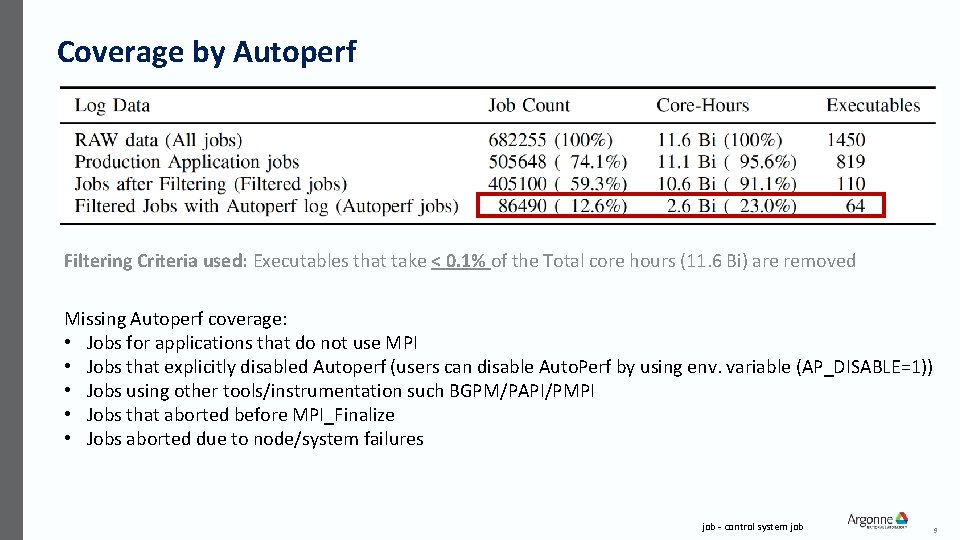
Coverage by Autoperf Filtering Criteria used: Executables that take < 0. 1% of the Total core hours (11. 6 Bi) are removed Missing Autoperf coverage: • Jobs for applications that do not use MPI • Jobs that explicitly disabled Autoperf (users can disable Auto. Perf by using env. variable (AP_DISABLE=1)) • Jobs using other tools/instrumentation such BGPM/PAPI/PMPI • Jobs that aborted before MPI_Finalize • Jobs aborted due to node/system failures job - control system job 9

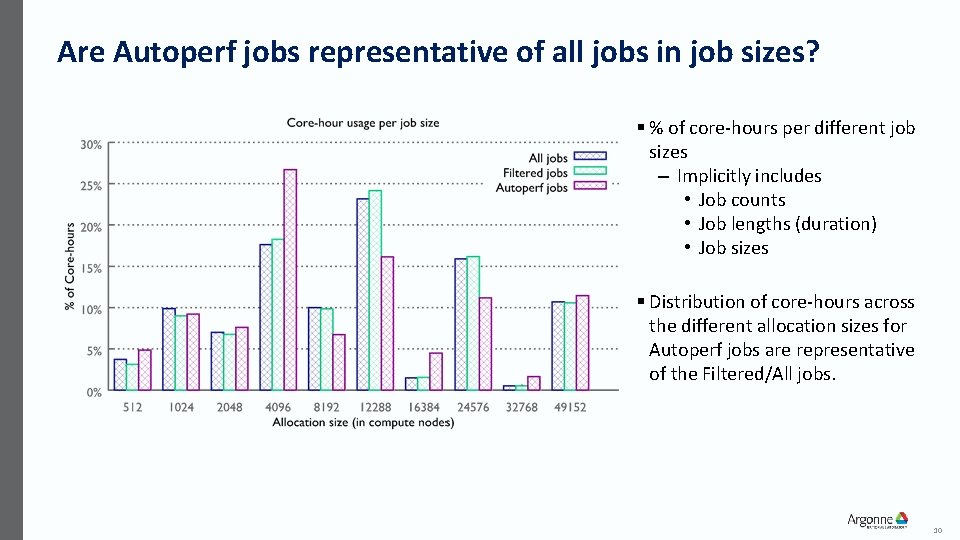
Are Autoperf jobs representative of all jobs in job sizes? § % of core-hours per different job sizes – Implicitly includes • Job counts • Job lengths (duration) • Job sizes § Distribution of core-hours across the different allocation sizes for Autoperf jobs are representative of the Filtered/All jobs. 10

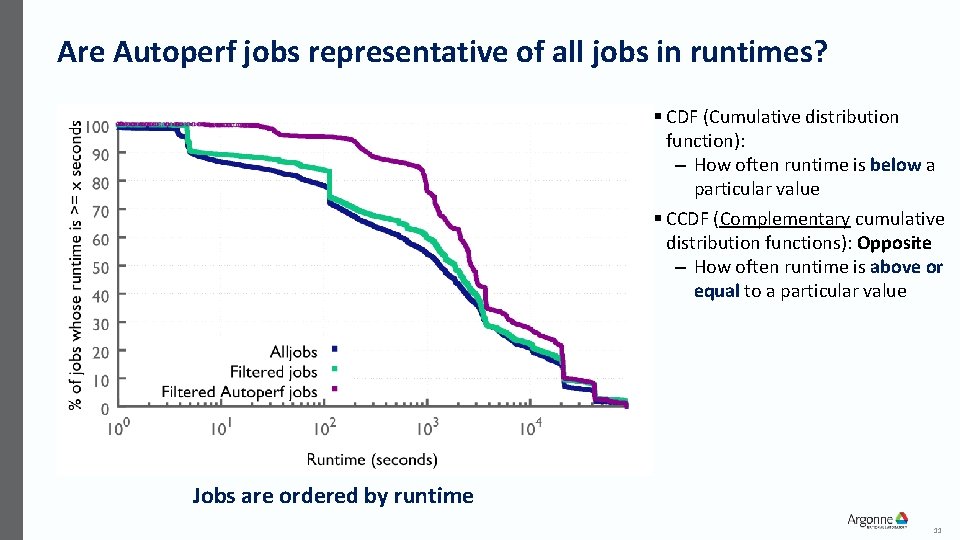
Are Autoperf jobs representative of all jobs in runtimes? § CDF (Cumulative distribution function): – How often runtime is below a particular value § CCDF (Complementary cumulative distribution functions): Opposite – How often runtime is above or equal to a particular value Jobs are ordered by runtime 11

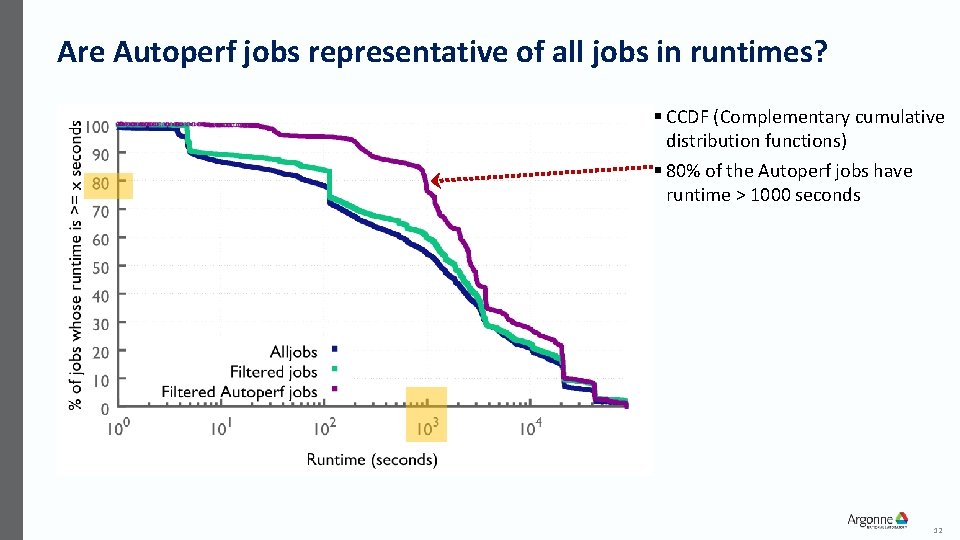
Are Autoperf jobs representative of all jobs in runtimes? § CCDF (Complementary cumulative distribution functions) § 80% of the Autoperf jobs have runtime > 1000 seconds 12

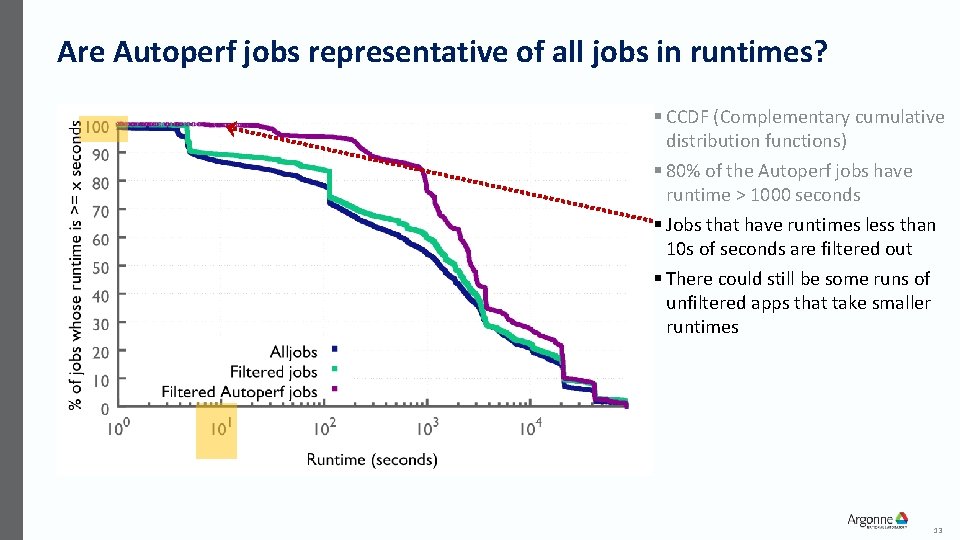
Are Autoperf jobs representative of all jobs in runtimes? § CCDF (Complementary cumulative distribution functions) § 80% of the Autoperf jobs have runtime > 1000 seconds § Jobs that have runtimes less than 10 s of seconds are filtered out § There could still be some runs of unfiltered apps that take smaller runtimes 13

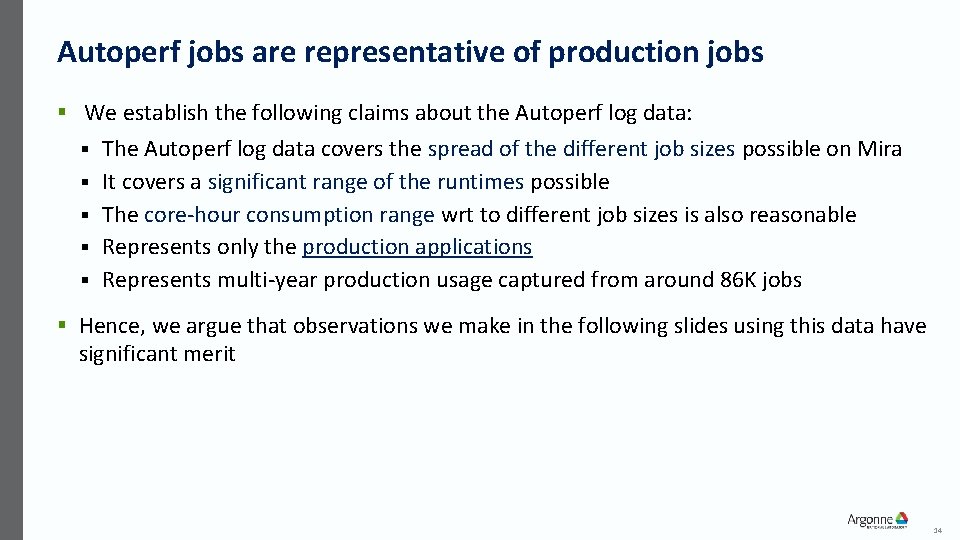
Autoperf jobs are representative of production jobs § We establish the following claims about the Autoperf log data: § § § The Autoperf log data covers the spread of the different job sizes possible on Mira It covers a significant range of the runtimes possible The core-hour consumption range wrt to different job sizes is also reasonable Represents only the production applications Represents multi-year production usage captured from around 86 K jobs § Hence, we argue that observations we make in the following slides using this data have significant merit 14

Global MPI usage patterns across all (Autoperf) Jobs 15

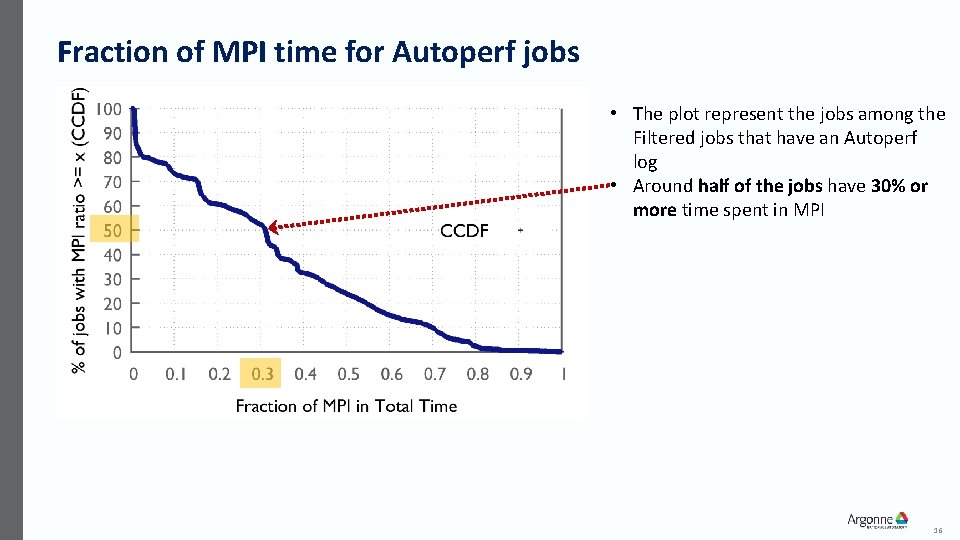
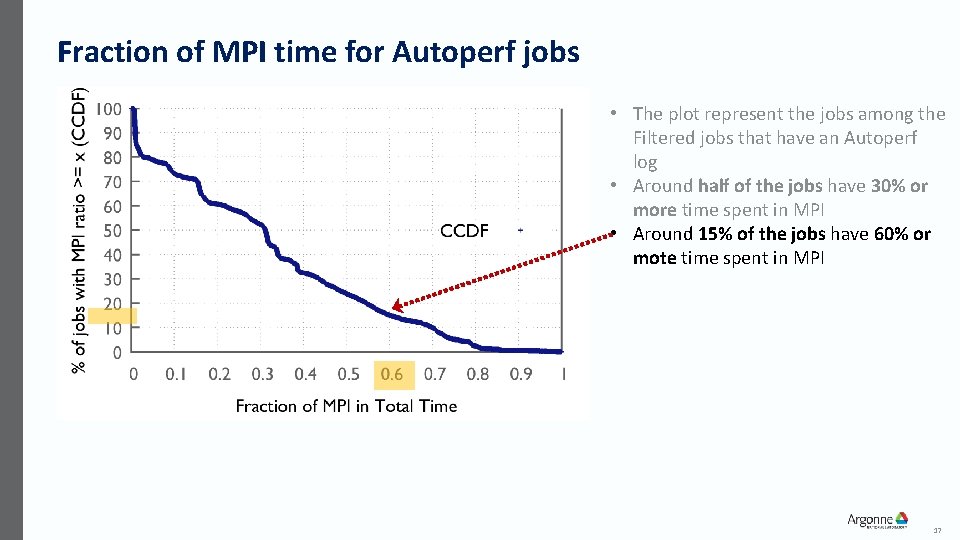
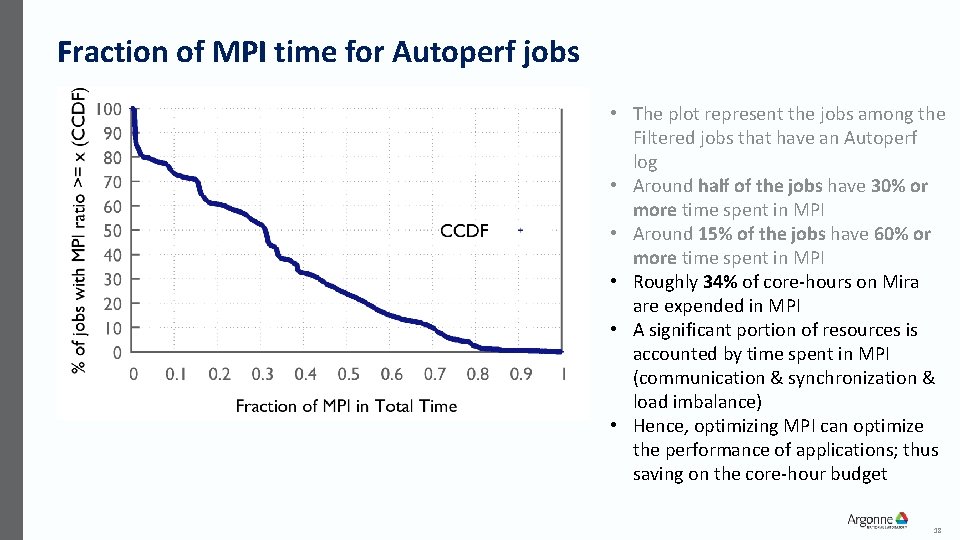
Fraction of MPI time for Autoperf jobs • The plot represent the jobs among the Filtered jobs that have an Autoperf log • Around half of the jobs have 30% or more time spent in MPI 16

Fraction of MPI time for Autoperf jobs • The plot represent the jobs among the Filtered jobs that have an Autoperf log • Around half of the jobs have 30% or more time spent in MPI • Around 15% of the jobs have 60% or mote time spent in MPI 17

Fraction of MPI time for Autoperf jobs • The plot represent the jobs among the Filtered jobs that have an Autoperf log • Around half of the jobs have 30% or more time spent in MPI • Around 15% of the jobs have 60% or more time spent in MPI • Roughly 34% of core-hours on Mira are expended in MPI • A significant portion of resources is accounted by time spent in MPI (communication & synchronization & load imbalance) • Hence, optimizing MPI can optimize the performance of applications; thus saving on the core-hour budget 18

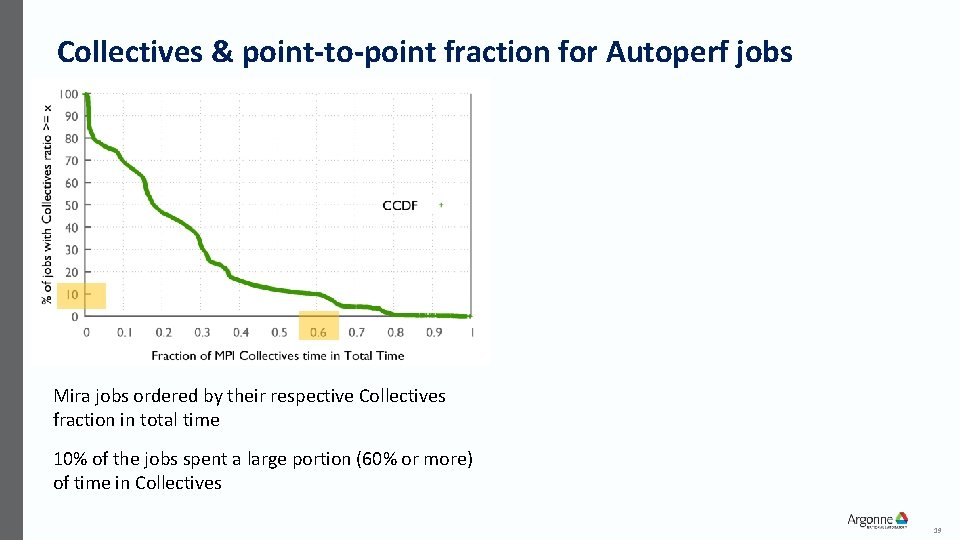
Collectives & point-to-point fraction for Autoperf jobs Mira jobs ordered by their respective Collectives fraction in total time 10% of the jobs spent a large portion (60% or more) of time in Collectives 19

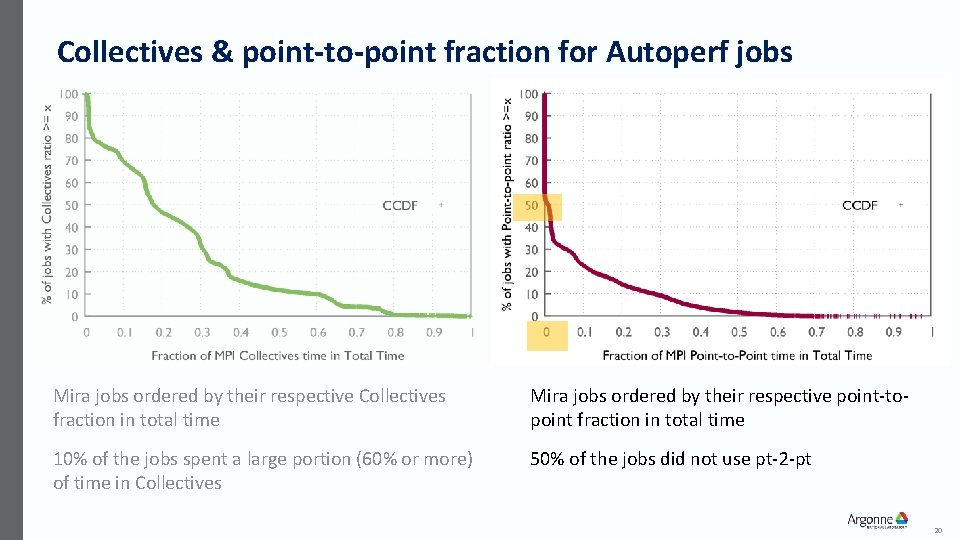
Collectives & point-to-point fraction for Autoperf jobs Mira jobs ordered by their respective Collectives fraction in total time Mira jobs ordered by their respective point-topoint fraction in total time 10% of the jobs spent a large portion (60% or more) of time in Collectives 50% of the jobs did not use pt-2 -pt 20

MPI COLLECTIVES USAGE ACROSS ALL THE AUTOPERF JOBS ON MIRA 21

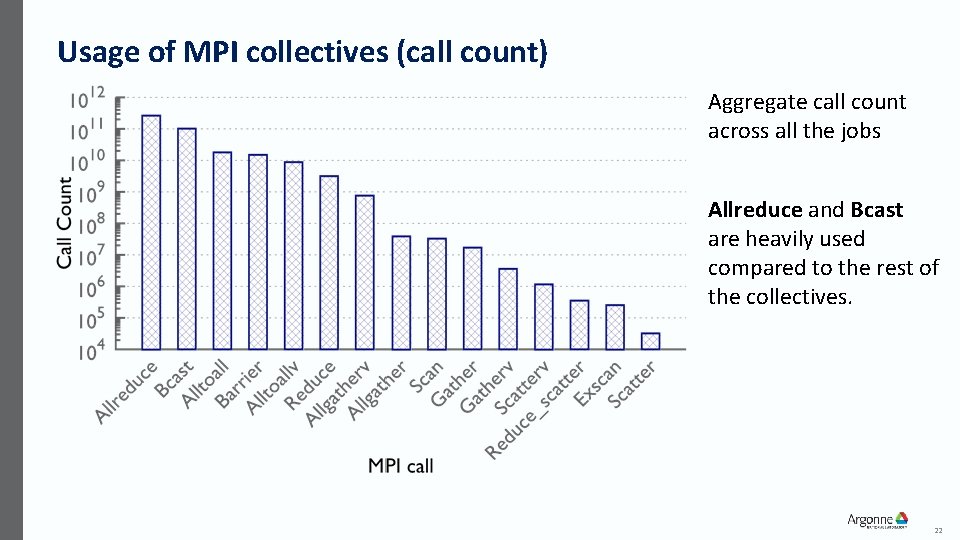
Usage of MPI collectives (call count) Aggregate call count across all the jobs Allreduce and Bcast are heavily used compared to the rest of the collectives. 22

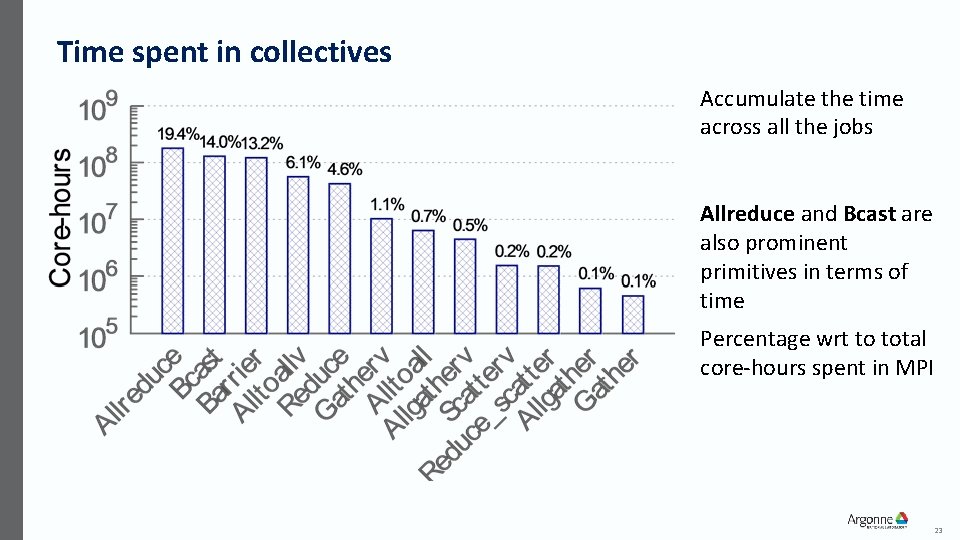
Time spent in collectives Accumulate the time across all the jobs Allreduce and Bcast are also prominent primitives in terms of time Percentage wrt to total core-hours spent in MPI 23

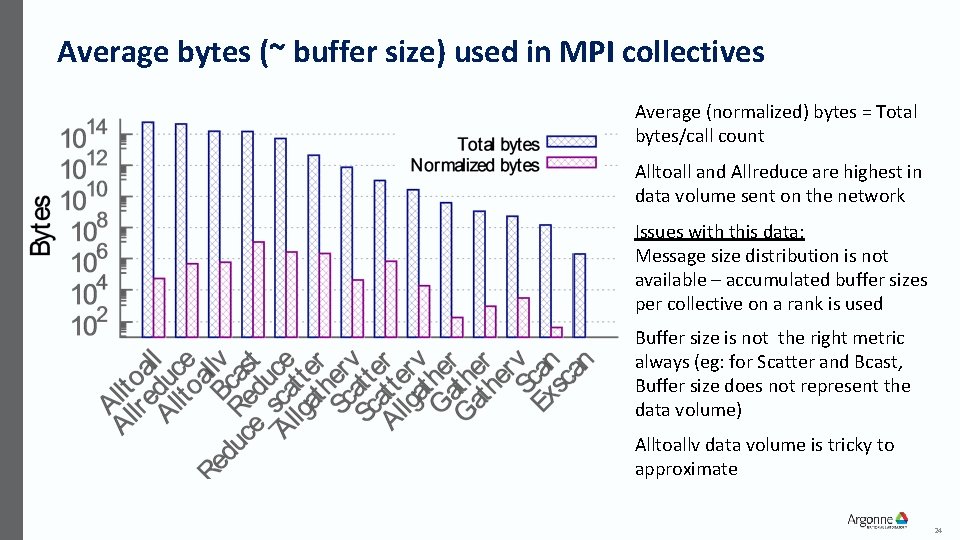
Average bytes (~ buffer size) used in MPI collectives Average (normalized) bytes = Total bytes/call count Alltoall and Allreduce are highest in data volume sent on the network Issues with this data: Message size distribution is not available – accumulated buffer sizes per collective on a rank is used Buffer size is not the right metric always (eg: for Scatter and Bcast, Buffer size does not represent the data volume) Alltoallv data volume is tricky to approximate 24

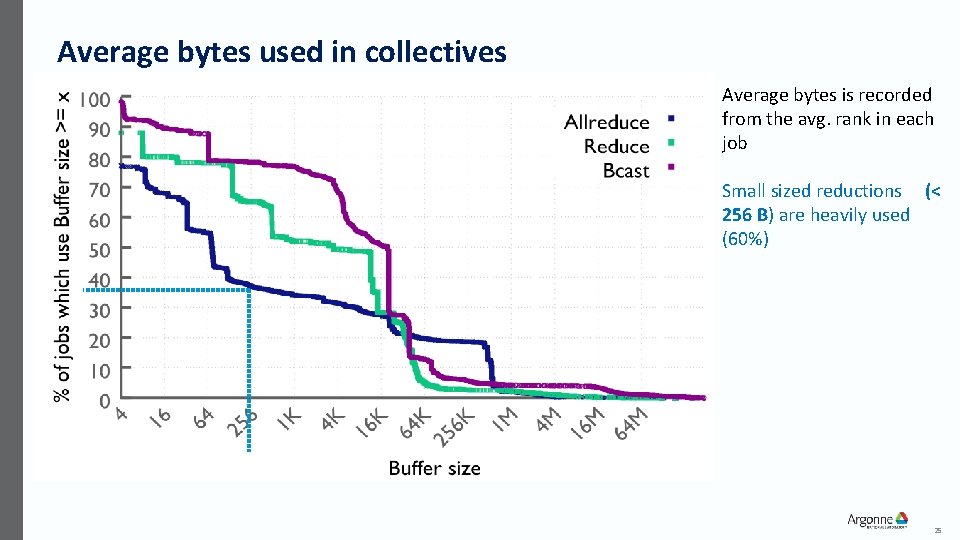
Average bytes used in collectives Average bytes is recorded from the avg. rank in each job Small sized reductions (< 256 B) are heavily used (60%) 25

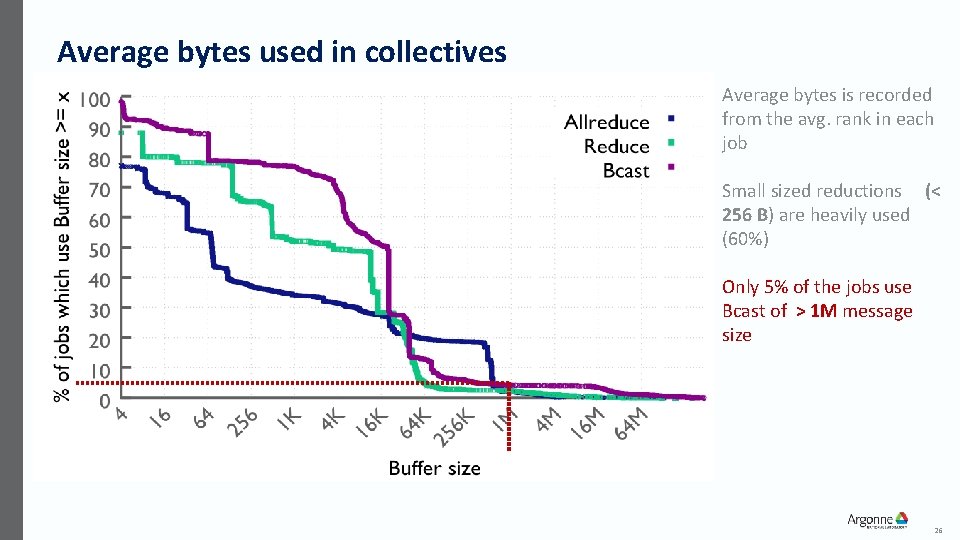
Average bytes used in collectives Average bytes is recorded from the avg. rank in each job Small sized reductions (< 256 B) are heavily used (60%) Only 5% of the jobs use Bcast of > 1 M message size 26

MPI point-to-point MPI POINT-TO-POINT USAGE ACROSS ALL THE AUTOPERF JOBS ON MIRA 27

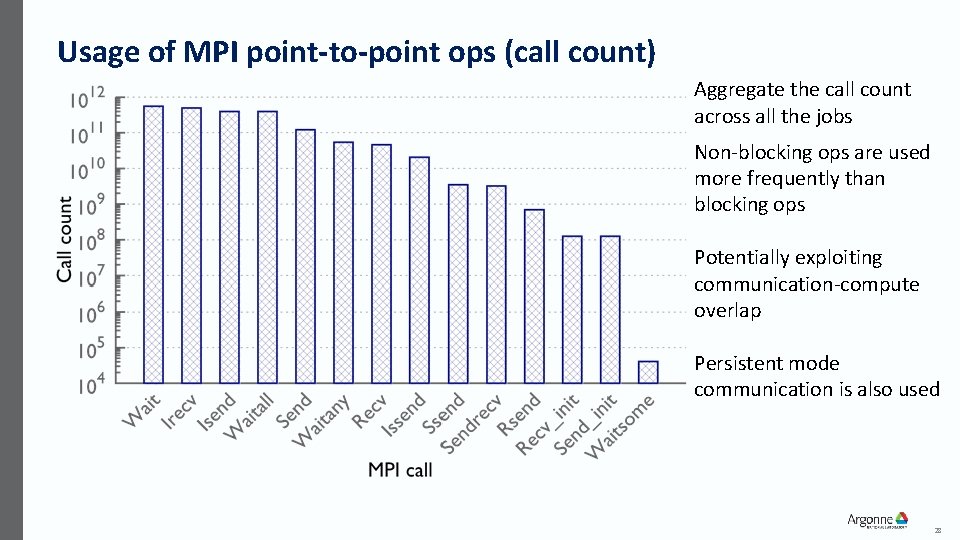
Usage of MPI point-to-point ops (call count) Aggregate the call count across all the jobs Non-blocking ops are used more frequently than blocking ops Potentially exploiting communication-compute overlap Persistent mode communication is also used 28

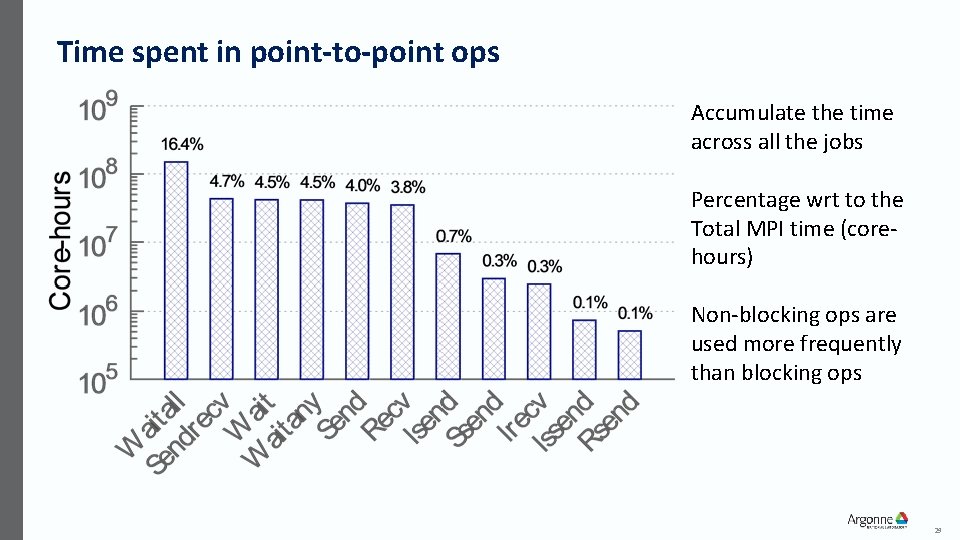
Time spent in point-to-point ops Accumulate the time across all the jobs Percentage wrt to the Total MPI time (corehours) Non-blocking ops are used more frequently than blocking ops 29

Normalized bytes (~ buffer size) used in MPI point-to-point ops Normalized bytes = Total bytes/call count Use this data to explore potential optimizations to Eager/Rendezvous switch Communicator hint optimizations? 30

MPI usage in Production Applications on Mira 31

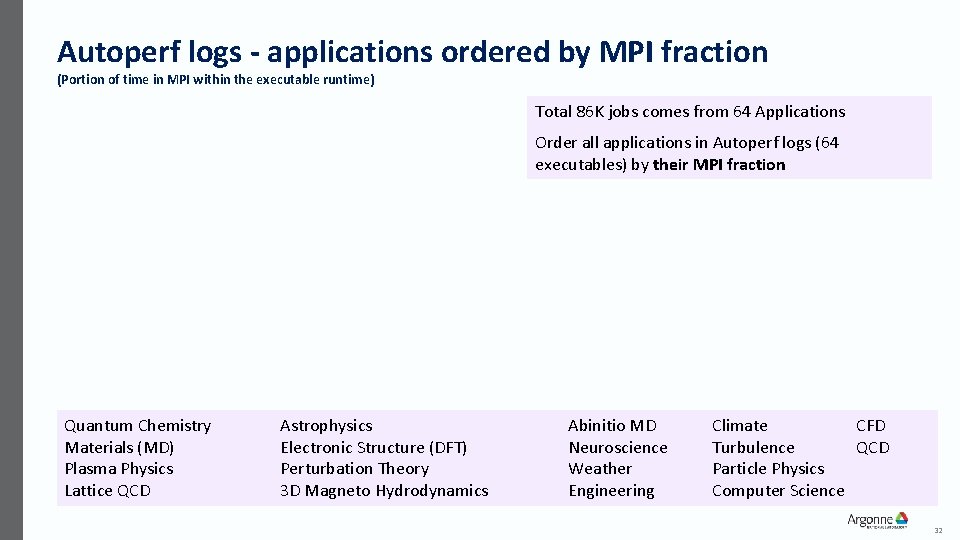
Autoperf logs - applications ordered by MPI fraction (Portion of time in MPI within the executable runtime) Total 86 K jobs comes from 64 Applications Order all applications in Autoperf logs (64 executables) by their MPI fraction Quantum Chemistry Materials (MD) Plasma Physics Lattice QCD Astrophysics Electronic Structure (DFT) Perturbation Theory 3 D Magneto Hydrodynamics Abinitio MD Neuroscience Weather Engineering Climate CFD Turbulence QCD Particle Physics Computer Science 32

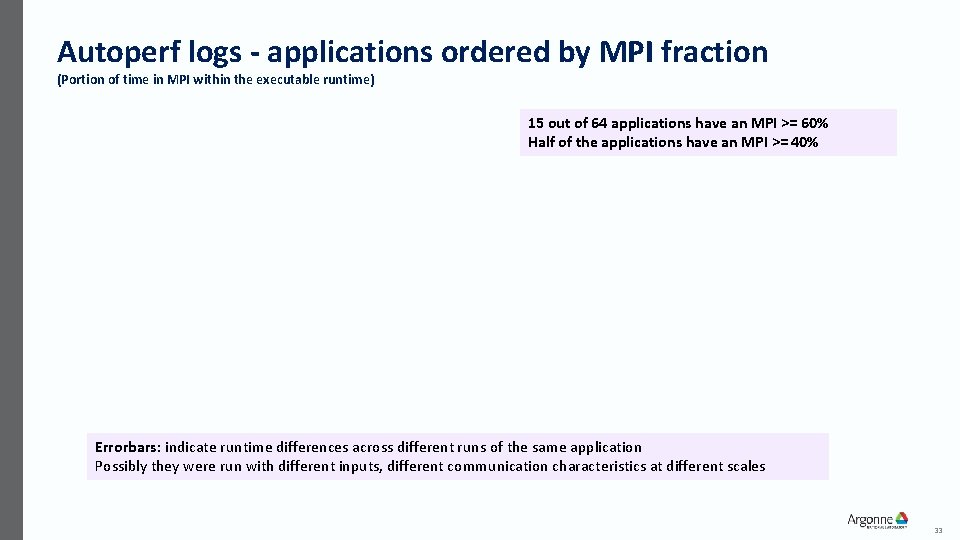
Autoperf logs - applications ordered by MPI fraction (Portion of time in MPI within the executable runtime) 15 out of 64 applications have an MPI >= 60% Half of the applications have an MPI >= 40% Errorbars: indicate runtime differences across different runs of the same application Possibly they were run with different inputs, different communication characteristics at different scales 33

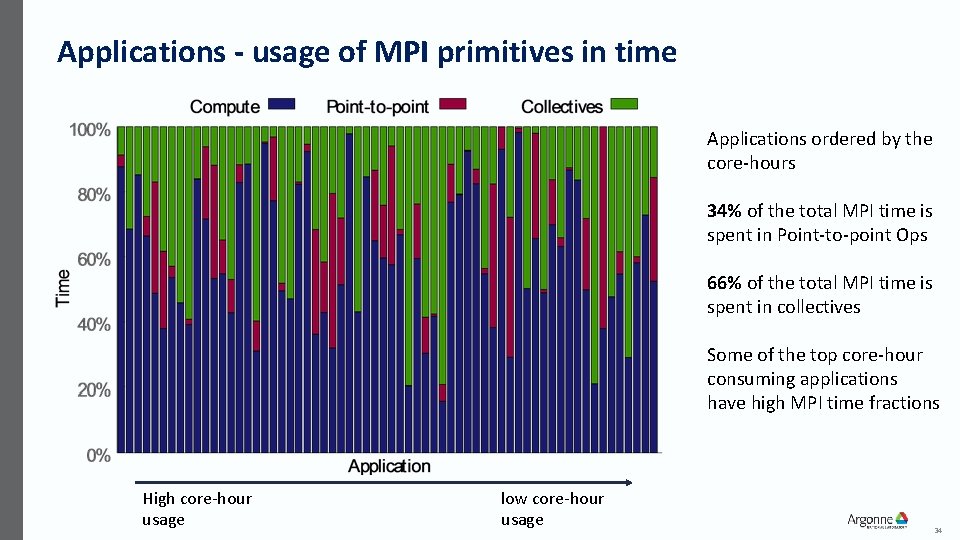
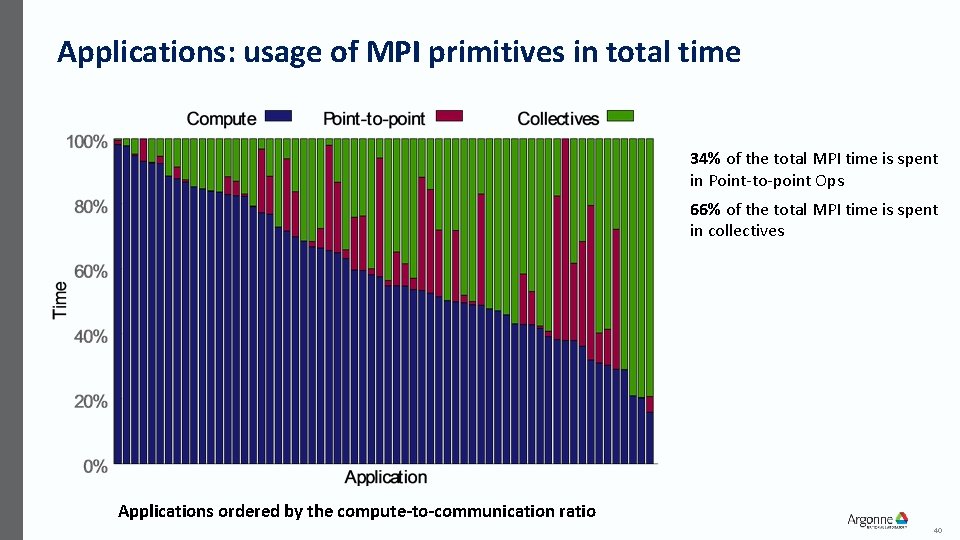
Applications - usage of MPI primitives in time Applications ordered by the core-hours 34% of the total MPI time is spent in Point-to-point Ops 66% of the total MPI time is spent in collectives Some of the top core-hour consuming applications have high MPI time fractions High core-hour usage low core-hour usage 34

Summary 35

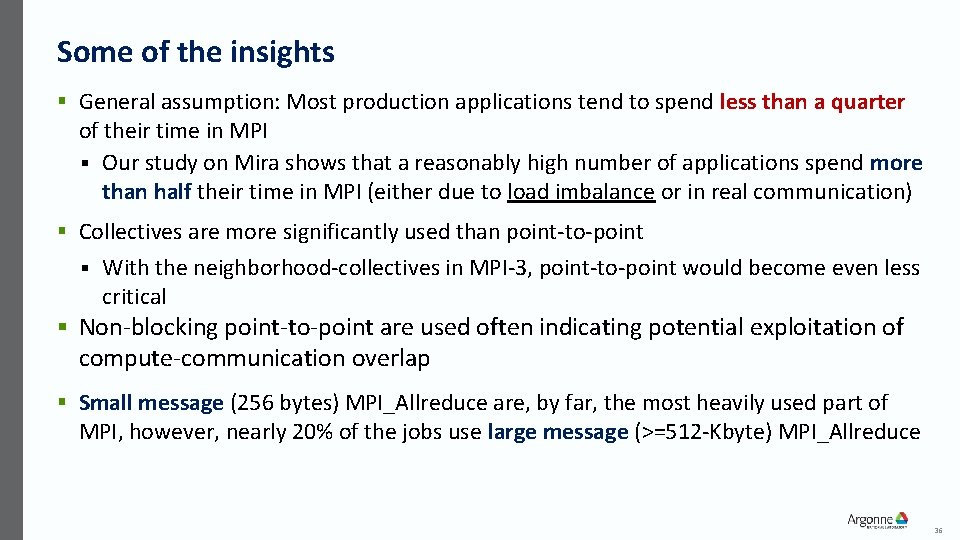
Some of the insights § General assumption: Most production applications tend to spend less than a quarter of their time in MPI § Our study on Mira shows that a reasonably high number of applications spend more than half their time in MPI (either due to load imbalance or in real communication) § Collectives are more significantly used than point-to-point § With the neighborhood-collectives in MPI-3, point-to-point would become even less critical § Non-blocking point-to-point are used often indicating potential exploitation of compute-communication overlap § Small message (256 bytes) MPI_Allreduce are, by far, the most heavily used part of MPI, however, nearly 20% of the jobs use large message (>=512 -Kbyte) MPI_Allreduce 36

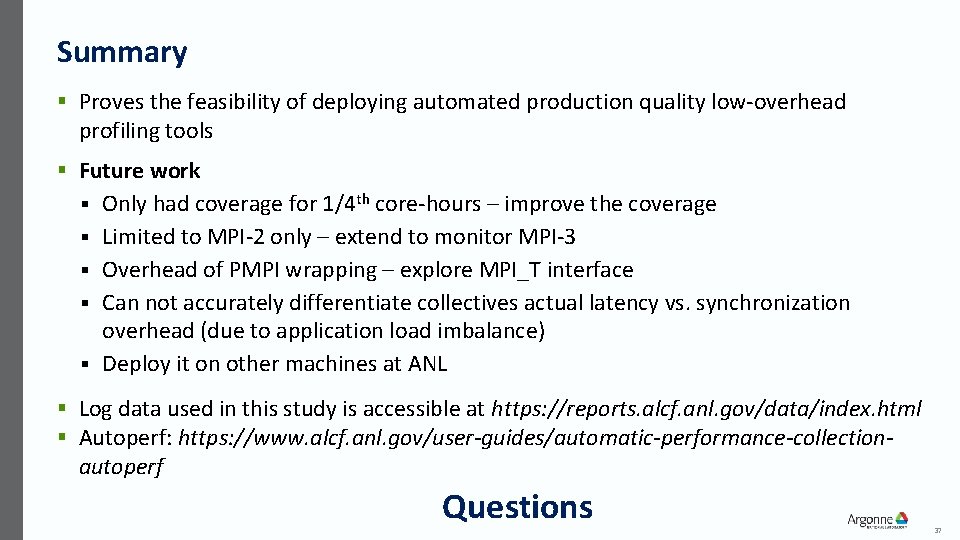
Summary § Proves the feasibility of deploying automated production quality low-overhead profiling tools § Future work § § § Only had coverage for 1/4 th core-hours – improve the coverage Limited to MPI-2 only – extend to monitor MPI-3 Overhead of PMPI wrapping – explore MPI_T interface Can not accurately differentiate collectives actual latency vs. synchronization overhead (due to application load imbalance) Deploy it on other machines at ANL § Log data used in this study is accessible at https: //reports. alcf. anl. gov/data/index. html § Autoperf: https: //www. alcf. anl. gov/user-guides/automatic-performance-collection- autoperf Questions 37

Miscellaneous 38

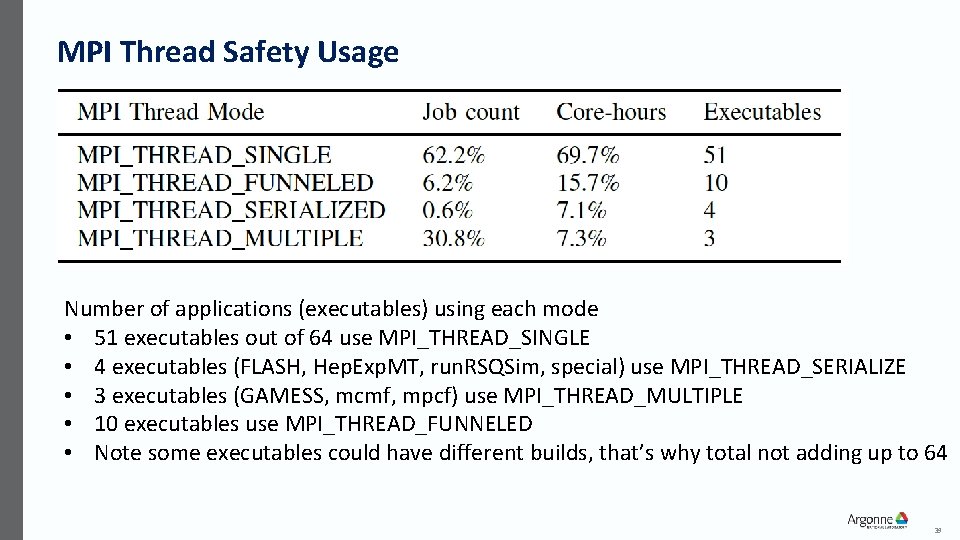
MPI Thread Safety Usage Number of applications (executables) using each mode • 51 executables out of 64 use MPI_THREAD_SINGLE • 4 executables (FLASH, Hep. Exp. MT, run. RSQSim, special) use MPI_THREAD_SERIALIZE • 3 executables (GAMESS, mcmf, mpcf) use MPI_THREAD_MULTIPLE • 10 executables use MPI_THREAD_FUNNELED • Note some executables could have different builds, that’s why total not adding up to 64 39

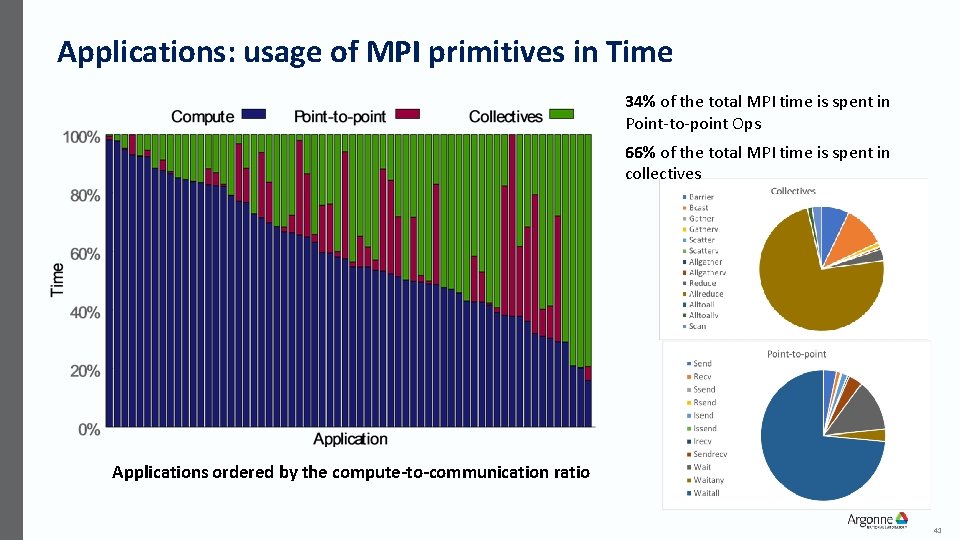
Applications: usage of MPI primitives in total time 34% of the total MPI time is spent in Point-to-point Ops 66% of the total MPI time is spent in collectives Applications ordered by the compute-to-communication ratio 40

Applications: usage of MPI primitives in Time 34% of the total MPI time is spent in Point-to-point Ops 66% of the total MPI time is spent in collectives Applications ordered by the compute-to-communication ratio 41

Why this study? § MPI is a prominent programming model used for production scientific computing Around 90% of all the applications run on ANL’s production machine (Mira) use MPI § Different applications have different requirements for parallelism and could be using different features of MPI § How scientific computing applications use MPI in production? § § It is imperative to glean into the MPI feature set exploration by production applications To assess how efficiently MPI is being used § Identify areas of concern in terms of performance of MPI features § § Why such study was not done already? Performance overhead with profiling tools § Lack of production quality lightweight profiling tools § § Key Insights: More than half of time is spent in MPI for a reasonably large number of applications 2) The prominence in terms of time and usage of Collectives is more compared to point-to-point operations 3) Small message (<= 256 bytes) MPI_Allreduce operations are most heavily used 4) The usage of Hybrid MPI+Open. MP (or pthreads) programming models is on the rise 1) 42

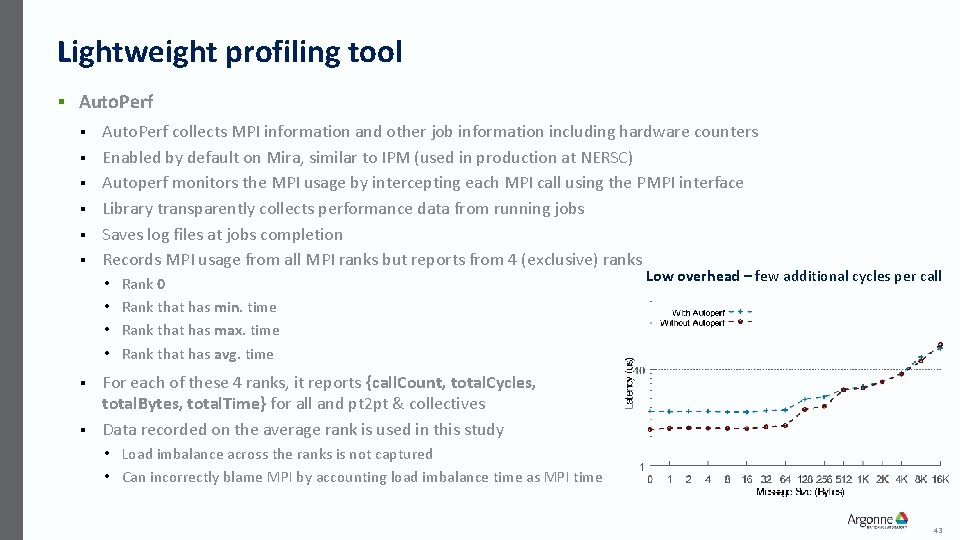
Lightweight profiling tool § Auto. Perf § § § Auto. Perf collects MPI information and other job information including hardware counters Enabled by default on Mira, similar to IPM (used in production at NERSC) Autoperf monitors the MPI usage by intercepting each MPI call using the PMPI interface Library transparently collects performance data from running jobs Saves log files at jobs completion Records MPI usage from all MPI ranks but reports from 4 (exclusive) ranks • • Rank 0 Rank that has min. time Rank that has max. time Rank that has avg. time Low overhead – few additional cycles per call For each of these 4 ranks, it reports {call. Count, total. Cycles, total. Bytes, total. Time} for all and pt 2 pt & collectives § Data recorded on the average rank is used in this study § • Load imbalance across the ranks is not captured • Can incorrectly blame MPI by accounting load imbalance time as MPI time 43

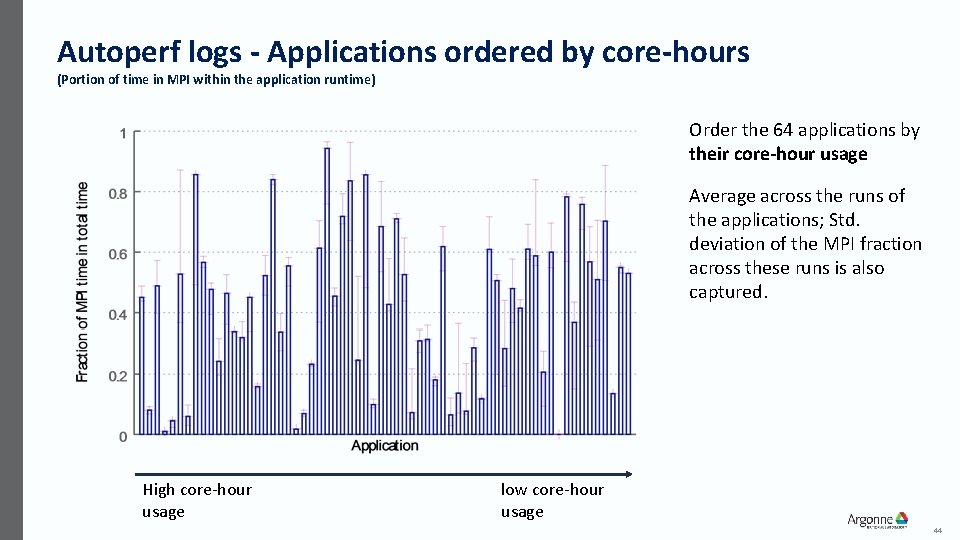
Autoperf logs - Applications ordered by core-hours (Portion of time in MPI within the application runtime) Order the 64 applications by their core-hour usage Average across the runs of the applications; Std. deviation of the MPI fraction across these runs is also captured. High core-hour usage low core-hour usage 44

BACKUP 45

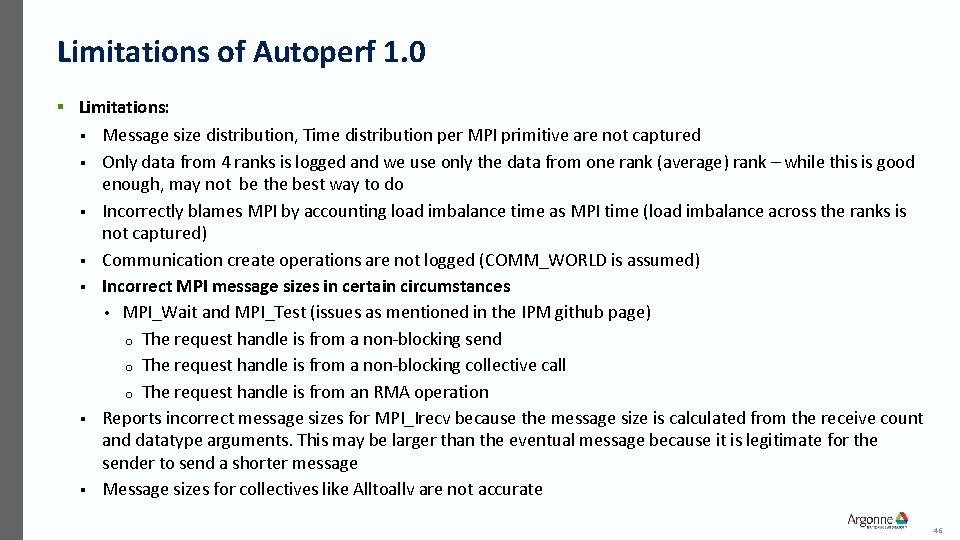
Limitations of Autoperf 1. 0 § Limitations: § § § § Message size distribution, Time distribution per MPI primitive are not captured Only data from 4 ranks is logged and we use only the data from one rank (average) rank – while this is good enough, may not be the best way to do Incorrectly blames MPI by accounting load imbalance time as MPI time (load imbalance across the ranks is not captured) Communication create operations are not logged (COMM_WORLD is assumed) Incorrect MPI message sizes in certain circumstances • MPI_Wait and MPI_Test (issues as mentioned in the IPM github page) o The request handle is from a non-blocking send o The request handle is from a non-blocking collective call o The request handle is from an RMA operation Reports incorrect message sizes for MPI_Irecv because the message size is calculated from the receive count and datatype arguments. This may be larger than the eventual message because it is legitimate for the sender to send a shorter message Message sizes for collectives like Alltoallv are not accurate 46