Characteristics of Steam Generator Tube Analysis Relatively uniform

Characteristics of Steam Generator Tube Analysis • Relatively uniform tube geometries (Rm/t~8. 3, t ~1 mm) • Relatively similar material (Inconel 600, 690) • Main Loading – Internal Pressure What has to be estimated ? • Burst pressure • Leak Rate ü Crack Opening Displacement ü Leak Rate model Application of Limit Load Analysis to Estimate Burst Pressure Seems Reasonable

Determination of Limit Load v Analytical Approach ü Most existing solutions are lower bounds based on equilibrium stress fields and/or Tresca condition ü Refer to Miller’s compendium (IJPVP, 1982) or R 6 Rev. 4 ü For part-through cracks, both local and global limit load solutions are given ü For a given geometry, a number of different solutions are available v Empirical Approach ü Modify existing solutions based on test data v Numerical (Finite Element) Approach (Most Accurate) ü Elastic-Perfectly-Plastic FE Limit Analysis § Elastic-perfectly-plastic material used § For numerical stability, use Modified Risks method

Example of Existing Limit Load Solutions Axial Through-Wall Cracked Pipes under Internal Pressure • Erdogan Solution (ANL recommended) • FE Limit Load Solution sy sf=(sy+su)/2

Comparison with Experimental Data conservative 1. 45 1. 35 0. 78 0. 81 Non-conservative Erdogan pexp/ppred FE Limit Load
 Axial Surface Cracked Pipes under Internal Pressure")
Example of Existing Limit Load Solutions (1) Axial Surface Cracked Pipes under Internal Pressure • Empirical Limit Load - Battelle • Empirical Limit Load Based on Test Data
 Axial Surface Cracked Pipes under Internal Pressure")
Example of Existing Limit Load Solutions (2) Axial Surface Cracked Pipes under Internal Pressure • Global Limit Load (Net-Section Limit Load) – Lower Bound • FE Global Limit Load Solution – Close to Exact Limit Load
 1. 97 conservative 1. 62 1. 10 1. 22")
Comparison with Experimental Data (1) 1. 97 conservative 1. 62 1. 10 1. 22 Non-conservative Battelle - Empirical pexp/ppred ANL - Empirical
 conservative 1. 40 1. 04 0. 60 Non-conservative Global")
Comparison with Experimental Data (2) conservative 1. 40 1. 04 0. 60 Non-conservative Global Limit Load pexp/ppred 0. 27 FE Global

Limit Load Analysis – Concluding Remarks v Advantages: Ø No need of toughness properties Ø Easy to extend to complex geometries and loading NB: Thermal/Residual stress do not affect limit load v Disadvantages: Ø Physically not sound, simple approximation Ø The most accurate limit load gives non-conservative estimates of maximum loads Ø Should be tailored to a large set of test data for confidence Pf = sy • f(geometry, loading) Fracture Mechanics Based Method

Fracture Mechanics Analysis of Steam Generator Tube 1. Select representative tensile data - Inconel 690 TT 2. Select representative cylinder geometry - Rm/t=8. 3, t =1 mm 3. Perform elastic-plastic FE analysis 4. Derive closed-form approximations for J and COD 5. Perform experimental validation

Material Properties of Steam Generator Tube

Fracture Mechanics Analyses of Steam Generator Tube Fracture Mechanics Analyses Carried Out Ü Axial Through-Thickness Crack à J and COD (COA) Estimation Ü Axial Surface Crack à J Estimation Ü Circumferential Through-Thickness Crack à J and COD (COA) Estimation Ü Circumferential Surface Crack à J and COD (COA) Estimation

J & COD Estimation for Axial Through-Wall Cracked SG Tubes t 2 c CL p Where, Ri Rm ㅡ Ro

FE Validation for Axial Through-Wall Cracked SG Tubes

FE Validation for Axial Through-Wall Cracked SG Tubes

J & COD Estimation for Circumferential Through-Wall Cracked SG Tubes Where p

FE Validation for Circumferential Through-Wall Cracked SG Tubes

FE Validation for Circumferential Through-Wall Cracked SG Tubes

Comparison with Experimental Data 1. 52 0. 91 conservative 1. 35 0. 78 Non-conservative FMA pexp/ppred Limit Load Analysis (ANL)
 for Steam Generator Tubes Urgently Needed W. J.")
Fracture Toughness (Jc and J-R curve) for Steam Generator Tubes Urgently Needed W. J. Mills – “On the relationship between stretch zone formation and the J-integral for high strain hardening materials. ” Journal of Testing and evaluation JTEVA vol. 9 No 1 Jan 1981 pp 56 -62 and Report Hanford Engineering development Laboratory TC 9367 Oct – Dec 1978 Discontinuous test method used JIC = 376 k. J/m 2 (J=4σf(Δa)) JIC = 486 k. J/m 2 (J=2σf(Δa)) R curve for alloy 600 tested at 24˚C

J Estimation for Axial Surface Cracked SG Tubes Where, p
")
FE Validation for Axial Surface Cracked SG Tubes (1)
")
FE Validation for Axial Surface Cracked SG Tubes (2)

J Estimation for Circumferential Surface Cracked SG Tubes Where, p
")
FE Validation for Circumferential Surface Cracked SG Tubes (1)
")
FE Validation for Circumferential Surface Cracked SG Tubes (2)
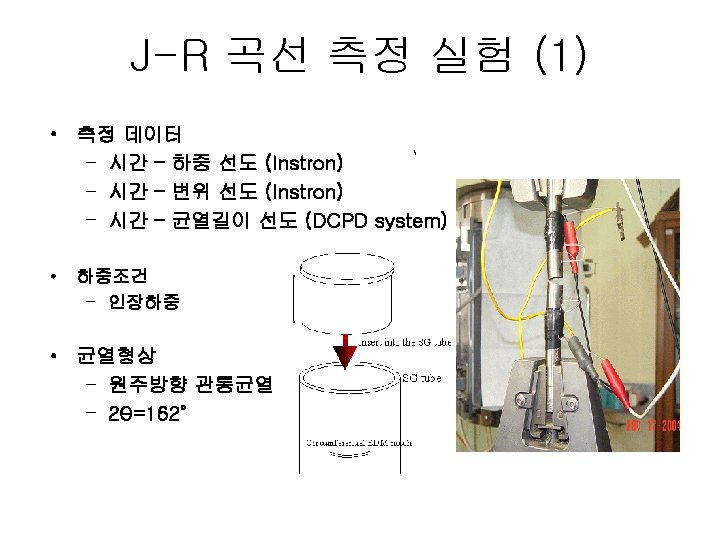
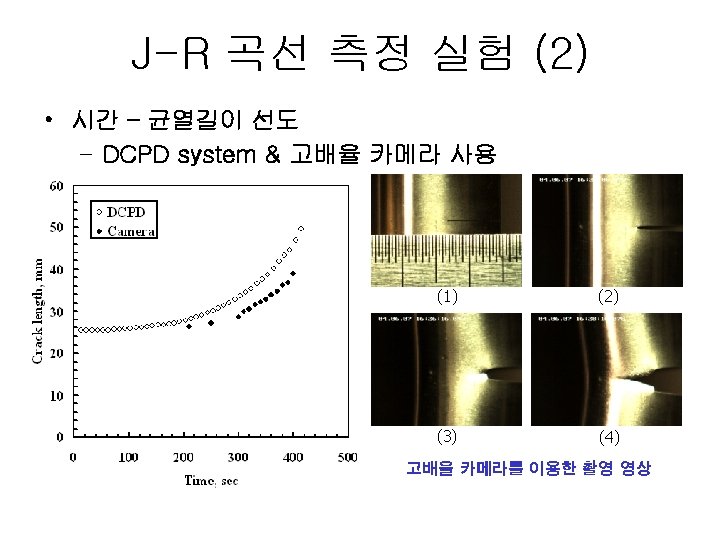
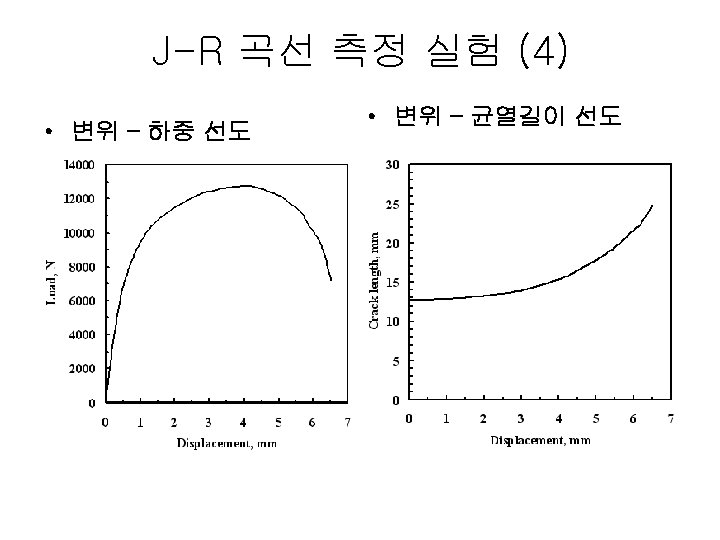
 • 균열진전량 측정 – DCPD법과 고배율 카메라를 이용한 측정결과를")
J-R 곡선 측정 실험 (3) • 균열진전량 측정 – DCPD법과 고배율 카메라를 이용한 측정결과를 동시에 이용 – Miura et al. , “Ductile fracture behavior of Cl. 2&3 LWR piping and its implication for flaw evaluation criteria, ” 2004, Proceedings of 5 th International Workshop on the Integrity of Nuclear Components • Δa was estimated from the calibration curves of the directcurrent electric potential together with the monitored pictures by the video microscope system. • DCPD법과 고배율 카메라를 이용한 측정량의 차이 – 고배율 카메라 • 균열길이 측정시 주관적인 요소 수반, 하중 증가에 따른 시편단면의 변형 고려 불가능 – DCPD법 • 유한요소해석 기반의 정확한 평가 가능, 연속적인 데이터 확보 가능 • J-R 곡선 산출시 DCPD법에 의해 측정된 균열진전량 사용 권고
σf • Construction line: 4(Δa)σf 기준")
J-R 곡선 및 JIC 결정 • Construction line: 2(Δa)σf • Construction line: 4(Δa)σf 기준 기준 JIC=945 k. J/m 2 JIC=471 k. J/m 2

Comparison with Experimental Data Limit load analysis for through-wall crack Limit load analysis for surface crack

Comparison with Experimental Data Limit load analysis vs. fracture mechanics analysis for axial TW cracks For JIC = 471 k. J/m 2 For JIC = 945 k. J/m 2
- Slides: 35