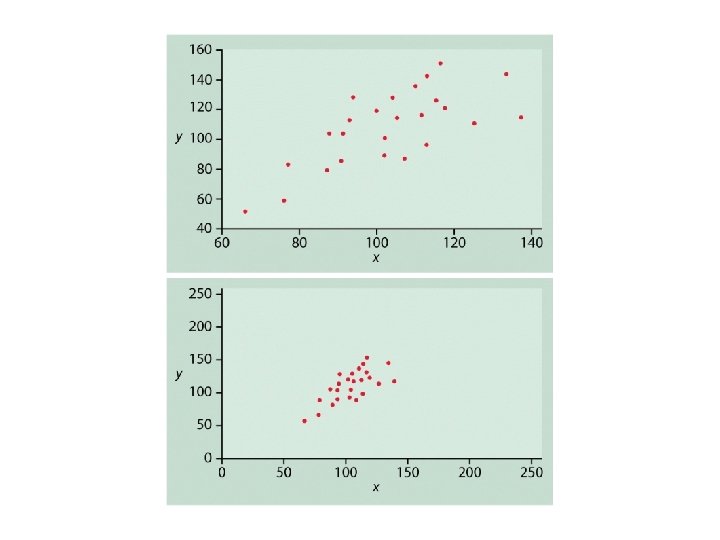
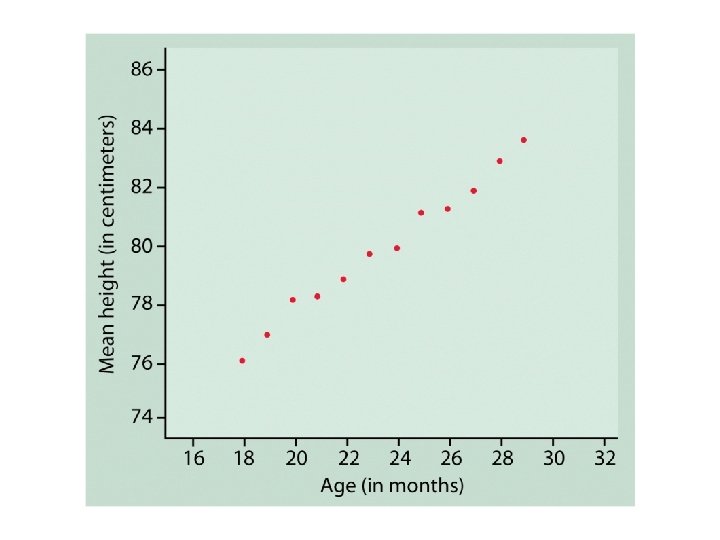
Characteristics of Scatterplots Form Direction Strength FORM Linear


- Slides: 49
Characteristics of Scatterplots • Form • Direction • Strength
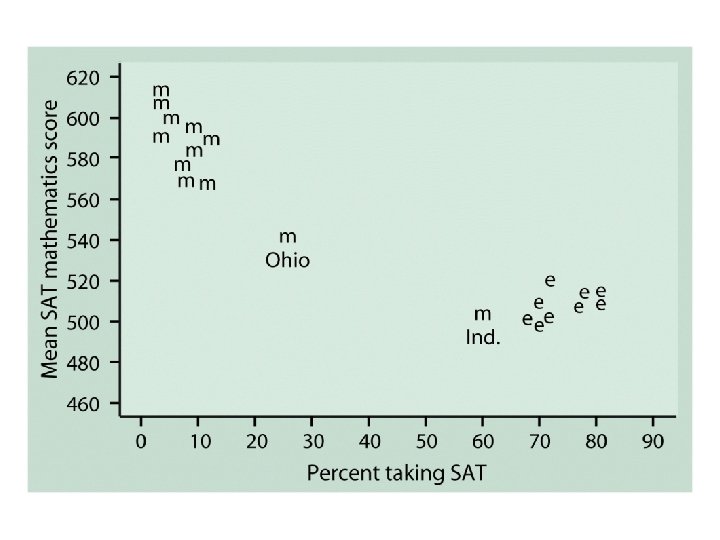
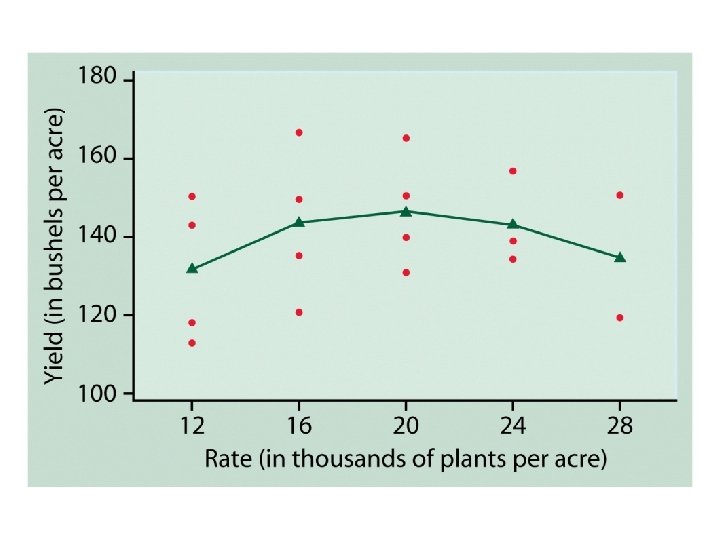
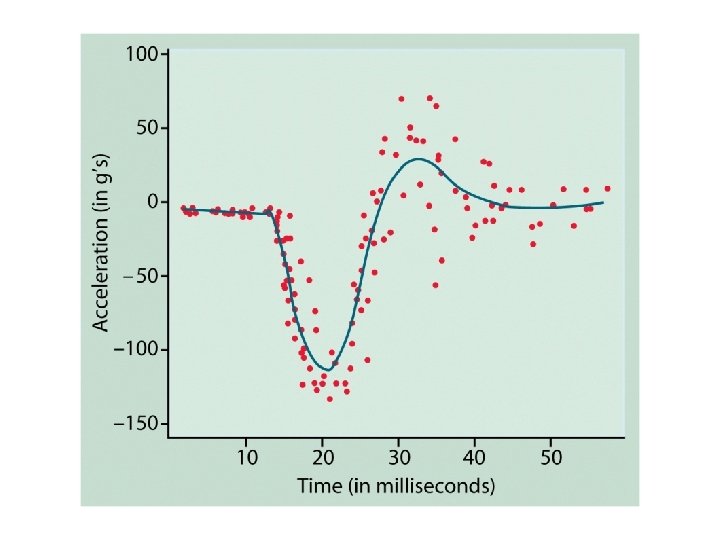
FORM • Linear • Curvilinear • Clustering • Outliers • Other patterns
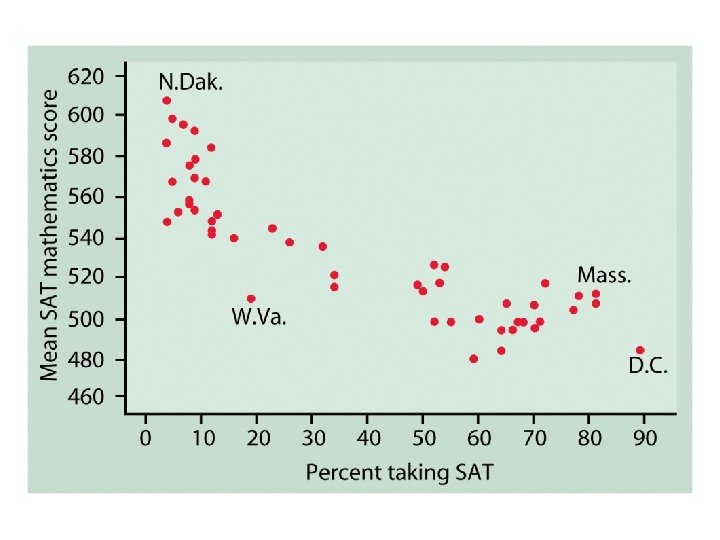
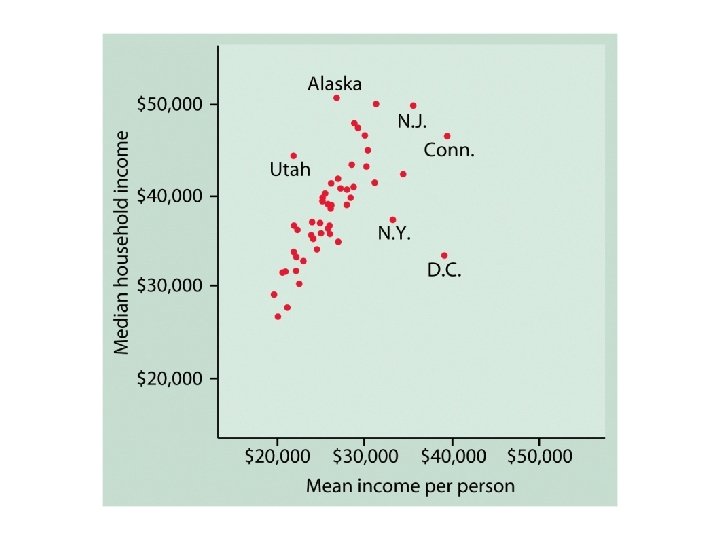
DIRECTION • POSITIVE • Large values of X are associated with large values of Y, and small values of X are associated with small values of Y. • For example, IQ and SAT. • NEGATIVE • Large values of one variable are associated with small values of the other variable • For example, SPEED and ACCURACY.
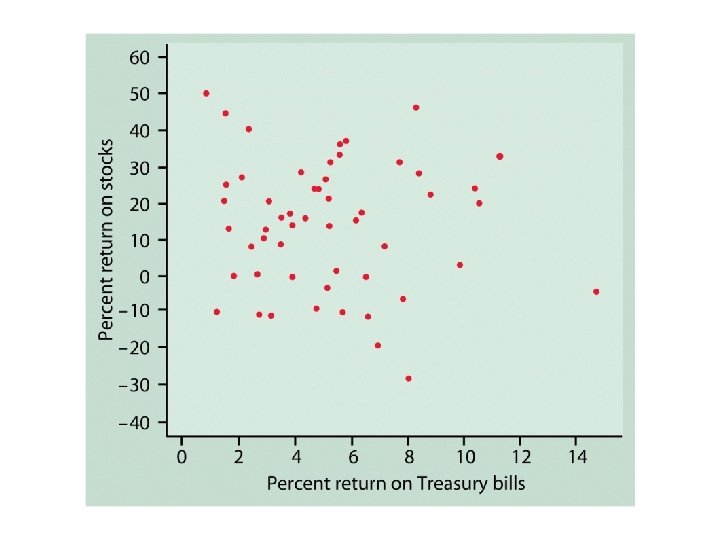
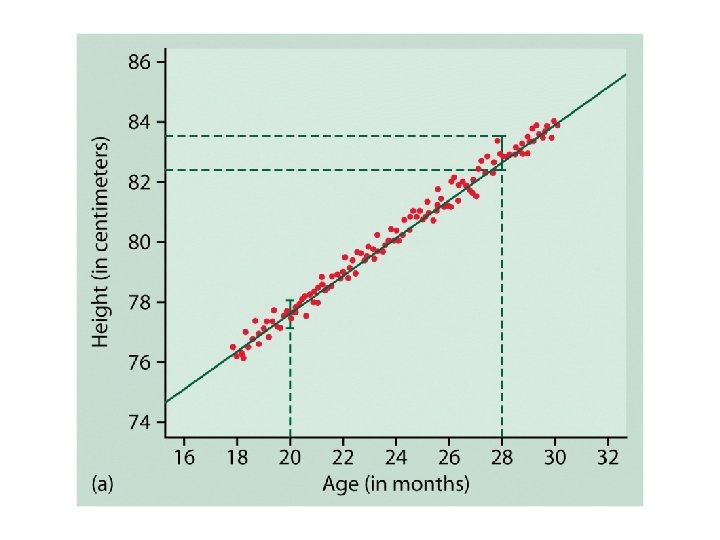
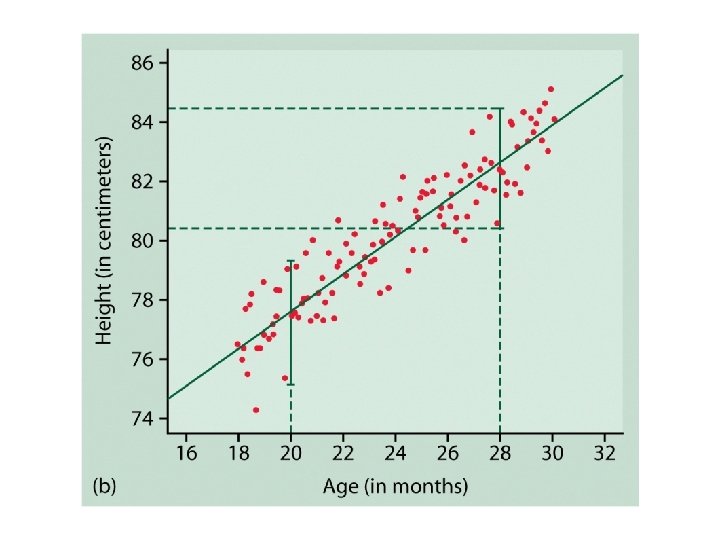
STRENGTH u If the points do not fall along a straight line, then there is NO linear association. u If the points fall nearly along a straight line, then there is a STRONG linear association. u If the points fall exactly along a straight line, then there is a PERFECT linear association.
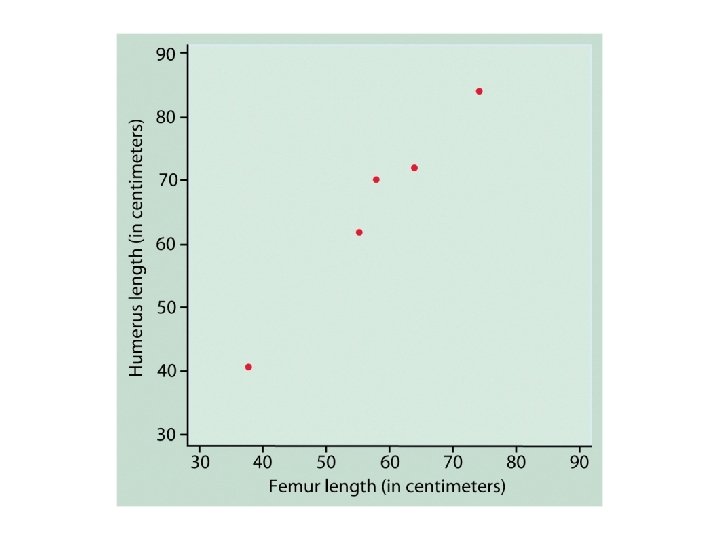
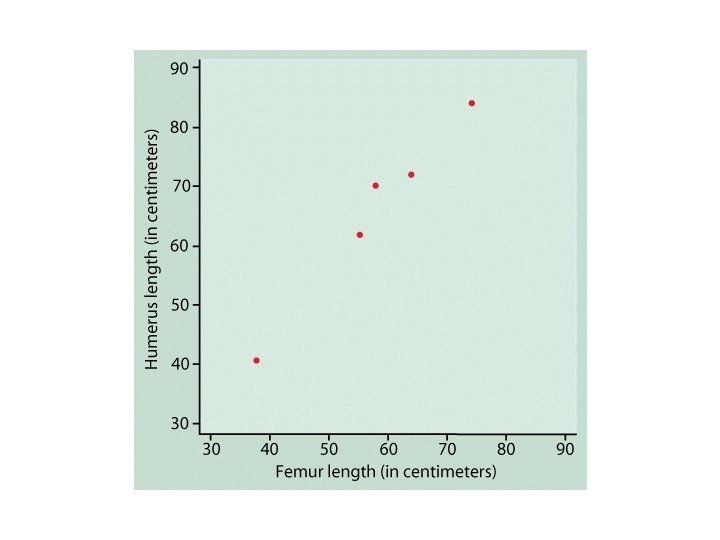
Dinosaur-bone example
How to calculate Pearson’s r
How to calculate Pearson’s r
How to calculate Pearson’s r
How to calculate Pearson’s r
The Pearson product-moment correlation coefficient
The Pearson product-moment correlation coefficient § Convert the X variable to z scores § Convert the Y variable to z scores § Multiply each pair of z scores § Add up the products and divide by n-1
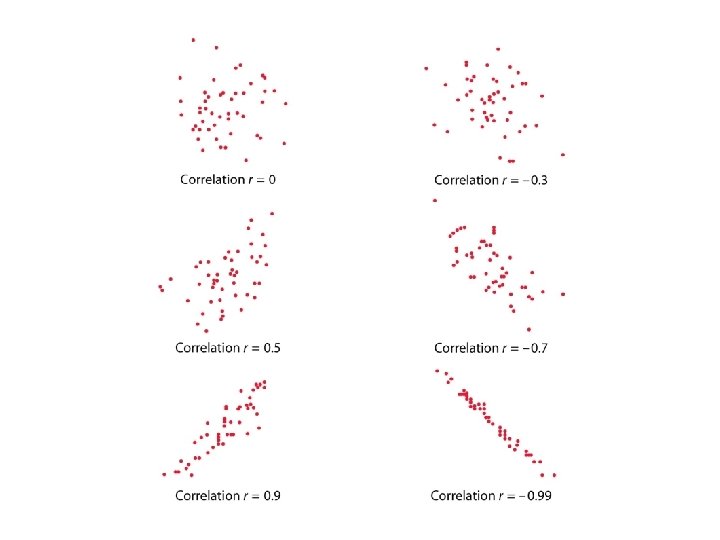
The range of the correlation coefficient -1 perfect negative linear relationship 0 no linear relationship +1 perfect positive linear relationship
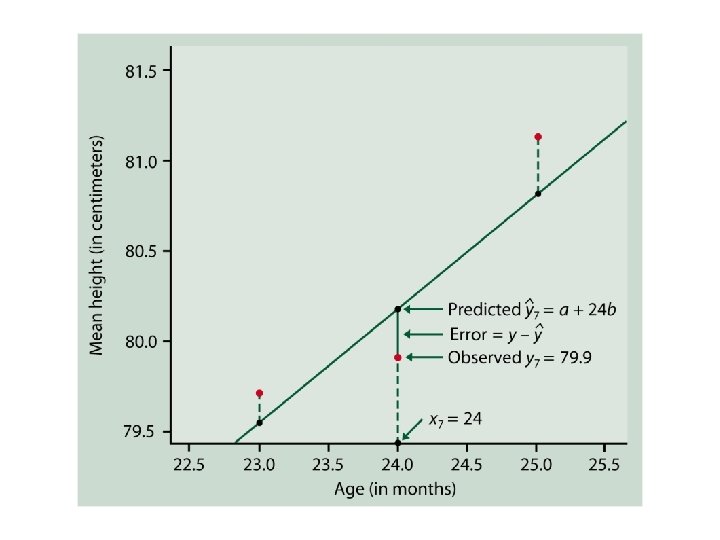
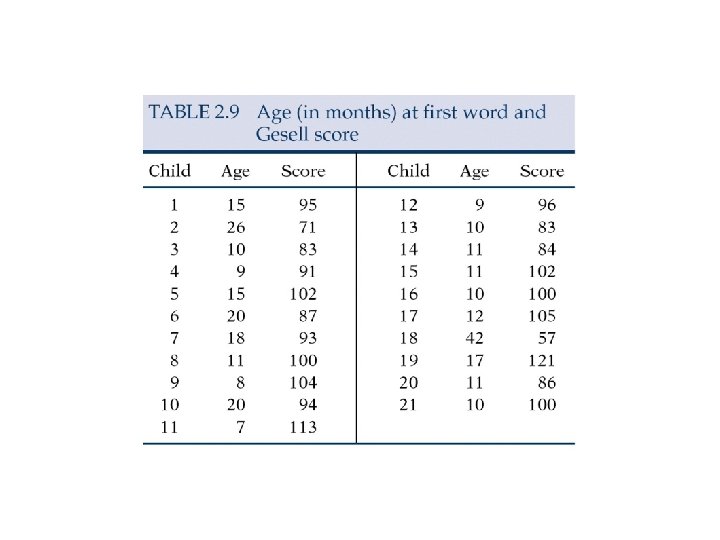
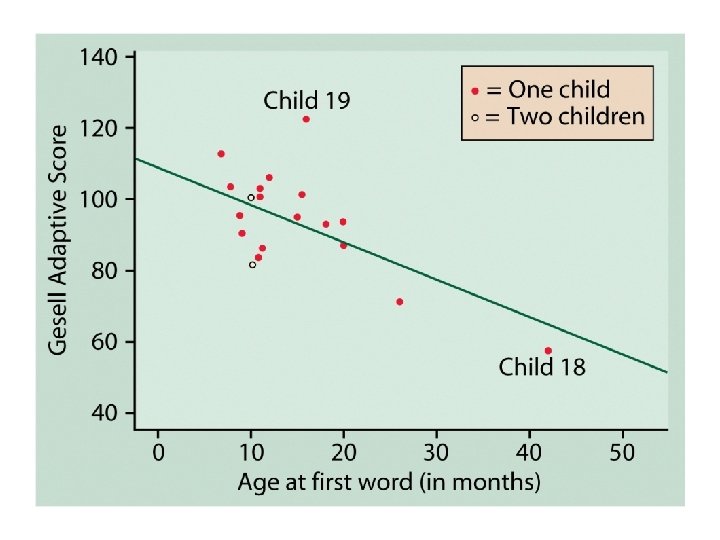
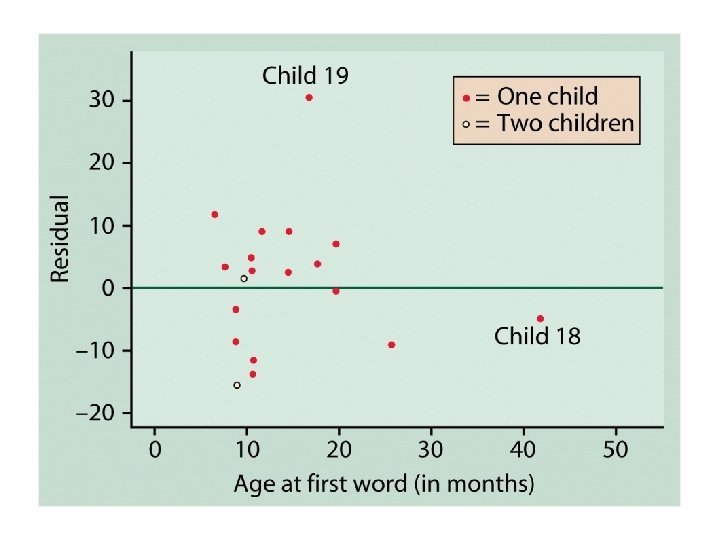
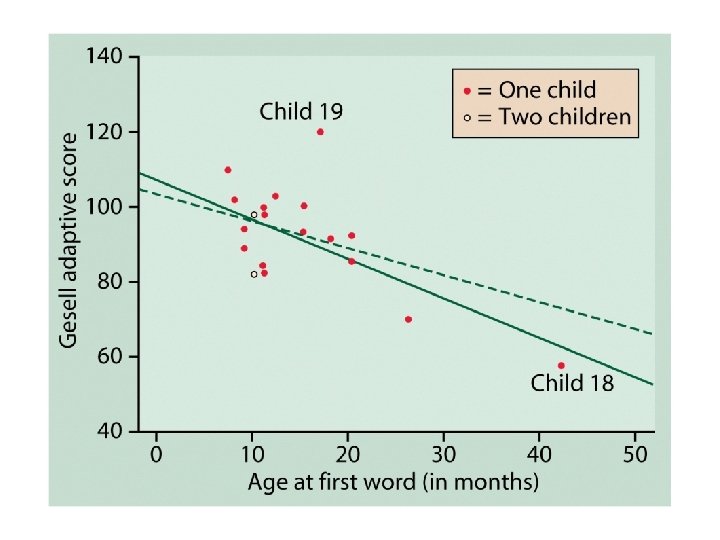
Outliers and influential cases • An outlier is a case which does not follow the overall pattern of the others • An influential case is one which draws the regression line toward its point in the scatterplot.
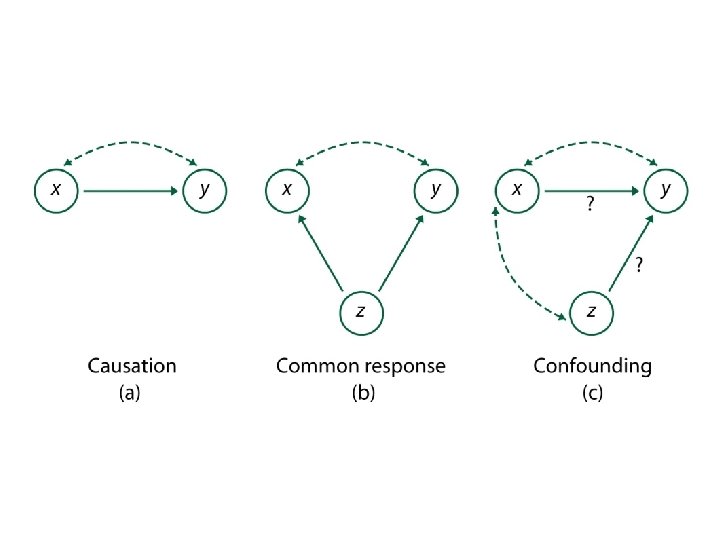
ESTABLISHING CAUSATION Association does not imply causation
When there is association between X and Y • Perhaps X causes Y • Perhaps Y causes X • Perhaps some third variable causes both X and Y
COMMON RESPONSE u. Two variables might be associated because they share a common cause. • For example, SAT scores and College Grades are highly associated, but probably not because scoring well on the SAT causes a student to get high grades in college. • Being a good student, etc. , would be the common cause of the SATs and the grades.
CONFOUNDING u. For example, there is a strong positive association between Number of Years of Education and Annual Income. • In part, getting more education allows people to get better, higher-paying jobs. • But these variables are confounded with others, such as socio-economic status (SES).
ESTABLISHING CAUSATION u. The best way to establish that X causes Y is to have a controlled experiment, in which X is varied by the experimenter and the effects on Y can be seen. u. But experimentation is not always possible.
ESTABLISHING CAUSATION u. The association is strong u. The association is consistent u. Stronger treatments are associated with stronger responses u. The alleged cause precedes the effect in time u. The alleged cause is plausible