
CHARACTERISTICS OF MATERIALS MECHANICAL PROPERTIES INTRODUCTION Many material


- Slides: 31
CHARACTERISTICS OF MATERIALS MECHANICAL PROPERTIES INTRODUCTION Many material, when in service, are subjected to forces or loads. It is necessary to know the characteristics of the material from which it is made such that any resulting deformation will not be excessive and fracture will not occur. Mechanical behavior – the relationship between its response or deformation to an applied load or force. Examples : strength, hardness, ductility & stiffness
Factors to be considered in service condition ; 1. Types of applied load – tensile, compression shear. or 2. Magnitude of applied load – constant or with time. fluctuate 3. Application time – a fraction of second or years. extends of 4. Service temperature
Mechanical properties of materials are ascertained – performing laboratory experiments. Standardized testing techniques – to ensure the consistency in the tests conducted and in the interpretation of results. Examples : ASTM (American Society for Testing and Materials), ISO, USD etc.
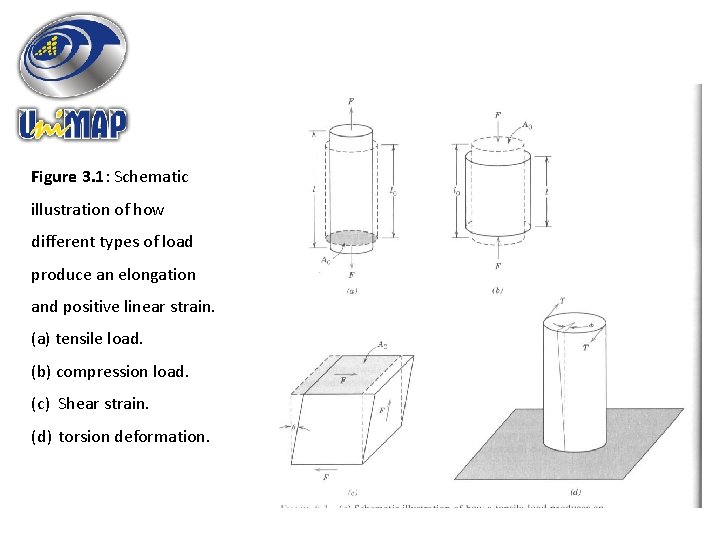
CONCEPTS OF STRESS AND STRAIN If the load is ; � static or changes relatively slowly with time � applied uniformly over a cross section or surface of a member the mechanical behavior may be ascertained by a simple stress-strain test (conducted at room temperature) � Three principle ways of applied load ; tensile, compression and shear (torsion)
Figure 3. 1: Schematic illustration of how different types of load produce an elongation and positive linear strain. (a) tensile load. (b) compression load. (c) Shear strain. (d) torsion deformation.
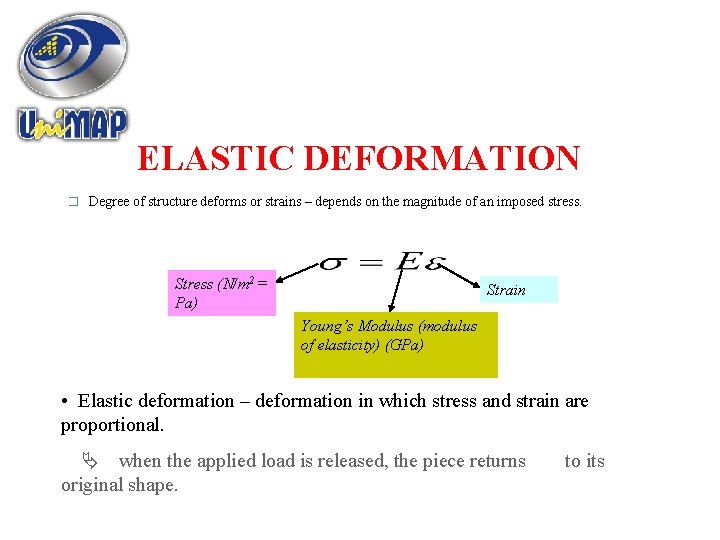
ELASTIC DEFORMATION � Degree of structure deforms or strains – depends on the magnitude of an imposed stress. Stress (N/m 2 = Pa) Strain Young’s Modulus (modulus of elasticity) (GPa) • Elastic deformation – deformation in which stress and strain are proportional. when the applied load is released, the piece returns original shape. to its
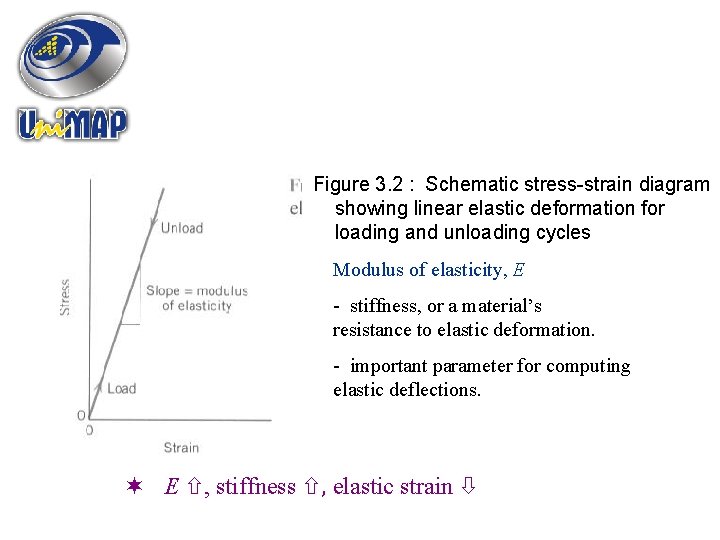
Figure 3. 2 : Schematic stress-strain diagram showing linear elastic deformation for loading and unloading cycles Modulus of elasticity, E - stiffness, or a material’s resistance to elastic deformation. - important parameter for computing elastic deflections. E , stiffness , elastic strain
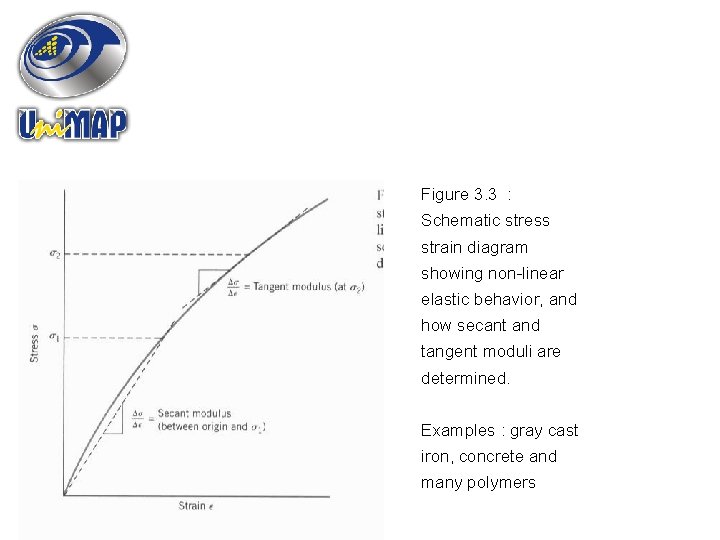
Figure 3. 3 : Schematic stress strain diagram showing non-linear elastic behavior, and how secant and tangent moduli are determined. Examples : gray cast iron, concrete and many polymers
Figure 3. 4 : Plot of modulus of elasticity versus temperature for tungsten, steel and aluminium.
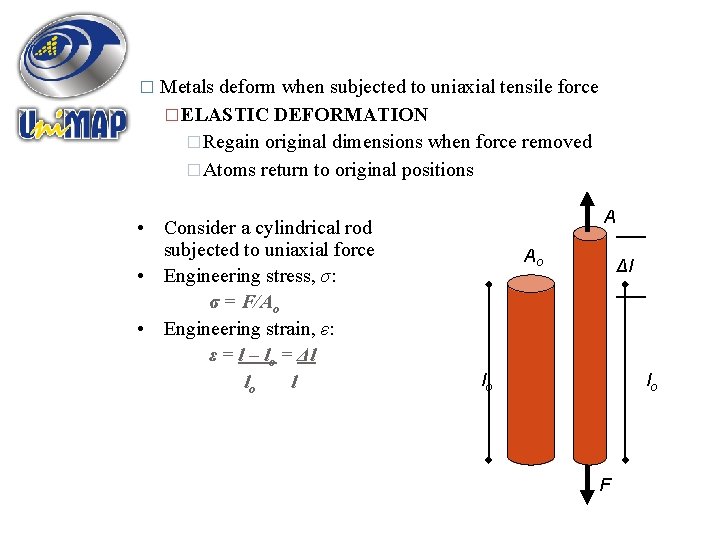
� Metals deform when subjected to uniaxial tensile force �ELASTIC DEFORMATION �Regain original dimensions when force removed �Atoms return to original positions • Consider a cylindrical rod subjected to uniaxial force • Engineering stress, σ: σ = F/Ao • Engineering strain, ε: ε = l – lo = Δl lo l A Ao ___ Δl ___ lo lo F
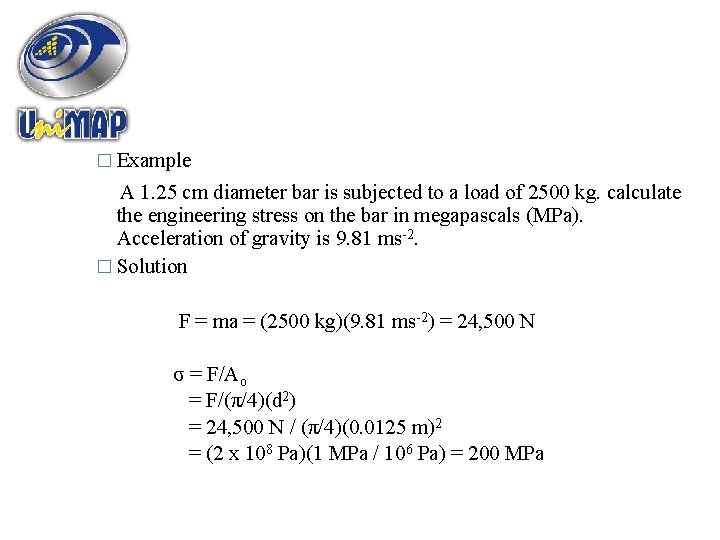
� Example A 1. 25 cm diameter bar is subjected to a load of 2500 kg. calculate the engineering stress on the bar in megapascals (MPa). Acceleration of gravity is 9. 81 ms-2. � Solution F = ma = (2500 kg)(9. 81 ms-2) = 24, 500 N σ = F/Ao = F/(π/4)(d 2) = 24, 500 N / (π/4)(0. 0125 m)2 = (2 x 10⁸ Pa)(1 MPa / 106 Pa) = 200 MPa
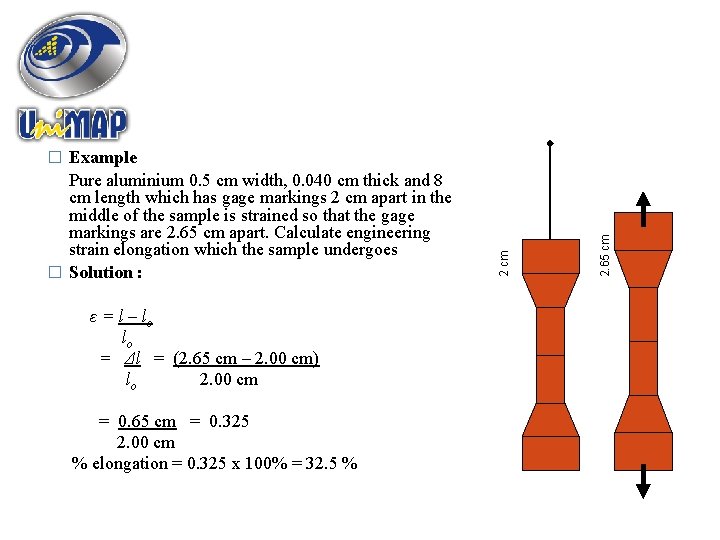
ε = l – lo lo = Δl = (2. 65 cm – 2. 00 cm) lo 2. 00 cm = 0. 65 cm = 0. 325 2. 00 cm % elongation = 0. 325 x 100% = 32. 5 % 2. 65 cm Pure aluminium 0. 5 cm width, 0. 040 cm thick and 8 cm length which has gage markings 2 cm apart in the middle of the sample is strained so that the gage markings are 2. 65 cm apart. Calculate engineering strain elongation which the sample undergoes � Solution : 2 cm � Example
PLASTIC DEFORMATION � Most metallic materials, elastic deformation persists only to strains of about 0. 005. � PLASTIC DEFORMATION ; Cannot fully recover to original dimensions Atoms permanently displaced and take up new positions. - involved the breaking of bonds with original atom neighbors and then reforming bonds with new neighbors, upon removal of the stress they do not return to their original positions.
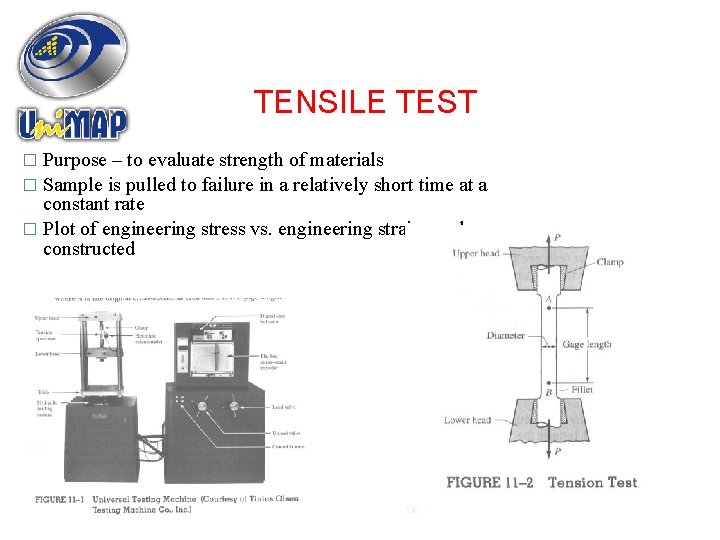
TENSILE TEST � Purpose – to evaluate strength of materials � Sample is pulled to failure in a relatively short time at a constant rate � Plot of engineering stress vs. engineering strain can be constructed
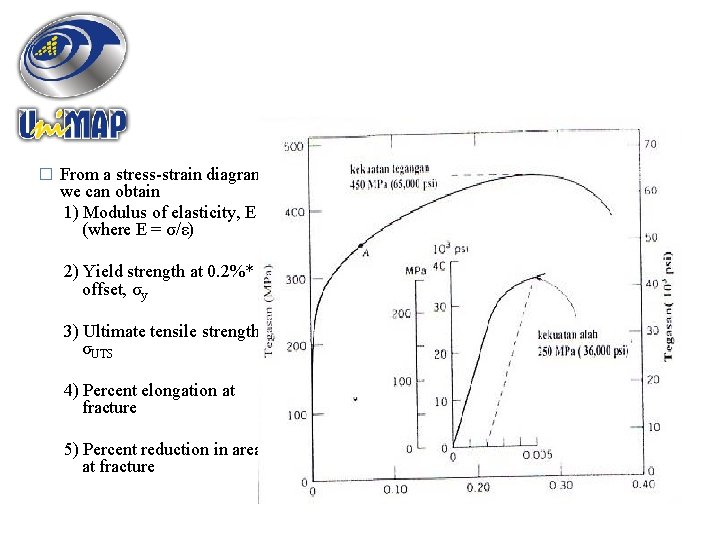
� From a stress-strain diagram we can obtain 1) Modulus of elasticity, E (where E = σ/ε) 2) Yield strength at 0. 2%* offset, σy 3) Ultimate tensile strength, σUTS 4) Percent elongation at fracture 5) Percent reduction in area at fracture
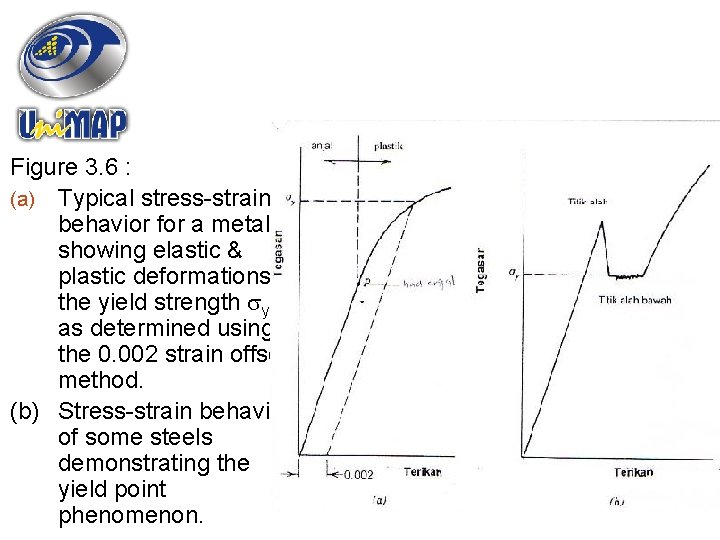
Figure 3. 6 : (a) Typical stress-strain behavior for a metal showing elastic & plastic deformations, the yield strength y as determined using the 0. 002 strain offset method. (b) Stress-strain behavior of some steels demonstrating the yield point phenomenon.
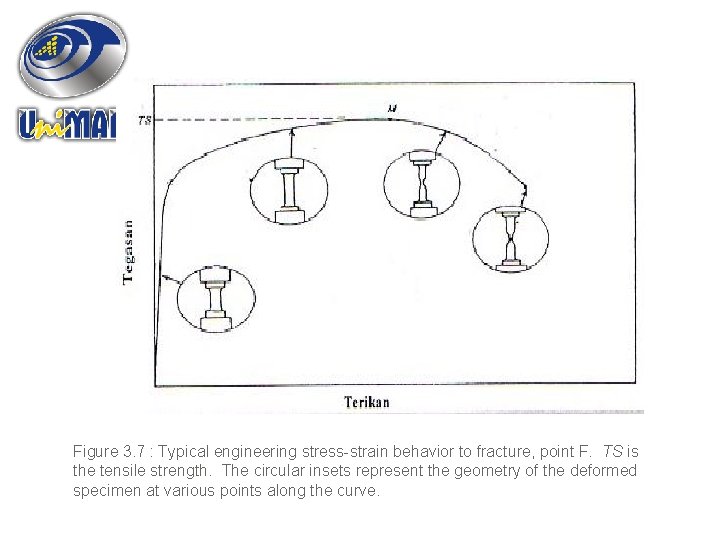
Figure 3. 7 : Typical engineering stress-strain behavior to fracture, point F. TS is the tensile strength. The circular insets represent the geometry of the deformed specimen at various points along the curve.
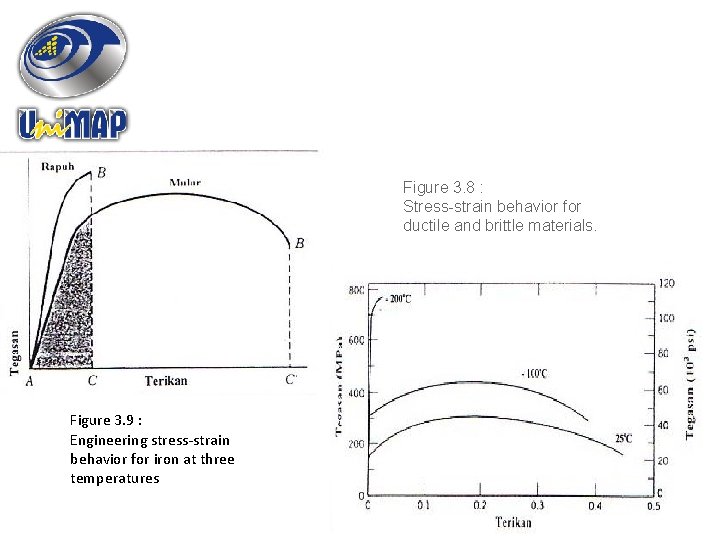
Figure 3. 8 : Stress-strain behavior for ductile and brittle materials. Figure 3. 9 : Engineering stress-strain behavior for iron at three temperatures
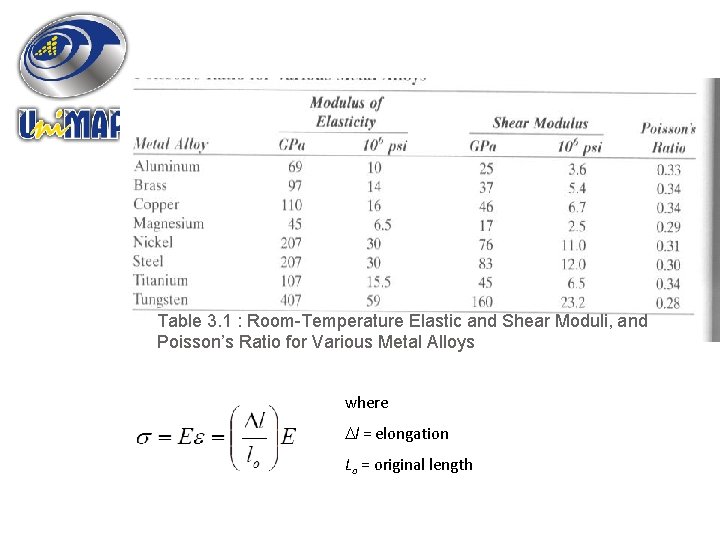
Table 3. 1 : Room-Temperature Elastic and Shear Moduli, and Poisson’s Ratio for Various Metal Alloys where l = elongation Lo = original length
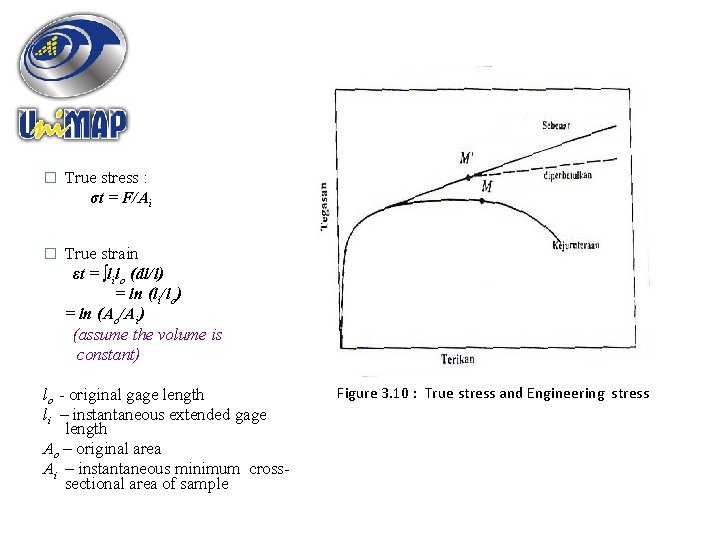
� True stress : σt = F/Ai � True strain εt = ∫lilo (dl/l) = ln (li/lo) = ln (Ao/Ai) (assume the volume is constant) lo - original gage length li – instantaneous extended gage length Ao – original area Ai – instantaneous minimum crosssectional area of sample Figure 3. 10 : True stress and Engineering stress
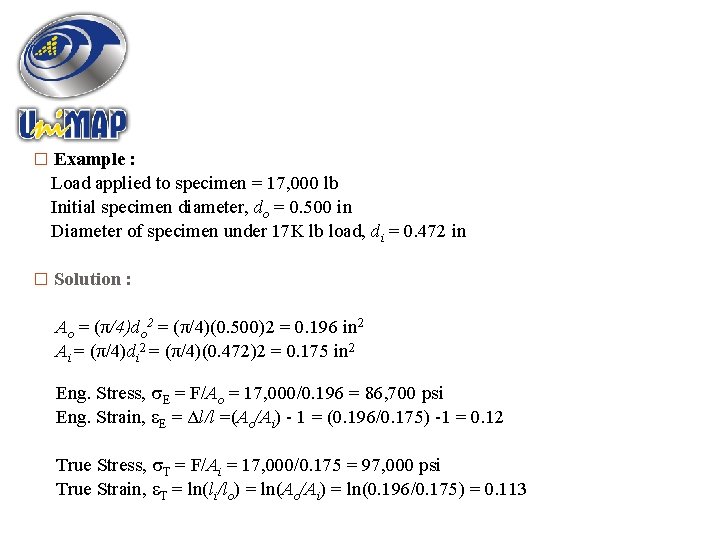
� Example : Load applied to specimen = 17, 000 lb Initial specimen diameter, do = 0. 500 in Diameter of specimen under 17 K lb load, di = 0. 472 in � Solution : Ao = (π/4)do 2 = (π/4)(0. 500)2 = 0. 196 in 2 Ai = (π/4)di 2 = (π/4)(0. 472)2 = 0. 175 in 2 Eng. Stress, E = F/Ao = 17, 000/0. 196 = 86, 700 psi Eng. Strain, E = Δl/l =(Ao/Ai) - 1 = (0. 196/0. 175) -1 = 0. 12 True Stress, T = F/Ai = 17, 000/0. 175 = 97, 000 psi True Strain, T = ln(li/lo) = ln(Ao/Ai) = ln(0. 196/0. 175) = 0. 113
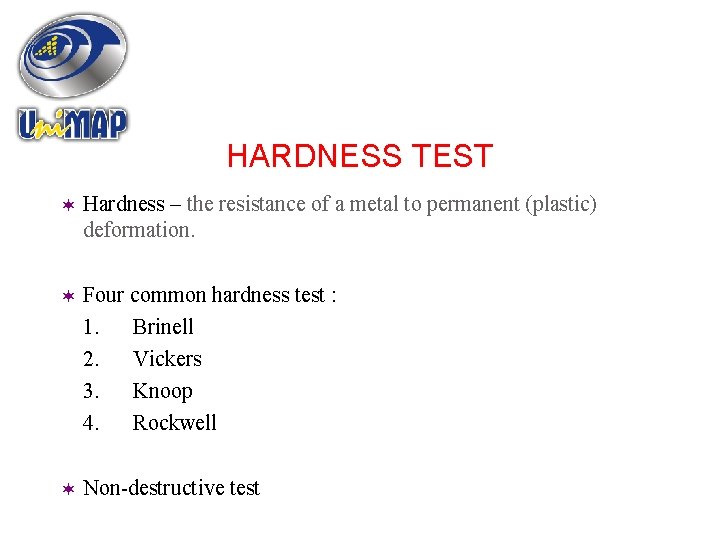
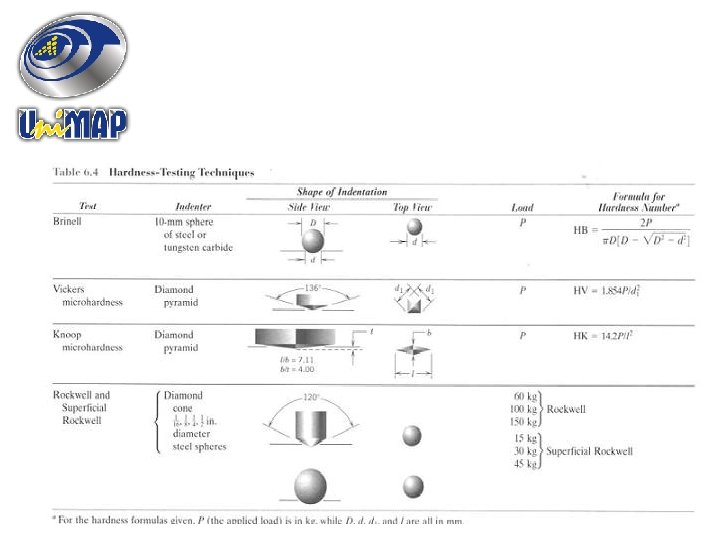
HARDNESS TEST Hardness – the resistance of a metal to permanent (plastic) deformation. Four common hardness test : 1. Brinell 2. Vickers 3. Knoop 4. Rockwell Non-destructive test
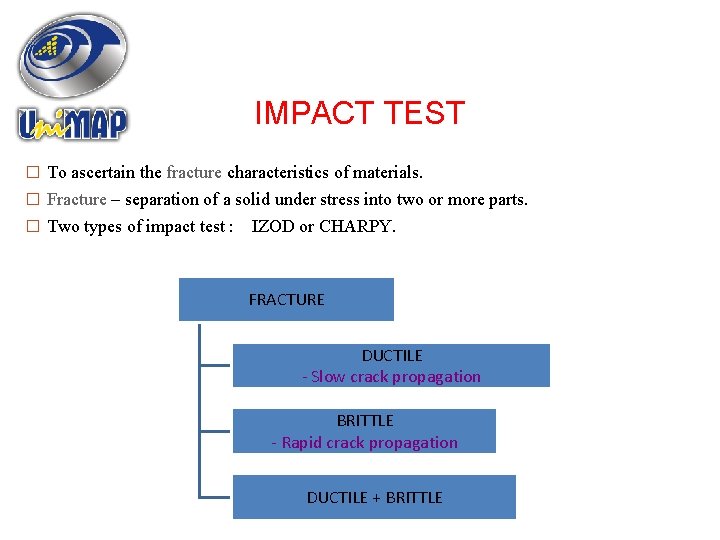
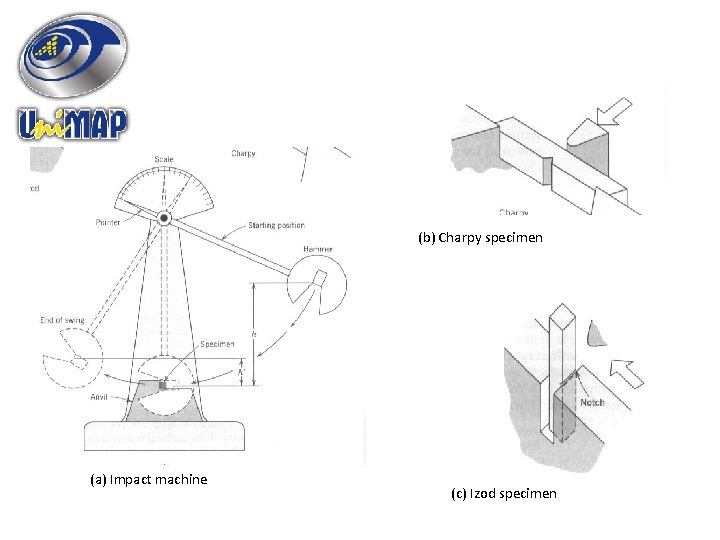
IMPACT TEST � To ascertain the fracture characteristics of materials. � Fracture – separation of a solid under stress into two or more parts. � Two types of impact test : IZOD or CHARPY. FRACTURE DUCTILE - Slow crack propagation BRITTLE - Rapid crack propagation DUCTILE + BRITTLE
(b) Charpy specimen (a) Impact machine (c) Izod specimen
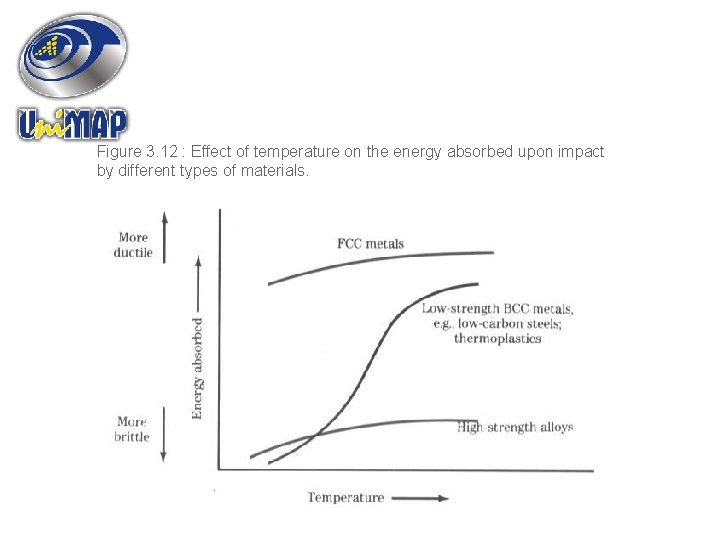
Figure 3. 12 : Effect of temperature on the energy absorbed upon impact by different types of materials.
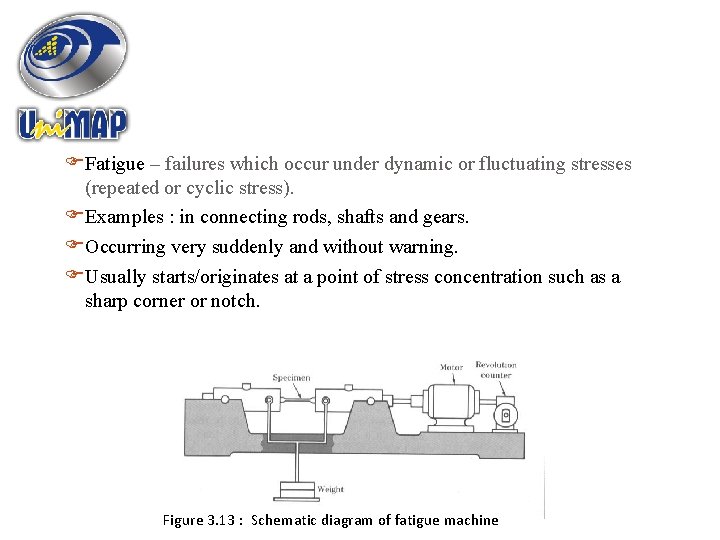
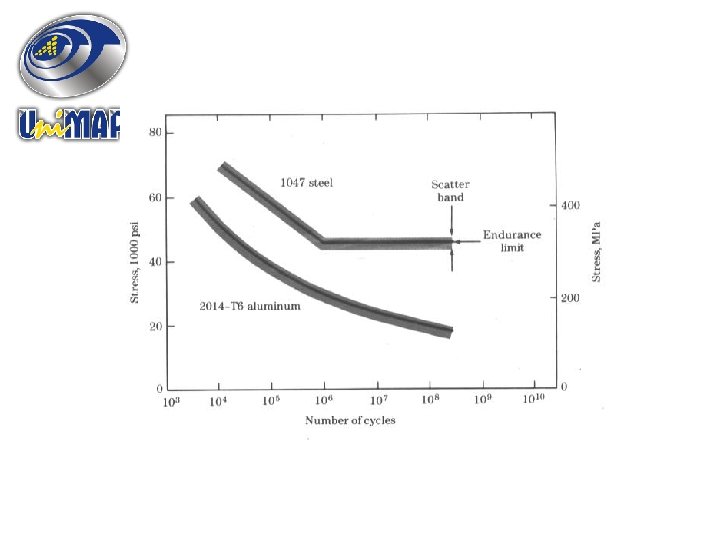
Fatigue – failures which occur under dynamic or fluctuating stresses (repeated or cyclic stress). Examples : in connecting rods, shafts and gears. Occurring very suddenly and without warning. Usually starts/originates at a point of stress concentration such as a sharp corner or notch. Figure 3. 13 : Schematic diagram of fatigue machine
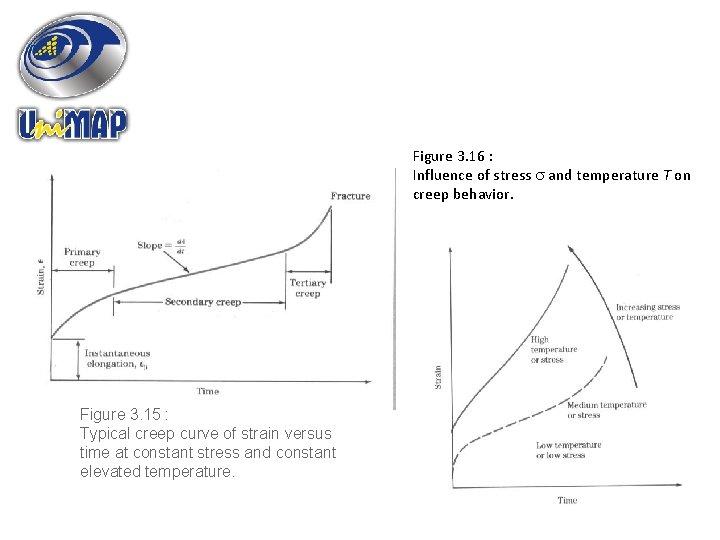
CREEP TEST � Creep – deformation under static load or stress at elevated temperature. � Examples : in high-pressure steam lines, turbine rotors in jet engines etc. � Time-independent and permanent deformation of materials. � For metals – only important when the service temperature > 0. 4 Tm (Tm = absolute melting temperature).
Figure 3. 16 : Influence of stress and temperature T on creep behavior. Figure 3. 15 : Typical creep curve of strain versus time at constant stress and constant elevated temperature.
SEKIAN TERIMA KASIH