Chapters 8 Linear Regression Correlation and Regression Correlation


 changes in relation to explanatory variable (x).")


 on horizontal axis. Residuals")


- Slides: 23
Chapters 8 Linear Regression
Correlation and Regression Correlation = linear relationship between two variables. Summarize relationship with line. Called Regression line. n n Explanatory variable (x) Response variable (y)
Regression line Explains how response variable (y) changes in relation to explanatory variable (x). Use line to predict value of y for given value of x.
Regression line Need mathematical formula. n Different lines by sight. Predict y from x. n The _________ values are called _______ w ___________________________________
Regression line Look at vertical distance Error in regression line. Place line to make these errors as small as possible.
Least squares regression Most commonly used regression line. Puts line where sum of the squared errors as small as possible. n Minimizes _______ Based on statistics
Regression line equation where
Regression line equation - slope b 1 = _________. n n Interpretation: ________________________________ Very important for interpreting data.
Regression line equation – intercept b 0 = _____________ n Interpretation: _______________________________________ n Usually not important for interpreting data. w Values of x are usually not close to 0.
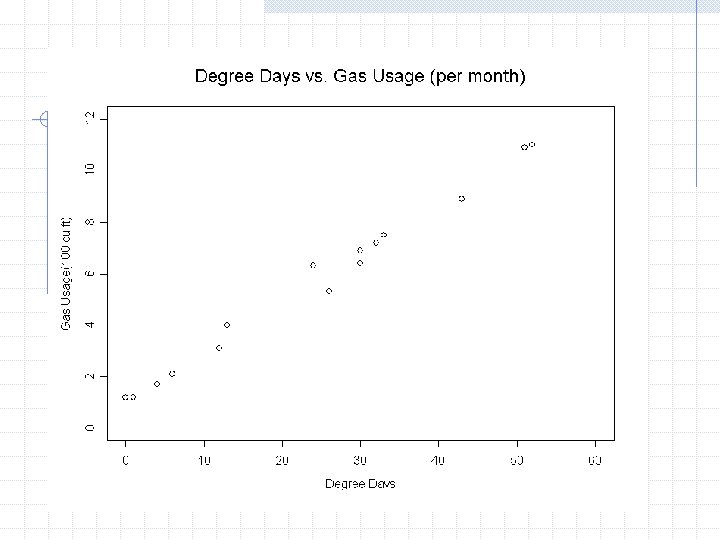
Calculating the regression line. Degree Days vs. Gas Usage
Calculating the regression line. Don’t forget to write the equation.
Interpretations Interpretation: Slope Interpretation: Intercept
Prediction Use regression equation to predict y from x. n n Ex. Predicted gas consumption when degree days = 43? Ex. Predicted gas consumption when degree days = 24?
Residuals Calculate n Ex. when degree days = 43? n Ex. when degree days = 24?
Residuals Variation in y not measured by regression line. Residual for each data point. Mean of residuals _________________
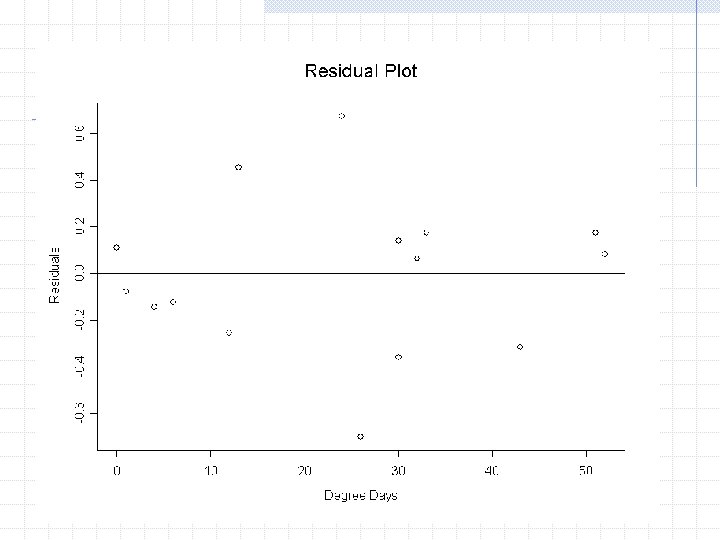
Residual Plot Special Scatterplot n n n Explanatory variable (x) on horizontal axis. Residuals (e) on vertical axis. Horizontal line at residual = 0. Good Residual Plot n n _________________
Example of Other Residual Plots
Properties of regression line Regression line always goes through point r is connected to the value of b 1.
Properties of R 2 Any value from _________ n ________________ Higher values of R 2 mean regression line ________________ Lower values of R 2 mean regression line ________________
Degree Days vs. Gas Usage n r = 0. 9953, R 2 = ________ n Interpretation:
Cautions about regression • Extrapolation is risky • Strong association between explanatory and response variables does not mean that explanatory variable causes response variable. n Ex: High positive correlation between number of TV sets person and average life expectancy.