
Chapter Seven The Structure of the United States





- Slides: 18
Chapter Seven: The Structure of the United States Economy
The Primary Sector in the United States
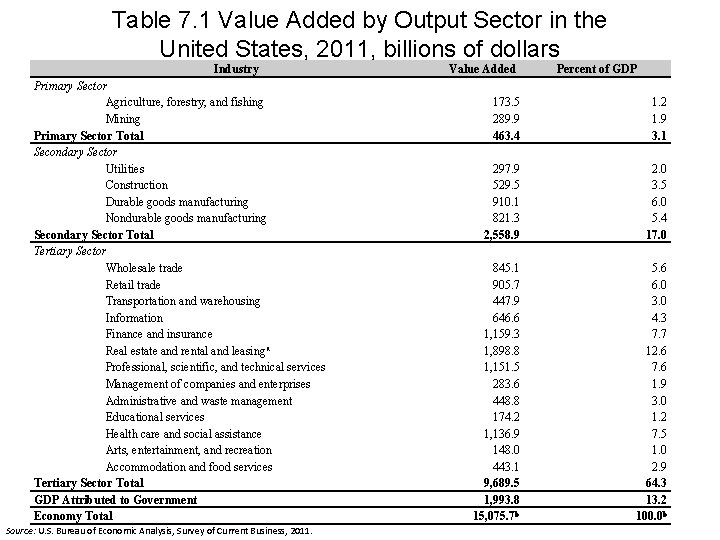
Table 7. 1 Value Added by Output Sector in the United States, 2011, billions of dollars Industry Primary Sector Agriculture, forestry, and fishing Mining Primary Sector Total Secondary Sector Utilities Construction Durable goods manufacturing Nondurable goods manufacturing Secondary Sector Total Tertiary Sector Wholesale trade Retail trade Transportation and warehousing Information Finance and insurance Real estate and rental and leasing a Professional, scientific, and technical services Management of companies and enterprises Administrative and waste management Educational services Health care and social assistance Arts, entertainment, and recreation Accommodation and food services Tertiary Sector Total GDP Attributed to Government Economy Total Source: U. S. Bureau of Economic Analysis, Survey of Current Business, 2011. Value Added Percent of GDP 173. 5 289. 9 463. 4 1. 2 1. 9 3. 1 297. 9 529. 5 910. 1 821. 3 2, 558. 9 2. 0 3. 5 6. 0 5. 4 17. 0 845. 1 905. 7 447. 9 646. 6 1, 159. 3 1, 898. 8 1, 151. 5 283. 6 448. 8 174. 2 1, 136. 9 148. 0 443. 1 9, 689. 5 1, 993. 8 15, 075. 7 b 5. 6 6. 0 3. 0 4. 3 7. 7 12. 6 7. 6 1. 9 3. 0 1. 2 7. 5 1. 0 2. 9 64. 3 13. 2 100. 0 b
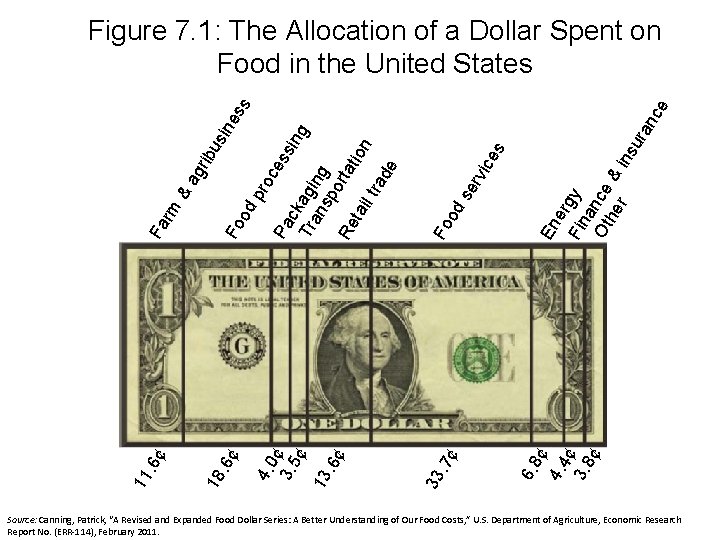
ura n erg Fin y a Ot nce he & r ins En od Fo ¢ 33. 7 6. 8 ¢ 4. 4 ¢ 3. 8 ¢ ice s se rv ce Pa ss ck ing Tr agi an ng sp ort Re ati tai on l tr ad e 4. 0 3. 5¢ ¢ 13. 6¢ od Fo ¢ 18. 6 11. 6 ¢ Fa rm & pro ag rib us in es ce s Figure 7. 1: The Allocation of a Dollar Spent on Food in the United States Source: Canning, Patrick, “A Revised and Expanded Food Dollar Series: A Better Understanding of Our Food Costs, ” U. S. Department of Agriculture, Economic Research Report No. (ERR-114), February 2011.
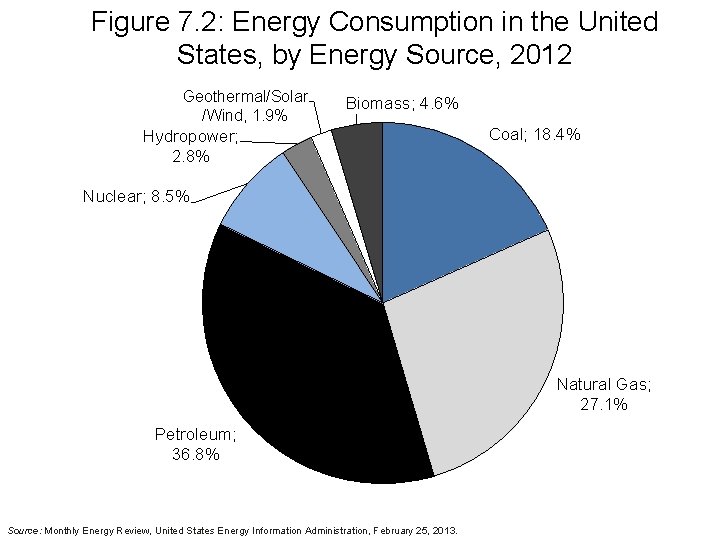
Figure 7. 2: Energy Consumption in the United States, by Energy Source, 2012 Geothermal/Solar /Wind, 1. 9% Biomass; 4. 6% Hydropower; 2. 8% Coal; 18. 4% Nuclear; 8. 5% Natural Gas; 27. 1% Petroleum; 36. 8% Source: Monthly Energy Review, United States Energy Information Administration, February 25, 2013.
The Secondary (Industrial) Sector in the United States
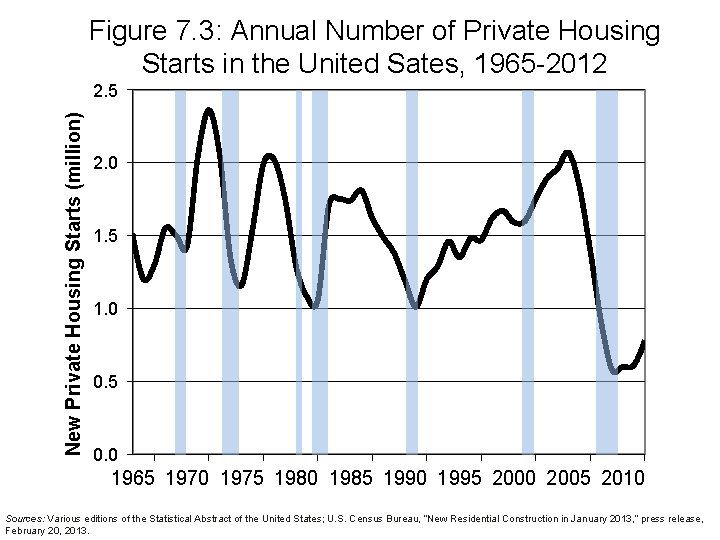
Figure 7. 3: Annual Number of Private Housing Starts in the United Sates, 1965 -2012 New Private Housing Starts (million) 2. 5 2. 0 1. 5 1. 0 0. 5 0. 0 1965 1970 1975 1980 1985 1990 1995 2000 2005 2010 Sources: Various editions of the Statistical Abstract of the United States; U. S. Census Bureau, “New Residential Construction in January 2013, ” press release, February 20, 2013.
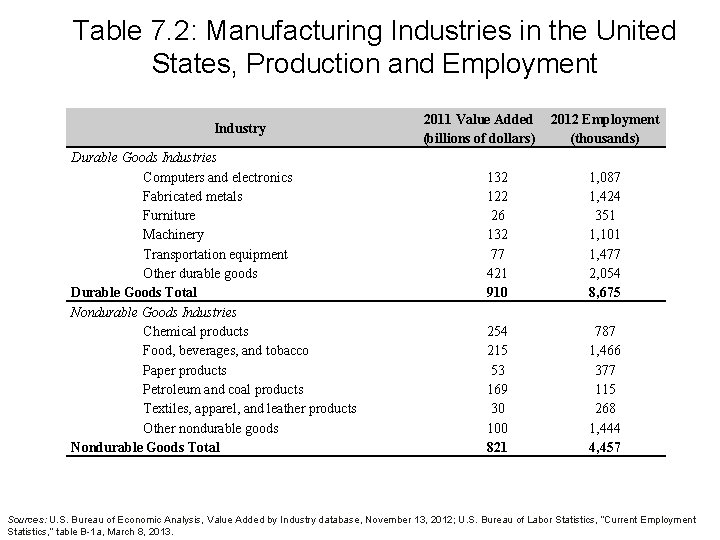
Table 7. 2: Manufacturing Industries in the United States, Production and Employment Industry Durable Goods Industries Computers and electronics Fabricated metals Furniture Machinery Transportation equipment Other durable goods Durable Goods Total Nondurable Goods Industries Chemical products Food, beverages, and tobacco Paper products Petroleum and coal products Textiles, apparel, and leather products Other nondurable goods Nondurable Goods Total 2011 Value Added (billions of dollars) 2012 Employment (thousands) 132 122 26 132 77 421 910 1, 087 1, 424 351 1, 101 1, 477 2, 054 8, 675 254 215 53 169 30 100 821 787 1, 466 377 115 268 1, 444 4, 457 Sources: U. S. Bureau of Economic Analysis, Value Added by Industry database, November 13, 2012; U. S. Bureau of Labor Statistics, “Current Employment Statistics, ” table B-1 a, March 8, 2013.
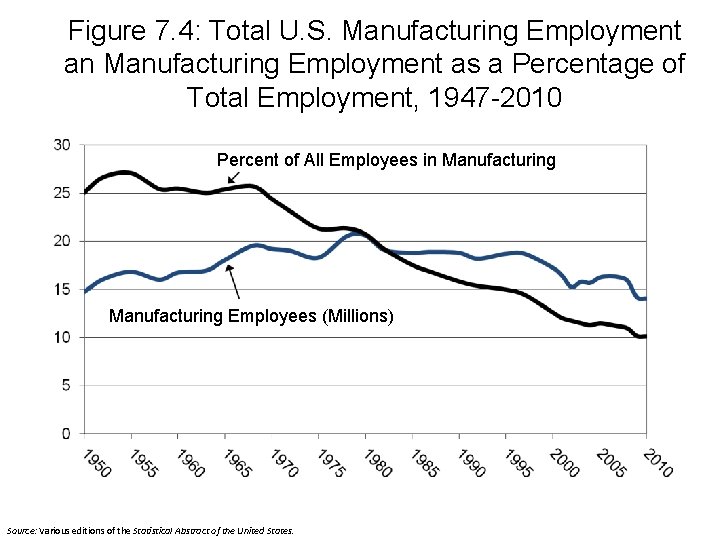
Figure 7. 4: Total U. S. Manufacturing Employment an Manufacturing Employment as a Percentage of Total Employment, 1947 -2010 Percent of All Employees in Manufacturing Employees (Millions) Source: Various editions of the Statistical Abstract of the United States.
The Tertiary (Service Sector)
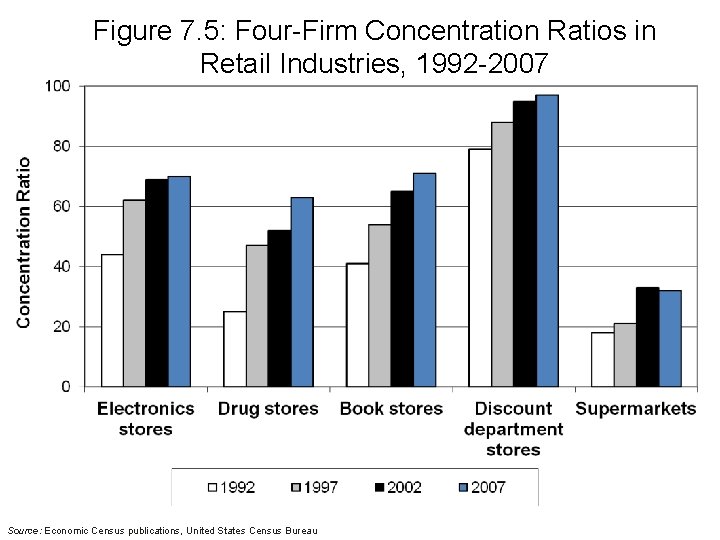
Figure 7. 5: Four-Firm Concentration Ratios in Retail Industries, 1992 -2007 Source: Economic Census publications, United States Census Bureau
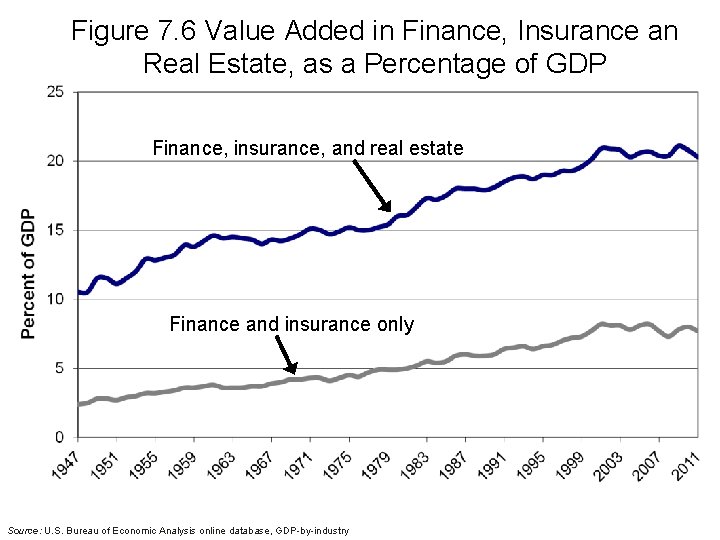
Figure 7. 6 Value Added in Finance, Insurance an Real Estate, as a Percentage of GDP Finance, insurance, and real estate Finance and insurance only Source: U. S. Bureau of Economic Analysis online database, GDP-by-industry
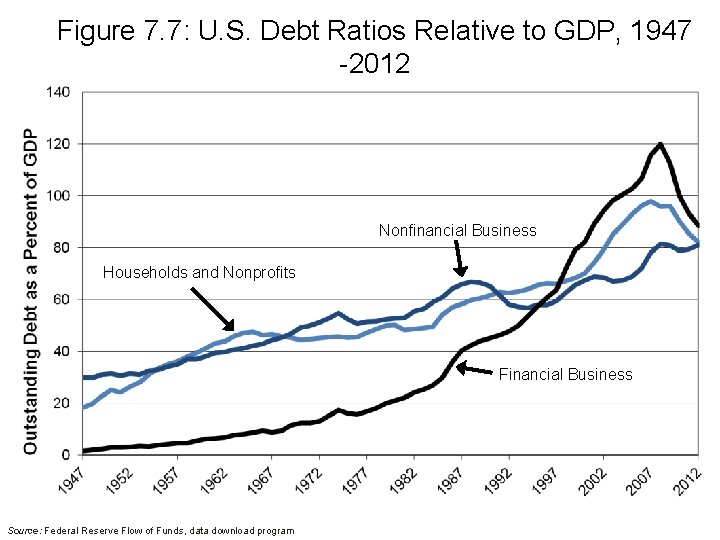
Figure 7. 7: U. S. Debt Ratios Relative to GDP, 1947 -2012 Nonfinancial Business Households and Nonprofits Financial Business Source: Federal Reserve Flow of Funds, data download program
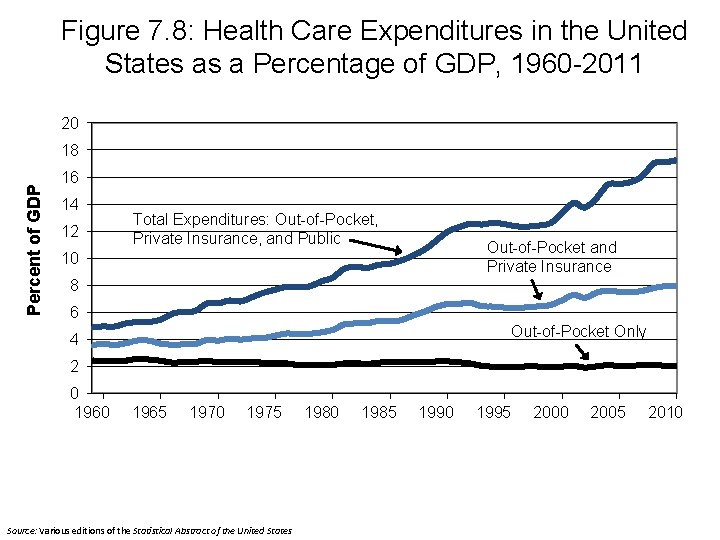
Figure 7. 8: Health Care Expenditures in the United States as a Percentage of GDP, 1960 -2011 20 Percent of GDP 18 16 14 12 Total Expenditures: Out-of-Pocket, Private Insurance, and Public Out-of-Pocket and Private Insurance 10 8 6 Out-of-Pocket Only 4 2 0 1965 1970 1975 Source: Various editions of the Statistical Abstract of the United States 1980 1985 1990 1995 2000 2005 2010
Appendix
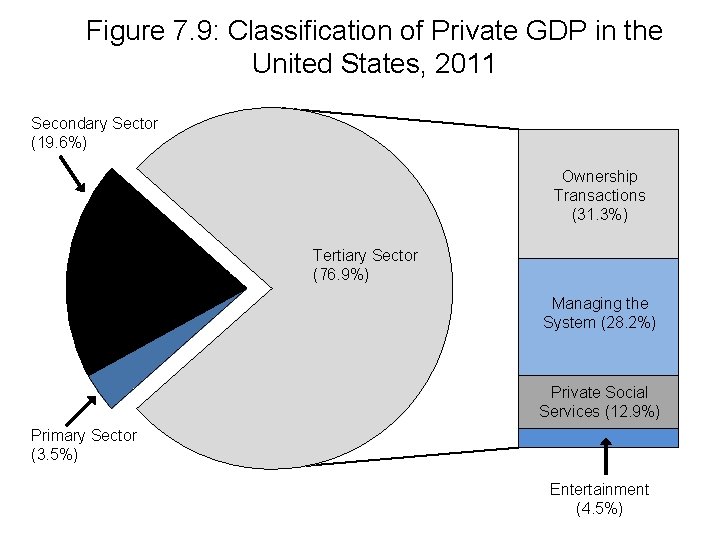
Figure 7. 9: Classification of Private GDP in the United States, 2011 Secondary Sector (19. 6%) Ownership Transactions (31. 3%) Tertiary Sector (76. 9%) Managing the System (28. 2%) Private Social Services (12. 9%) Primary Sector (3. 5%) Entertainment (4. 5%)
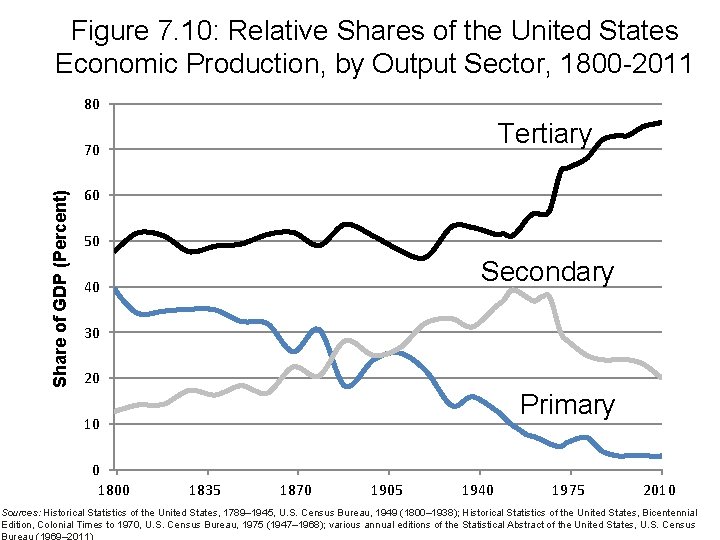
Figure 7. 10: Relative Shares of the United States Economic Production, by Output Sector, 1800 -2011 80 Tertiary Share of GDP (Percent) 70 60 50 Secondary 40 30 20 Primary 10 0 1800 1835 1870 1905 1940 1975 2010 Sources: Historical Statistics of the United States, 1789– 1945, U. S. Census Bureau, 1949 (1800– 1938); Historical Statistics of the United States, Bicentennial Edition, Colonial Times to 1970, U. S. Census Bureau, 1975 (1947– 1968); various annual editions of the Statistical Abstract of the United States, U. S. Census Bureau (1969– 2011)
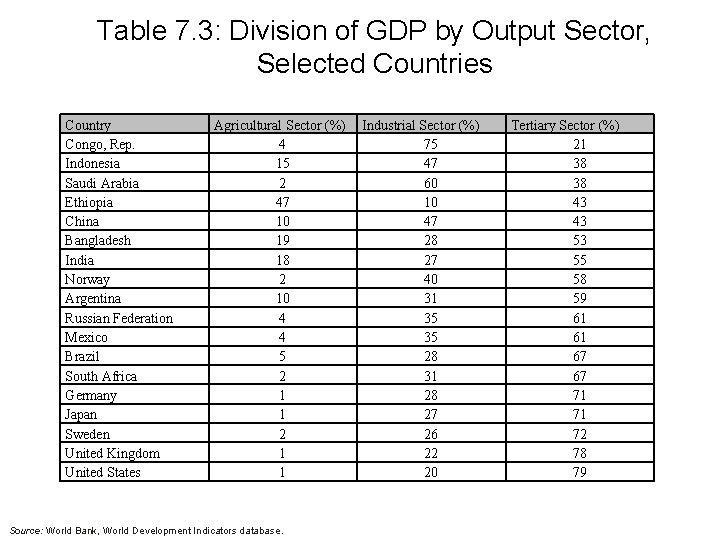
Table 7. 3: Division of GDP by Output Sector, Selected Countries Country Congo, Rep. Indonesia Saudi Arabia Ethiopia China Bangladesh India Norway Argentina Russian Federation Mexico Brazil South Africa Germany Japan Sweden United Kingdom United States Agricultural Sector (%) 4 15 2 47 10 19 18 2 10 4 4 5 2 1 1 Source: World Bank, World Development Indicators database. Industrial Sector (%) 75 47 60 10 47 28 27 40 31 35 35 28 31 28 27 26 22 20 Tertiary Sector (%) 21 38 38 43 43 53 55 58 59 61 61 67 67 71 71 72 78 79