
Chapter M 2 Power Notes Process Cost Systems
- Slides: 36
Chapter M 2 Power Notes Process Cost Systems Learning Objectives 1. Comparing Job Order Costing and Process Costing 2. Physical Flows and Cost Flows for a Process Manufacturer 3. The First-In, First-Out (Fifo) Method 4. Bringing It All Together: The Cost of Production Report 5. Journal Entries for a Process Cost System 6. Using the Cost of Production Report for Decision Making 7. Just-in-Time Processing C 2 - 1
Chapter 1 Power Notes Process Cost Systems Slide # Power Note Topics 3 15 30 33 35 • • • Job Order and Process Cost Systems Process Cost Accounting: Steps 1, 2, 3, 4 Cost of Production Report Journal Entries for a Process Cost System Just-in-Time Processing Note: To select a topic, type the slide # and press Enter. C 2 - 2
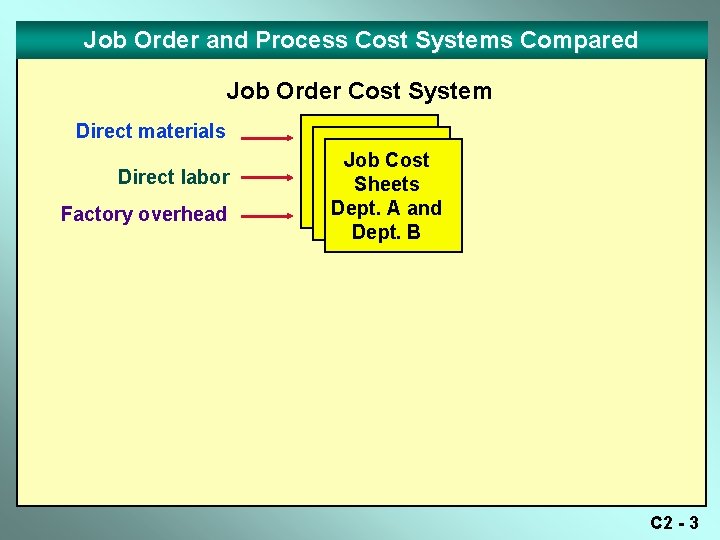
Job Order and Process Cost Systems Compared Job Order Cost System Direct materials Direct labor Factory overhead Job Cost Sheets Dept. A and Dept. B C 2 - 3
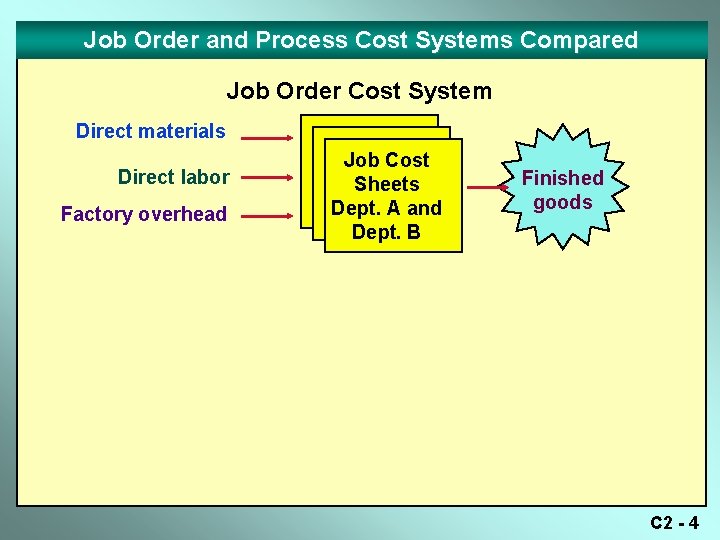
Job Order and Process Cost Systems Compared Job Order Cost System Direct materials Direct labor Factory overhead Job Cost Sheets Dept. A and Dept. B Finished goods C 2 - 4
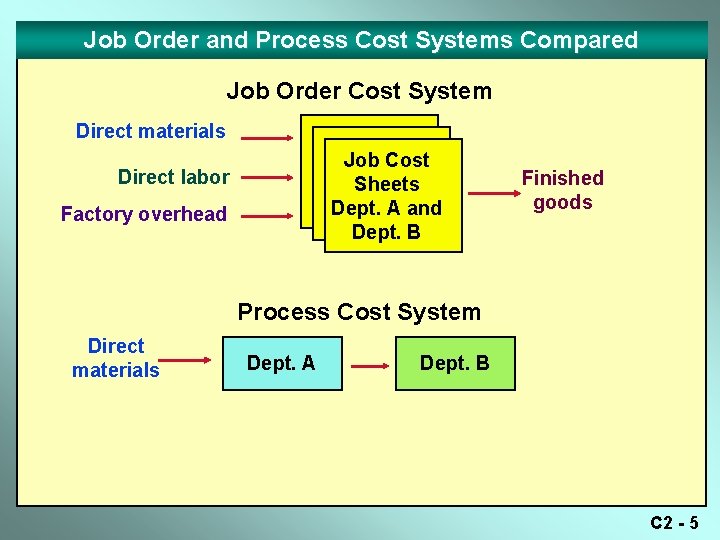
Job Order and Process Cost Systems Compared Job Order Cost System Direct materials Job Cost Sheets Dept. A and Dept. B Direct labor Factory overhead Finished goods Process Cost System Direct materials Dept. A Dept. B C 2 - 5
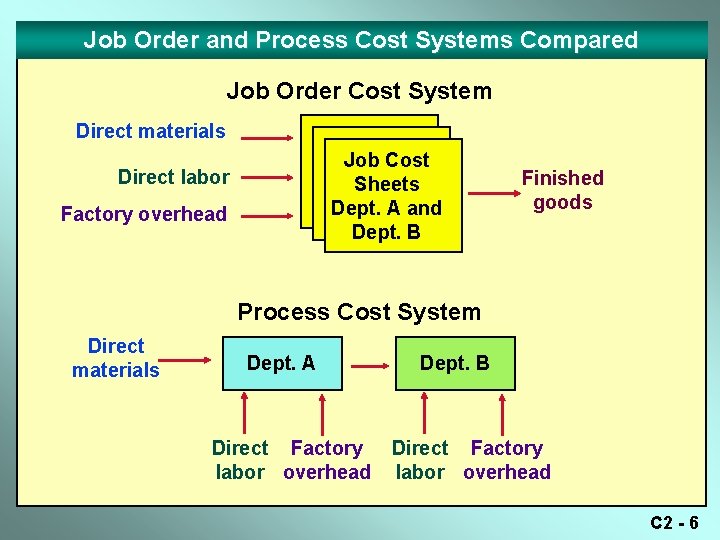
Job Order and Process Cost Systems Compared Job Order Cost System Direct materials Job Cost Sheets Dept. A and Dept. B Direct labor Factory overhead Finished goods Process Cost System Direct materials Dept. A Direct Factory labor overhead Dept. B Direct Factory labor overhead C 2 - 6
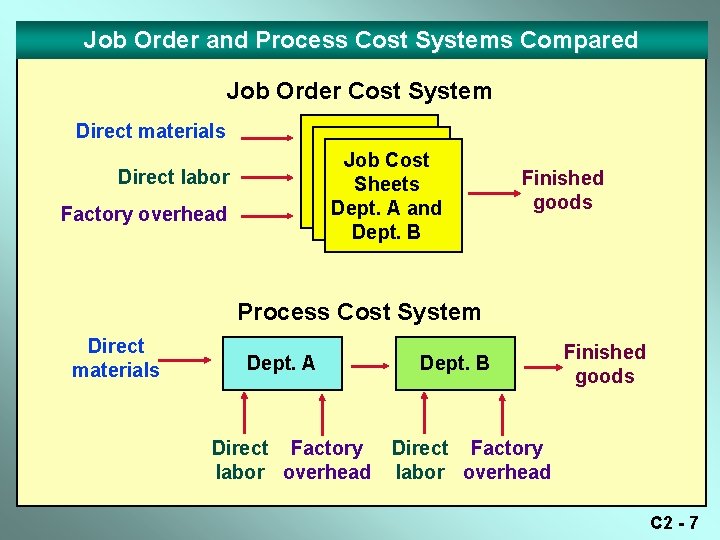
Job Order and Process Cost Systems Compared Job Order Cost System Direct materials Job Cost Sheets Dept. A and Dept. B Direct labor Factory overhead Finished goods Process Cost System Direct materials Dept. A Direct Factory labor overhead Dept. B Finished goods Direct Factory labor overhead C 2 - 7
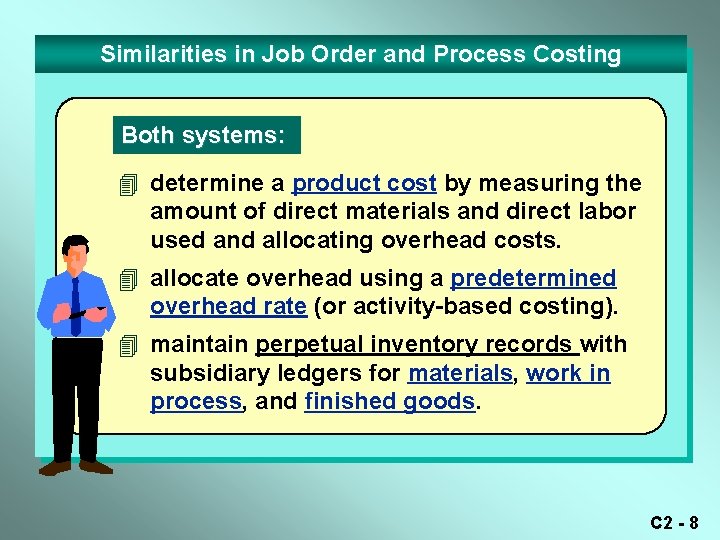
Similarities in Job Order and Process Costing Both systems: 4 determine a product cost by measuring the amount of direct materials and direct labor used and allocating overhead costs. 4 allocate overhead using a predetermined overhead rate (or activity-based costing). 4 maintain perpetual inventory records with subsidiary ledgers for materials, work in process, and finished goods. C 2 - 8
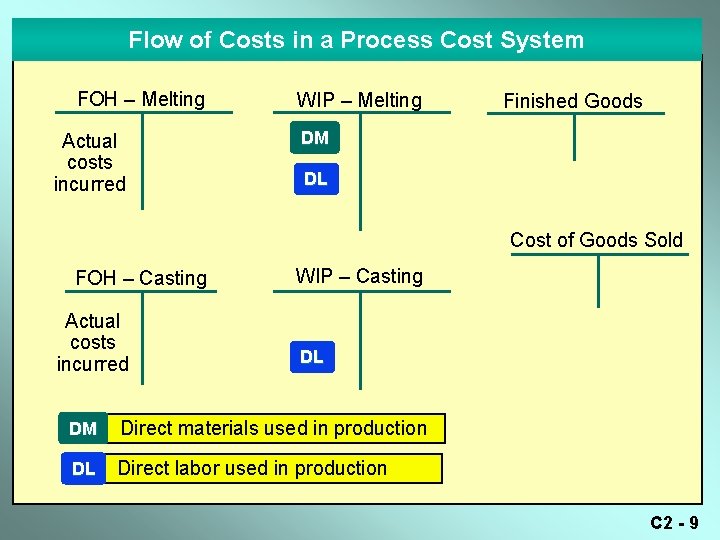
Flow of Costs in a Process Cost System FOH – Melting Actual costs incurred WIP – Melting Finished Goods DM DL Cost of Goods Sold FOH – Casting Actual costs incurred WIP – Casting DL DM Direct materials used in production DL Direct labor used in production C 2 - 9
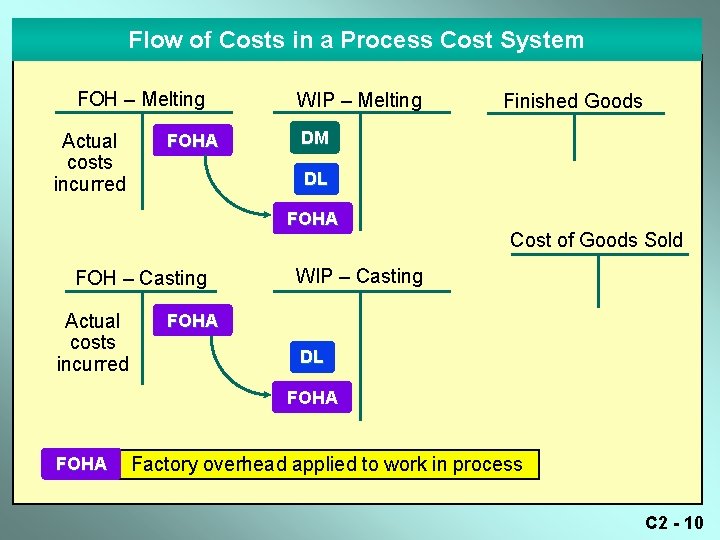
Flow of Costs in a Process Cost System FOH – Melting Actual costs incurred FOHA WIP – Melting DM DL FOHA FOH – Casting Actual costs incurred Finished Goods Cost of Goods Sold WIP – Casting FOHA DL FOHA Factory overhead applied to work in process C 2 - 10
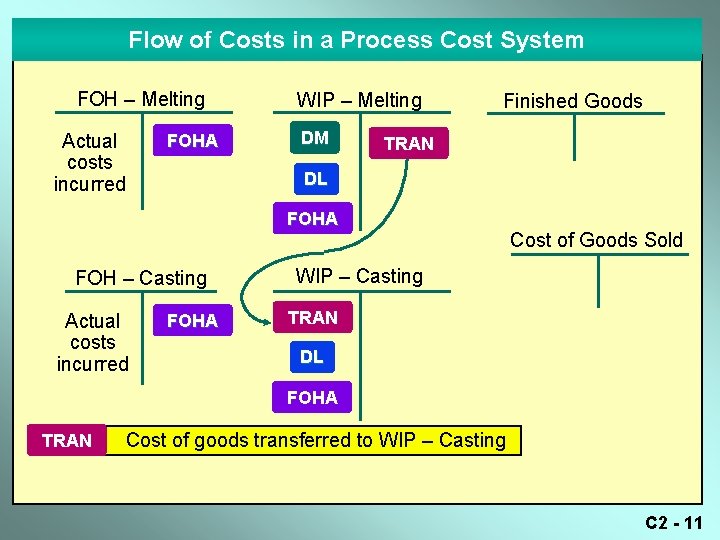
Flow of Costs in a Process Cost System FOH – Melting Actual costs incurred FOHA WIP – Melting DM Finished Goods TRAN DL FOHA FOH – Casting Actual costs incurred FOHA Cost of Goods Sold WIP – Casting TRAN DL FOHA TRAN Cost of goods transferred to WIP – Casting C 2 - 11
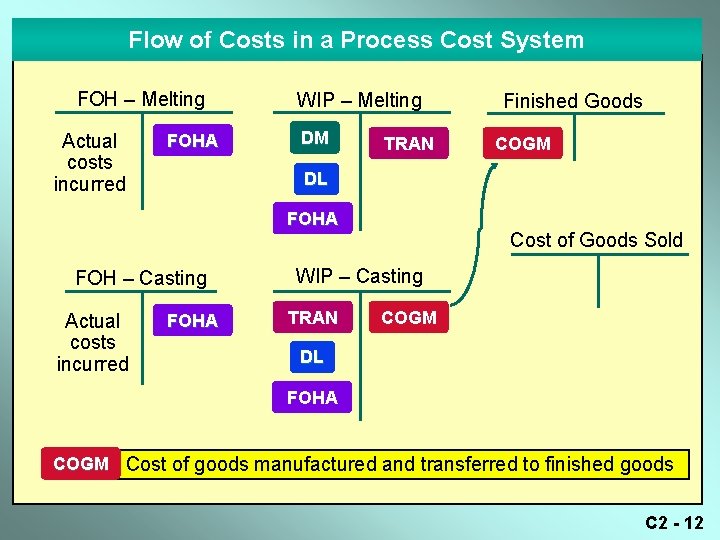
Flow of Costs in a Process Cost System FOH – Melting Actual costs incurred FOHA WIP – Melting DM TRAN COGM DL FOHA FOH – Casting Actual costs incurred Finished Goods FOHA Cost of Goods Sold WIP – Casting TRAN COGM DL FOHA COGM Cost of goods manufactured and transferred to finished goods C 2 - 12
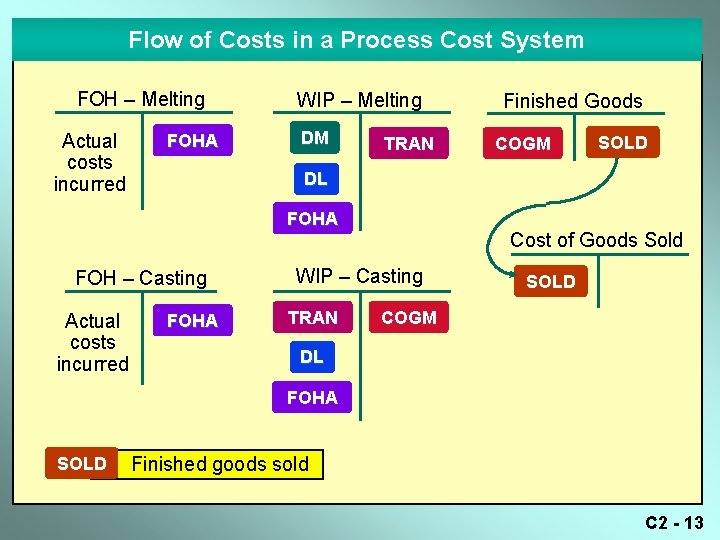
Flow of Costs in a Process Cost System FOH – Melting Actual costs incurred FOHA WIP – Melting DM TRAN COGM SOLD DL FOHA FOH – Casting Actual costs incurred Finished Goods FOHA Cost of Goods Sold WIP – Casting TRAN SOLD COGM DL FOHA SOLD Finished goods sold C 2 - 13
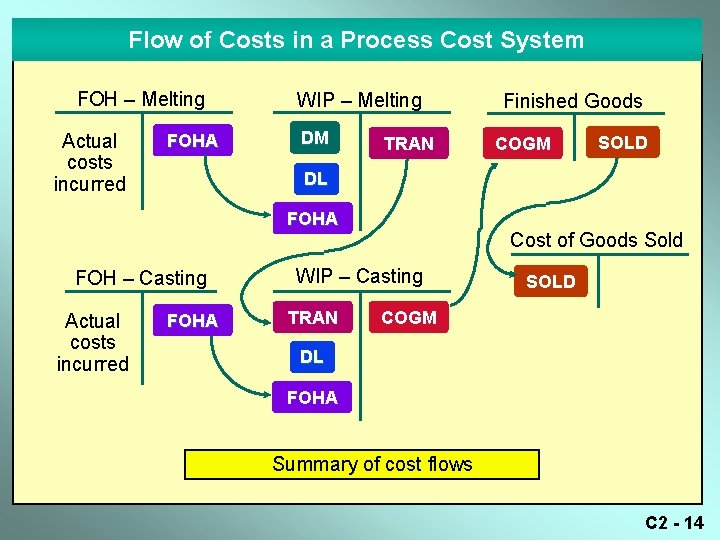
Flow of Costs in a Process Cost System FOH – Melting Actual costs incurred FOHA WIP – Melting DM TRAN COGM SOLD DL FOHA FOH – Casting Actual costs incurred Finished Goods FOHA Cost of Goods Sold WIP – Casting TRAN SOLD COGM DL FOHA Summary of cost flows C 2 - 14
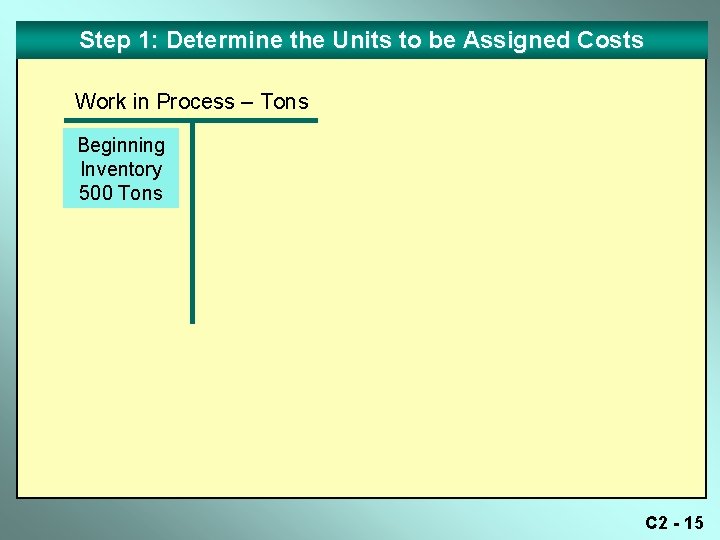
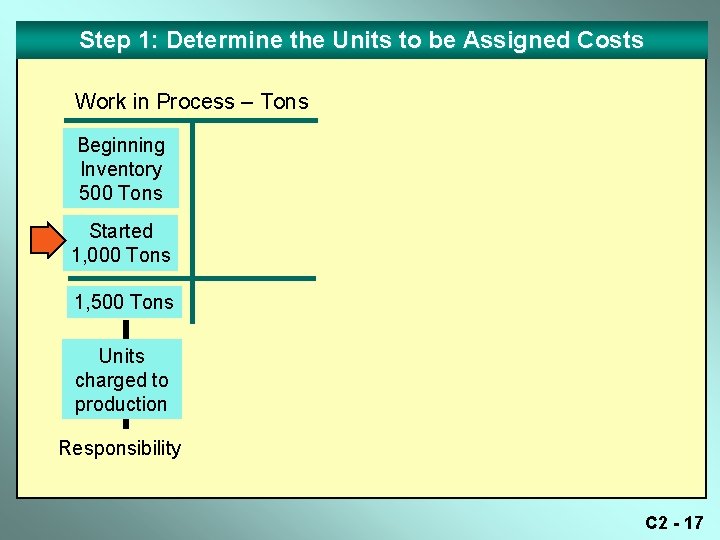
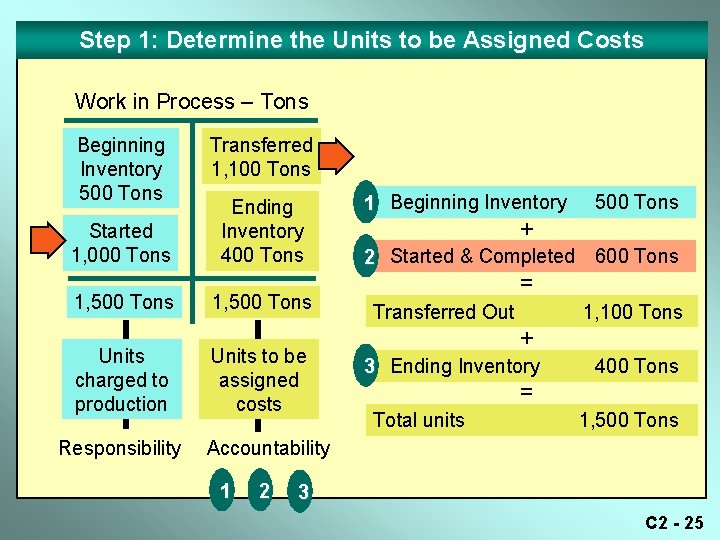
Step 1: Determine the Units to be Assigned Costs Work in Process – Tons Beginning Inventory 500 Tons C 2 - 15
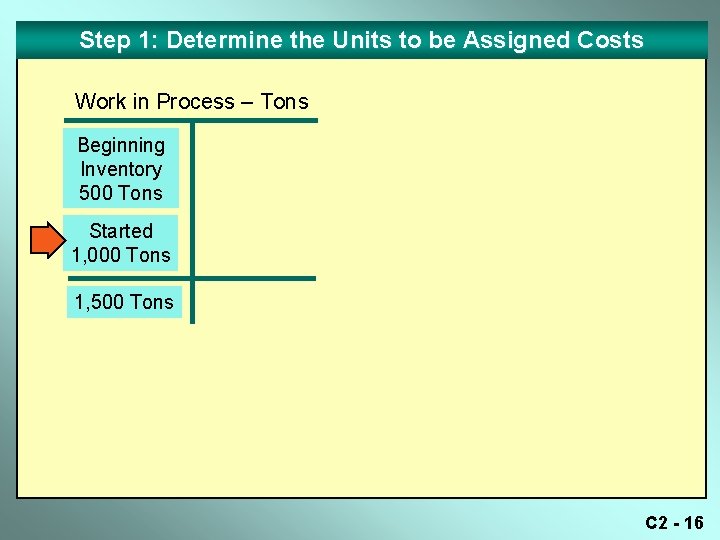
Step 1: Determine the Units to be Assigned Costs Work in Process – Tons Beginning Inventory 500 Tons Started 1, 000 Tons 1, 500 Tons C 2 - 16
Step 1: Determine the Units to be Assigned Costs Work in Process – Tons Beginning Inventory 500 Tons Started 1, 000 Tons 1, 500 Tons Units charged to production Responsibility C 2 - 17
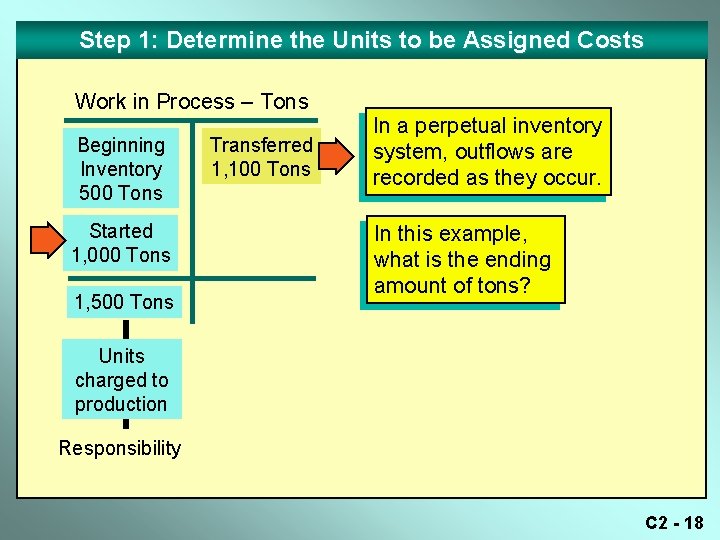
Step 1: Determine the Units to be Assigned Costs Work in Process – Tons Beginning Inventory 500 Tons Started 1, 000 Tons 1, 500 Tons Transferred 1, 100 Tons In a perpetual inventory system, outflows are recorded as they occur. In this example, what is the ending amount of tons? Units charged to production Responsibility C 2 - 18
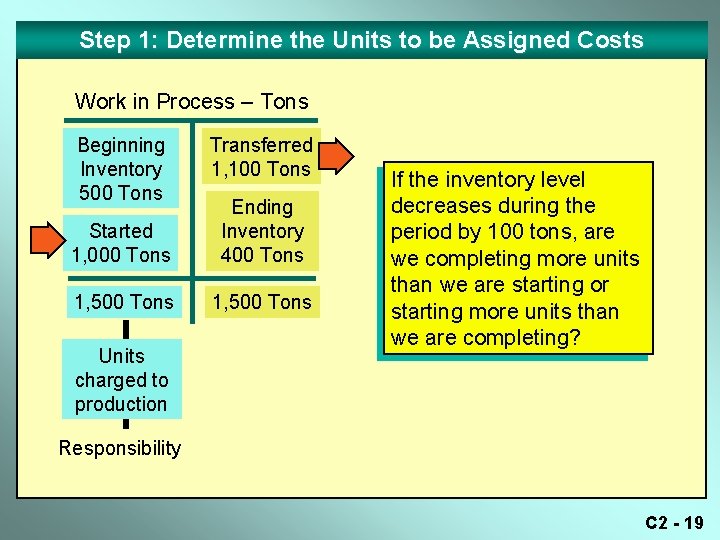
Step 1: Determine the Units to be Assigned Costs Work in Process – Tons Beginning Inventory 500 Tons Transferred 1, 100 Tons Started 1, 000 Tons Ending Inventory 400 Tons 1, 500 Tons Units charged to production If the inventory level decreases during the period by 100 tons, are we completing more units than we are starting or starting more units than we are completing? Responsibility C 2 - 19
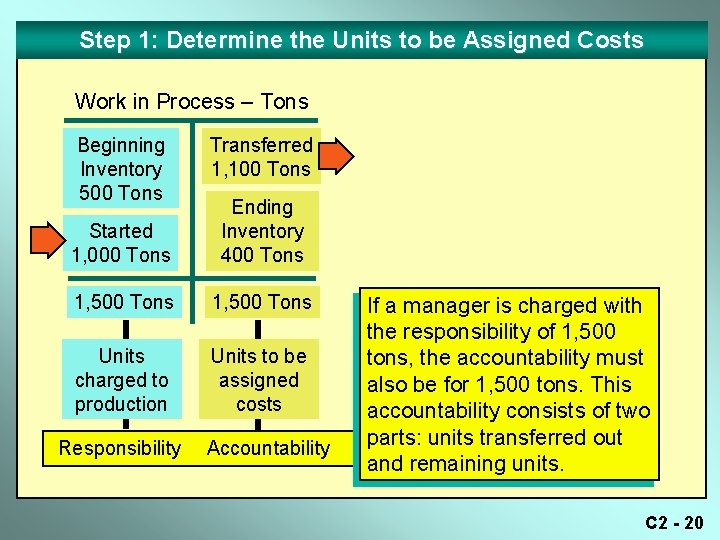
Step 1: Determine the Units to be Assigned Costs Work in Process – Tons Beginning Inventory 500 Tons Transferred 1, 100 Tons Started 1, 000 Tons Ending Inventory 400 Tons 1, 500 Tons Units charged to production Units to be assigned costs Responsibility Accountability If a manager is charged with the responsibility of 1, 500 tons, the accountability must also be for 1, 500 tons. This accountability consists of two parts: units transferred out and remaining units. C 2 - 20
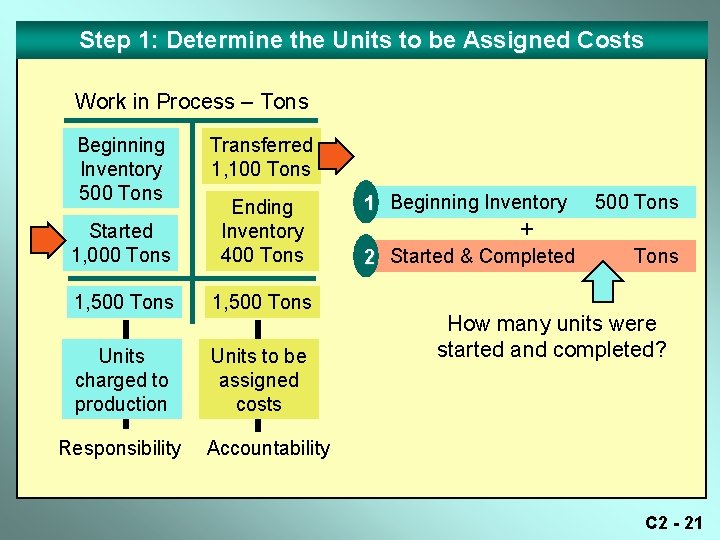
Step 1: Determine the Units to be Assigned Costs Work in Process – Tons Beginning Inventory 500 Tons Transferred 1, 100 Tons Started 1, 000 Tons Ending Inventory 400 Tons 1, 500 Tons Units charged to production Units to be assigned costs Responsibility 1 Beginning Inventory 500 Tons + 2 Started & Completed Tons How many units were started and completed? Accountability C 2 - 21
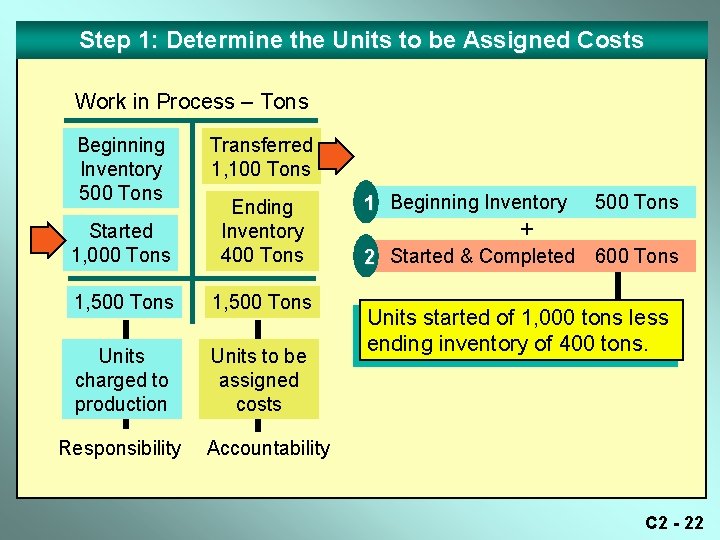
Step 1: Determine the Units to be Assigned Costs Work in Process – Tons Beginning Inventory 500 Tons Transferred 1, 100 Tons Started 1, 000 Tons Ending Inventory 400 Tons 1, 500 Tons Units charged to production Units to be assigned costs Responsibility 1 Beginning Inventory 500 Tons + 2 Started & Completed 600 Tons Units started of 1, 000 tons less ending inventory of 400 tons. Accountability C 2 - 22
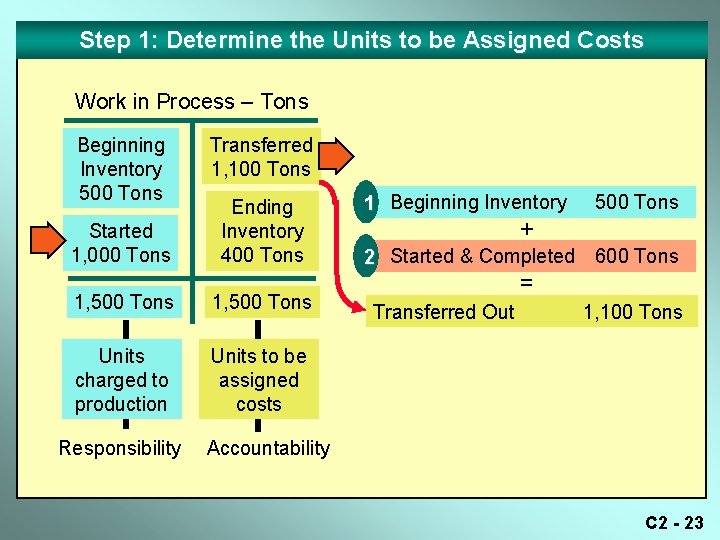
Step 1: Determine the Units to be Assigned Costs Work in Process – Tons Beginning Inventory 500 Tons Started 1, 000 Tons Transferred 1, 100 Tons Ending Inventory 400 Tons 1, 500 Tons Units charged to production Units to be assigned costs Responsibility 1 Beginning Inventory 500 Tons + 2 Started & Completed 600 Tons = Transferred Out 1, 100 Tons Accountability C 2 - 23
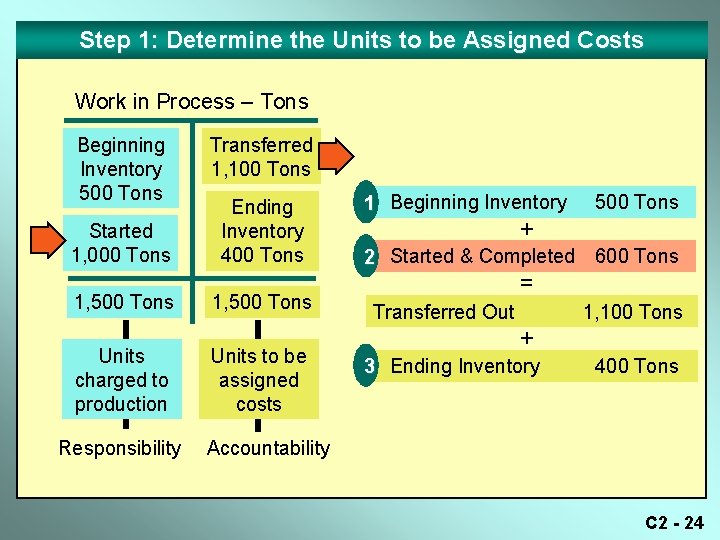
Step 1: Determine the Units to be Assigned Costs Work in Process – Tons Beginning Inventory 500 Tons Started 1, 000 Tons 1, 500 Tons Units charged to production Responsibility Transferred 1, 100 Tons Ending Inventory 400 Tons 1, 500 Tons Units to be assigned costs 1 Beginning Inventory 500 Tons + 2 Started & Completed 600 Tons = Transferred Out 1, 100 Tons + 3 Ending Inventory 400 Tons Accountability C 2 - 24
Step 1: Determine the Units to be Assigned Costs Work in Process – Tons Beginning Inventory 500 Tons Started 1, 000 Tons 1, 500 Tons Units charged to production Responsibility Transferred 1, 100 Tons Ending Inventory 400 Tons 1, 500 Tons Units to be assigned costs 1 Beginning Inventory 500 Tons + 2 Started & Completed 600 Tons = Transferred Out 1, 100 Tons + 3 Ending Inventory 400 Tons = Total units 1, 500 Tons Accountability 1 2 3 C 2 - 25
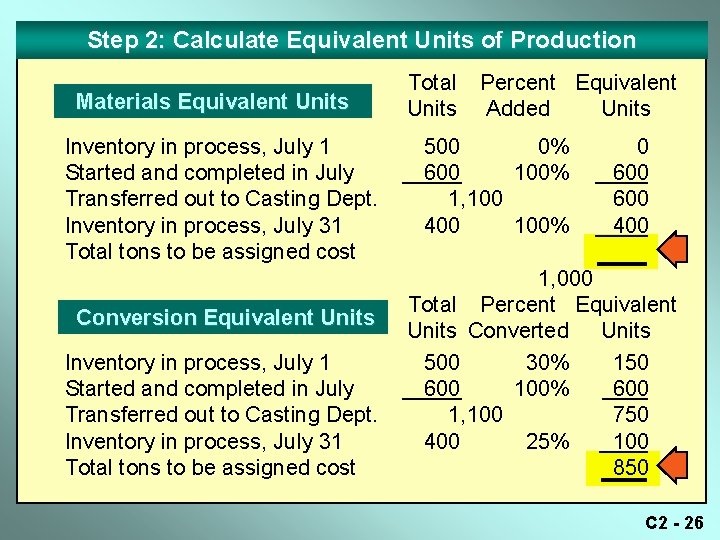
Step 2: Calculate Equivalent Units of Production Materials Equivalent Units Inventory in process, July 1 Started and completed in July Transferred out to Casting Dept. Inventory in process, July 31 Total tons to be assigned cost Conversion Equivalent Units Inventory in process, July 1 Started and completed in July Transferred out to Casting Dept. Inventory in process, July 31 Total tons to be assigned cost Total Units Percent Equivalent Added Units 500 0% 600 100% 1, 100 400 100% 0 600 400 1, 000 Total Percent Equivalent Units Converted Units 500 30% 150 600 100% 600 1, 100 750 400 25% 100 850 C 2 - 26
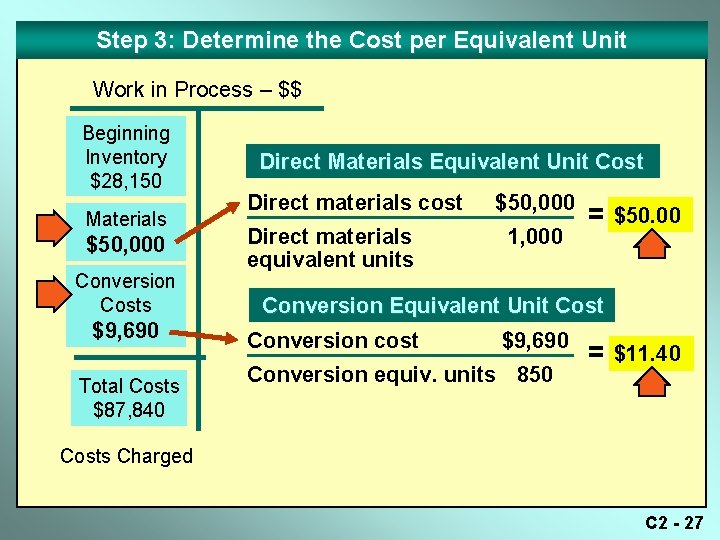
Step 3: Determine the Cost per Equivalent Unit Work in Process – $$ Beginning Inventory $28, 150 Materials $50, 000 Conversion Costs $9, 690 Total Costs $87, 840 Direct Materials Equivalent Unit Cost Direct materials cost Direct materials equivalent units $50, 000 1, 000 = $50. 00 Conversion Equivalent Unit Cost Conversion cost $9, 690 Conversion equiv. units 850 = $11. 40 Costs Charged C 2 - 27
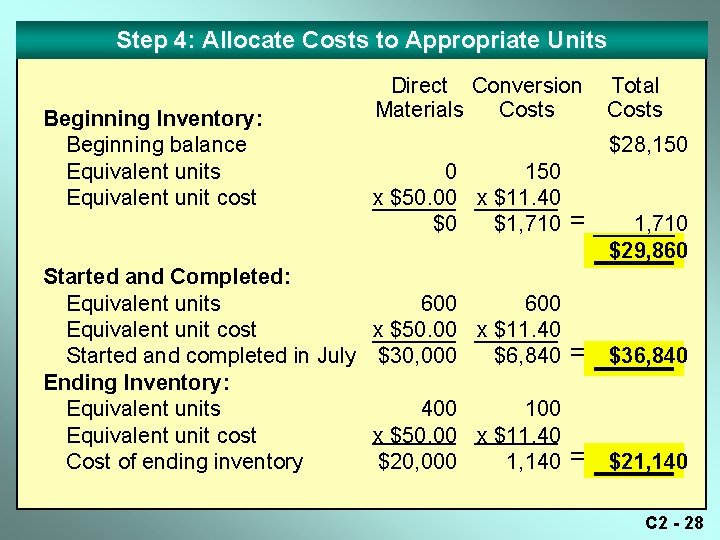
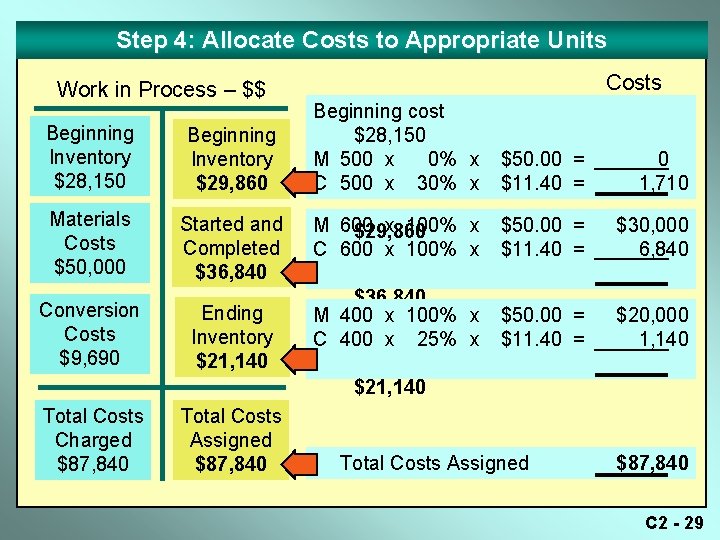
Step 4: Allocate Costs to Appropriate Units Beginning Inventory: Beginning balance Equivalent units Equivalent unit cost Started and Completed: Equivalent units Equivalent unit cost Started and completed in July Ending Inventory: Equivalent units Equivalent unit cost Cost of ending inventory Direct Conversion Materials Costs Total Costs $28, 150 0 150 x $50. 00 x $11. 40 $0 $1, 710 = 1, 710 $29, 860 600 x $50. 00 x $11. 40 $30, 000 $6, 840 = $36, 840 400 100 x $50. 00 x $11. 40 $20, 000 1, 140 = $21, 140 C 2 - 28
Step 4: Allocate Costs to Appropriate Units Work in Process – $$ Beginning Inventory $28, 150 Beginning Inventory $29, 860 Materials Costs $50, 000 Started and Completed $36, 840 Conversion Costs $9, 690 Ending Inventory $21, 140 Costs Beginning cost $28, 150 M 500 x 0% x C 500 x 30% x $50. 00 = $11. 40 = 0 1, 710 M 600 x 100% x $29, 860 C 600 x 100% x $50. 00 = $11. 40 = $30, 000 6, 840 $36, 840 M 400 x 100% x C 400 x 25% x $50. 00 = $11. 40 = $20, 000 1, 140 $21, 140 Total Costs Charged $87, 840 Total Costs Assigned $87, 840 C 2 - 29
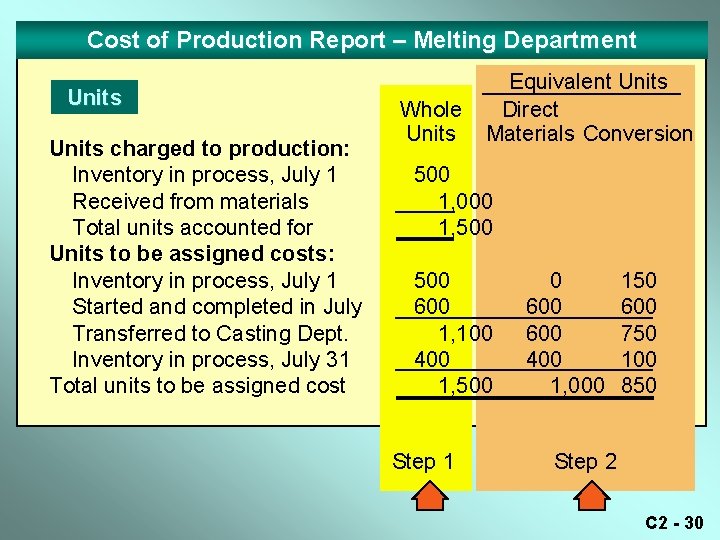
Cost of Production Report – Melting Department Units charged to production: Inventory in process, July 1 Received from materials Total units accounted for Units to be assigned costs: Inventory in process, July 1 Started and completed in July Transferred to Casting Dept. Inventory in process, July 31 Total units to be assigned cost Whole Units Equivalent Units Direct Materials Conversion 500 1, 000 1, 500 600 1, 100 400 1, 500 Step 1 0 600 400 1, 000 150 600 750 100 850 Step 2 C 2 - 30
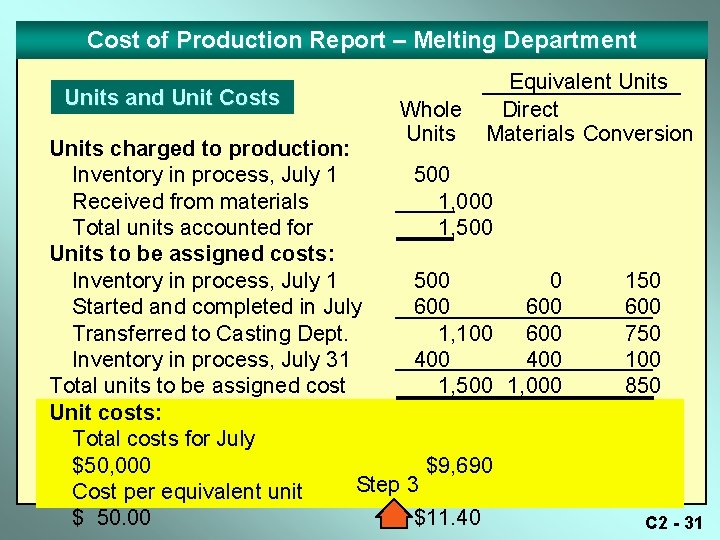
Cost of Production Report – Melting Department Units and Unit Costs Whole Units Equivalent Units Direct Materials Conversion Units charged to production: Inventory in process, July 1 500 Received from materials 1, 000 Total units accounted for 1, 500 Units to be assigned costs: Inventory in process, July 1 500 0 Started and completed in July 600 Transferred to Casting Dept. 1, 100 600 Inventory in process, July 31 400 Total units to be assigned cost 1, 500 1, 000 Unit costs: Total costs for July $50, 000 $9, 690 Step 3 Cost per equivalent unit $ 50. 00 $11. 40 150 600 750 100 850 C 2 - 31
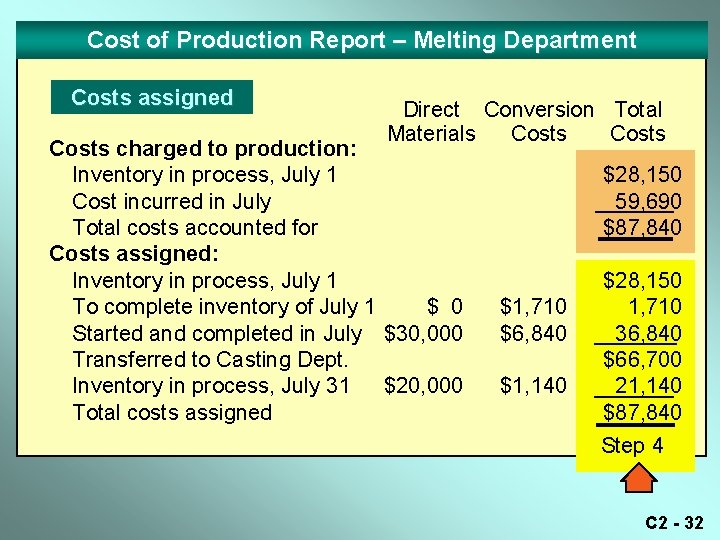
Cost of Production Report – Melting Department Costs assigned Direct Conversion Total Materials Costs charged to production: Inventory in process, July 1 Cost incurred in July Total costs accounted for Costs assigned: Inventory in process, July 1 To complete inventory of July 1 $ 0 Started and completed in July $30, 000 Transferred to Casting Dept. Inventory in process, July 31 $20, 000 Total costs assigned $28, 150 59, 690 $87, 840 $1, 710 $6, 840 $1, 140 $28, 150 1, 710 36, 840 $66, 700 21, 140 $87, 840 Step 4 C 2 - 32
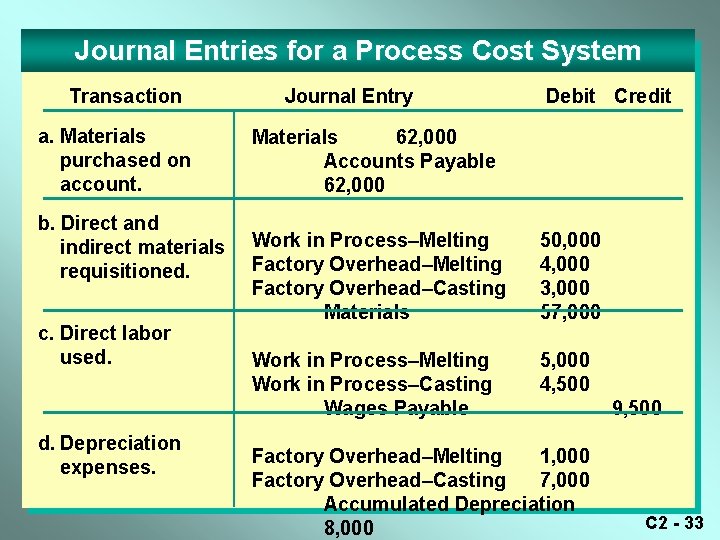
Journal Entries for a Process Cost System Transaction a. Materials purchased on account. b. Direct and indirect materials requisitioned. c. Direct labor used. d. Depreciation expenses. Journal Entry Debit Credit Materials 62, 000 Accounts Payable 62, 000 Work in Process–Melting Factory Overhead–Casting Materials 50, 000 4, 000 3, 000 57, 000 Work in Process–Melting Work in Process–Casting Wages Payable 5, 000 4, 500 Factory Overhead–Melting 1, 000 Factory Overhead–Casting 7, 000 Accumulated Depreciation 8, 000 9, 500 C 2 - 33
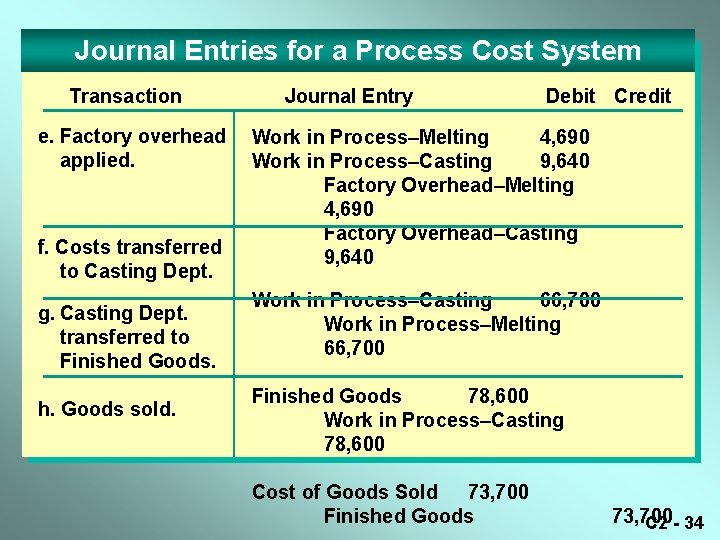
Journal Entries for a Process Cost System Transaction e. Factory overhead applied. f. Costs transferred to Casting Dept. g. Casting Dept. transferred to Finished Goods. h. Goods sold. Journal Entry Debit Credit Work in Process–Melting 4, 690 Work in Process–Casting 9, 640 Factory Overhead–Melting 4, 690 Factory Overhead–Casting 9, 640 Work in Process–Casting 66, 700 Work in Process–Melting 66, 700 Finished Goods 78, 600 Work in Process–Casting 78, 600 Cost of Goods Sold 73, 700 Finished Goods 73, 700 C 2 - 34
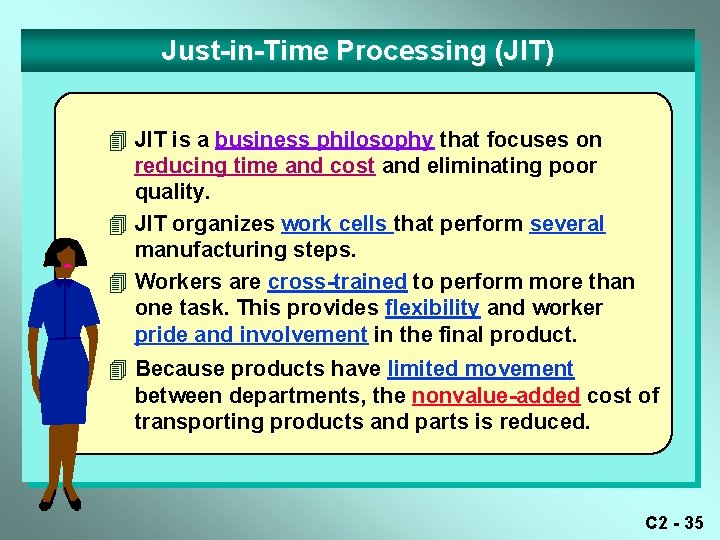
Just-in-Time Processing (JIT) 4 JIT is a business philosophy that focuses on reducing time and cost and eliminating poor quality. 4 JIT organizes work cells that perform several manufacturing steps. 4 Workers are cross-trained to perform more than one task. This provides flexibility and worker pride and involvement in the final product. 4 Because products have limited movement between departments, the nonvalue-added cost of transporting products and parts is reduced. C 2 - 35
Chapter M 2 Power Notes Process Cost Systems This is the last slide in Chapter M 2. Note: To see the topic slide, type 2 and press Enter. C 2 - 36