Chapter Introduction Section 1 What is Supply Section


 • Suppliers must determine how much to offer")
 • Normal supply curves have a positive slope—prices")
 • The quantity supplied is the amount producers")


 • A change in supply occurs for several reasons.")
 Cause Effect Result – Subsidy S↑ S↑ Shift R")


 • Supply, like demand, has elasticity. • Supply elasticity")
 • Supply elasticity has three forms: – Elastic –")
 • Supply elasticity is based solely on production considerations.")


 • Production can be illustrated with a production function.")
 • Long run changes involve other factors of production,")

 • In deciding how many workers to hire, firm")


 • There are several ways businesses measure costs. –")
 – Total cost(TC) = FC + VC – Marginal")


 • People engage in e-commerce conducted on the Internet")
 • After businesses measure their costs, they determine the")

 • Two key measures of revenue are")

 • Like businesses, we use marginal analysis")
 • Profit-maximizing quantity of output is reached")


 • first African American to be CEO of a")


 can")


- Slides: 100
Chapter Introduction Section 1: What is Supply? Section 2: Theory of Production Section 3: Cost, Revenue, and Profit Maximization Visual Summary
In order to earn some extra money, you are considering opening a lawn or babysitting service. What resources would you need? What specific services would you offer? What prices would you charge? What information do you need to determine answers to these and other questions?
Section Objectives Students will be able to: • Describe and give examples of the Law of Supply. • Identify and distinguish between a supply curve and a supply schedule. • Give examples between market supply and supply. • Describe the differences between a change in supply and a change in quantity supplied. • Describe and give examples of Supply Elasticity. • Identify and distinguish between a elastic, inelastic and unit elastic supply. • Demonstrate how the determinants of elasticity are used in identifying elasticity in supply.
1. Buyers and sellers voluntarily interact in markets, and market prices are set by the interaction of demand supply. 2. The profit motive acts as an incentive for people to produce and sell goods and services.
Have you ever gone to a store to buy something that was advertised as being on sale, only to discover the store was sold out of the item? A. Yes, happens all the time B. Yes, has happened a few times C. No, has never happened A. A B. B C. C
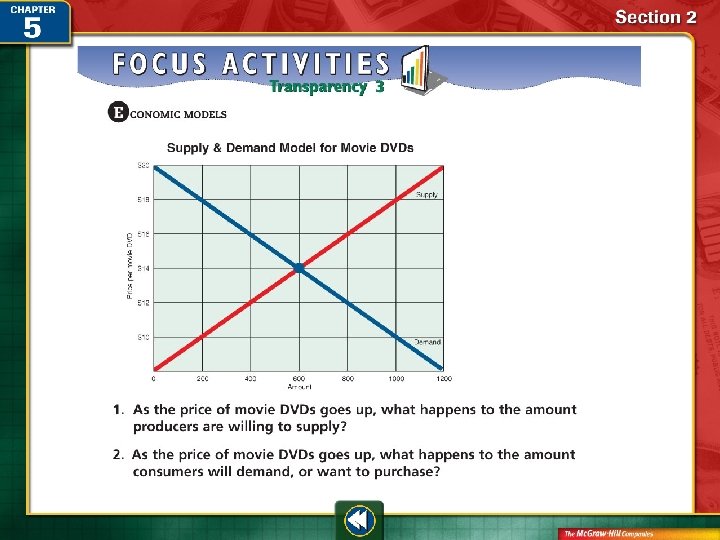
What is Supply? • Supply is an amount of product offered for sale at prevailing market prices. • Law of Supply: Producers will offer more product at higher prices and less at lower prices
An Introduction to Supply can be illustrated by a supply schedule or a supply curve.
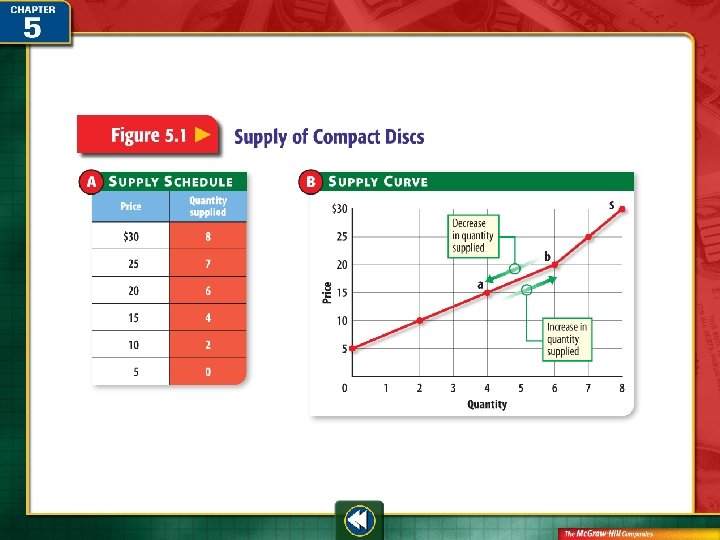
An Introduction to Supply (cont. ) • Suppliers must determine how much to offer for sale at various prices, taking into account the factors of production. • Like demand, supply can be shown in the form of a table—a supply schedule. • When information is plotted on a graph, it forms the supply curve. Supply of Compact Discs
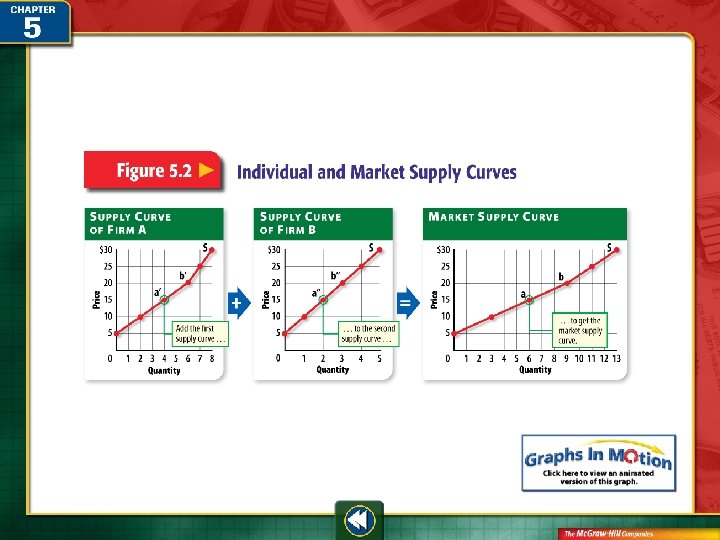
An Introduction to Supply (cont. ) • Normal supply curves have a positive slope—prices go up; quantity supply goes up. • Economists are more interested in the market supply curve than for a single firm. Individual and Market Supply Curves
An Introduction to Supply (cont. ) • The quantity supplied is the amount producers bring to market at any given price. • A change in price leads to a change in quantity supplied. • Although the producer has the freedom to adjust production up or down, the interaction of supply and demand usually determines the final price of a product.
How might a supplier of quality steaks adjust supply when prices increase? A. Manufacture more B. Leave the market C. Merge with another company D. All of the above A. B. C. D. A B C D
Change in Supply Several factors can contribute to a change in supply.
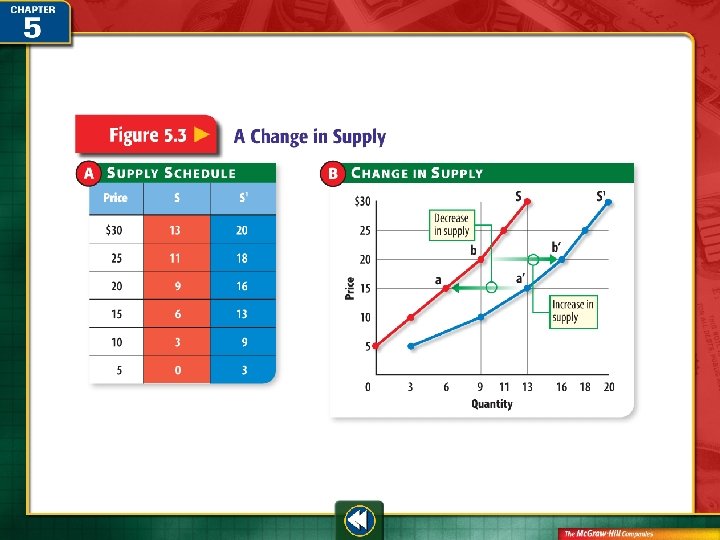
Change in Supply (cont. ) • A change in supply occurs for several reasons. Cause Effect Result – Cost of resources C↑ S↓ Shift L – Productivity P↑ S↑ Shift R – Technology Shift R T↑ – Taxes T↑ S↑ S↓ Shift L
Change in Supply (cont. ) Cause Effect Result – Subsidy S↑ S↑ Shift R – Expectations E↑ S↑ Shift R – Government regulations R↑ S↓ Shift L #S↑ S↑ Shift R – Number of sellers A Change in Supply
Which way does the supply curve shift if production costs of chicken feed increase? A. Shifts to the right B. Shifts to the left A. A B. B
Elasticity of Supply The response to a change in price varies for different products.
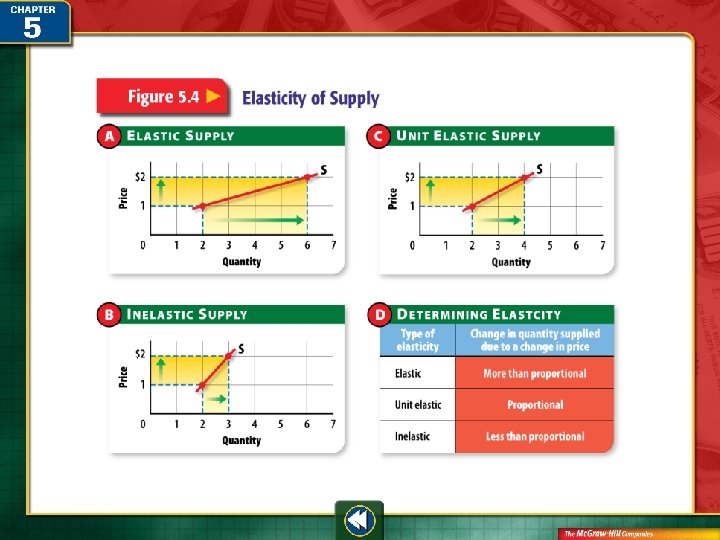
Elasticity of Supply (cont. ) • Supply, like demand, has elasticity. • Supply elasticity measures how the quantity supplied responds to a change in price. Elasticity of Supply
Elasticity of Supply (cont. ) • Supply elasticity has three forms: – Elastic – Inelastic – Unit elastic Elasticity of Supply
Elasticity of Supply (cont. ) • Supply elasticity is based solely on production considerations. • A firm’s ability to adjust to new prices quickly is likely to be elastic. • A firm that takes longer to react to a change in prices is likely to be inelastic. Elasticity of Supply
Section Objectives Students will be able to: • Describe and give examples of the Law of Supply. • Identify and distinguish between a supply curve and a supply schedule. • Give examples between market supply and supply. • Describe the differences between a change in supply and a change in quantity supplied. Describe and give examples of Supply Elasticity. • Identify and distinguish between a elastic, inelastic and unit elastic supply. • Demonstrate how the determinants of elasticity are used in identifying elasticity in supply.
Section Preview In this section, you will learn how a change in the variable input called “labor” results in changes in output. Section Objectives Students will be able to: • Describe the Production Function. • Identify the 3 stages of production. • Transfer information from the Production Function schedule and show it graphically.
The Production Function The production function shows how output changes when a variable input such as labor changes.
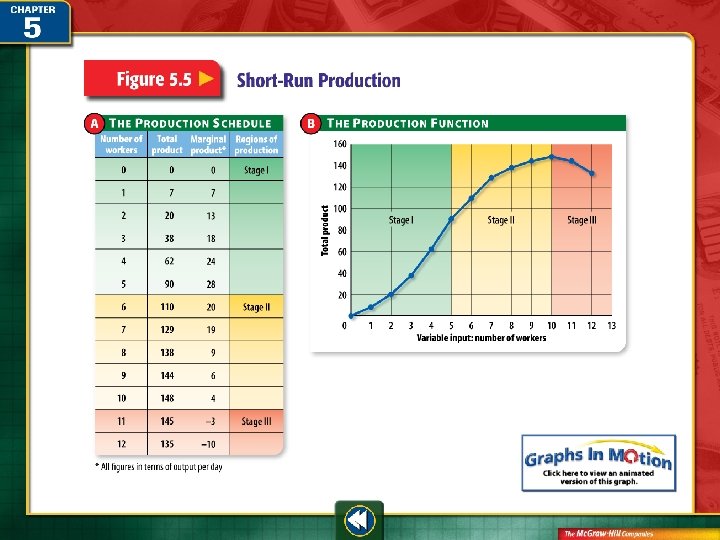
The Production Function (cont. ) • Production can be illustrated with a production function. • Economists focus on the short run when they analyze production. • No changes occur in land, equipment, or technology. Changes in total product (TP) are caused by a change in the number of workers.
The Production Function (cont. ) • Long run changes involve other factors of production, including capital. • Marginal product (MP)—the extra output or change in total product caused by adding one more unit of variable input
Stages of Production The stages of production help companies determine the most profitable number of workers to hire.
Stages of Production (cont. ) • In deciding how many workers to hire, firm must review the three stages of production. – Increasing returns, Stage I – Diminishing returns, Stage II – Negative returns, Stage III Pg. 128
Production Function - Only Labor Pg. 128
Production Function - Only Labor Pg. 128
Section Objectives Students will be able to: • Describe the Production Function. • Identify the 3 stages of production. • Transfer information from the Production Function schedule and show it graphically.
Section Preview In this section, you will learn how businesses analyze their costs and revenues, which helps them maximize their profits. Section Objectives Students will be able to; • Identify and describe the various measures of costs. • Identify and describe cost principles. • Identify and describe marginal analysis and profit maximization point.
Measures of Cost Businesses analyze fixed, variable, total, and marginal costs to make production decisions.
Production Function - Only Labor
Measures of Cost (cont. ) • There are several ways businesses measure costs. – Fixed costs • Total fixed costs, sometimes called overhead, remain the same. • Management salaries, rent/mortgage – Variable costs – Cost that change when operation or production changes. – Labor, supplies/ raw materials, utilities
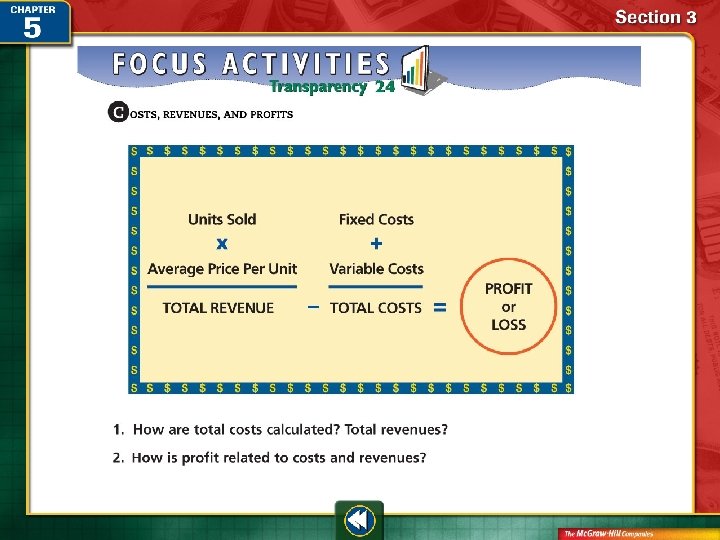
Measures of Cost (cont. ) – Total cost(TC) = FC + VC – Marginal cost – the “extra” cost incurred when producing 1 extra product/output Production, Costs, and Revenues
Production Function – Only Cost
Applying Cost Principles Fixed and variable costs affect the way a business operates.
Applying Cost Principles (cont. ) • People engage in e-commerce conducted on the Internet because – Overhead costs are low. – There is a low need for inventory.
Applying Cost Principles (cont. ) • After businesses measure their costs, they determine the break-even point. This is the point when cost = revenues • Businesses wanting to do better than break even apply principles of marginal analysis to their costs and revenues. This leads businesses to earn a profit.
Marginal Analysis and Profit Maximization Businesses compare marginal revenue with marginal cost to find the level of production that maximizes profits.
Marginal Analysis and Profit Maximization (cont. ) • Two key measures of revenue are used to find the amount of output that will produce the greatest profits. – Total revenue – Represents all the revenues/sales. (TR = TP * MR) – Marginal revenue – The “extra” Revenue/sales made by selling 1 additional product. ∆TR/MP
Revenues = TP * MR
Marginal Analysis and Profit Maximization (cont. ) • Like businesses, we use marginal analysis in our own decision making. • When marginal cost is less than marginal revenue, hire more variable inputs (labor) to expand output.
Marginal Analysis and Profit Maximization (cont. ) • Profit-maximizing quantity of output is reached when marginal cost and marginal revenue are equal. MR=MC
Production, Costs, and Revenues
What happens to a firm’s variable costs if it operates 24 hours a day? A. Costs go up B. Costs go down C. Costs remain constant A. A B. B C. C
Section Objectives Students will be able to: • Identify and describe the various measures of costs. • Identify and describe cost principles. • Identify and describe marginal analysis and profit maximization point.
Law of Supply When the price of a product goes up, quantity supplied goes up. When the price goes down, quantity supplied goes down.
Production Function The production function helps us find the optimal number of variable units (labor) to be used in production. As workers are added in Stage I, production increases at an increasing rate. In Stage II, production increases at a decreasing rate because of diminishing returns. In Stage III, production decreases because more workers cannot make a positive contribution.
Cost and Revenue While businesses have several types of costs, they can find the profit-maximizing quantity of output by comparing marginal cost to their marginal revenue.
Kenneth I. Chenault (1952– ) • first African American to be CEO of a top-100 company • responsible for continuing American Express’s 155 -year-old tradition of “reinvention” during global change
supply amount of a product offered for sale at all possible prices
Law of Supply principle that more will be offered for sale at higher prices than at lower prices
supply schedule a table showing how much a producer will supply at all possible prices
supply curve a graph that shows the different amounts of a product supplied over a range of possible prices
market supply curve a graph that shows the various amounts offered by all firms over a range of possible prices
quantity supplied amount offered for sale at a given price
change in quantity supplied change in amount offered for sale when the price changes
change in supply situation where different amounts are offered for sale at all possible prices in the market; shift of the supply curve
subsidy government payment to encourage or protect a certain economic activity
supply elasticity a measure of how the quantity supplied responds to a change in price
various different
interaction of one on the actions of another
production function a graph showing how a change in the amount of a single variable input changes total output
short run production period so short that only the variable inputs (usually labor) can be changed
long run production period long enough to change the amounts of all inputs
total product total output or production by a firm
marginal product extra output due to the addition of one more unit of input
stages of production phases of production that consist of increasing, decreasing, and negative marginal returns
diminishing returns stage where output increases at a decreasing rate as more units of variable input are added
hypothetical assumed but not proven
contributes gives time, money, or effort
fixed costs that remain the same regardless of level of production or services offered
overhead broad category of fixed costs that includes rent, taxes, and executive salaries
variable cost production costs that change when production levels change
total cost the sum of fixed costs and variable costs
marginal cost extra cost of producing one additional unit of production
e-commerce electronic business conducted over the Internet
break-even point production level where total cost equals total revenue
total revenue total amount earned by a firm from the sale of its products
marginal revenue extra revenue from the sale of one additional unit of output
marginal analysis decision making that compares the extra costs of doing something to the extra benefits gained
profit-maximizing quantity of output level of production where marginal cost is equal to marginal revenue
conducted handled by way of
generates produces or brings into being
To use this Presentation Plus! product: Click the Forward button to go to the next slide. Click the Previous button to return to the previous slide. Click the Home button to return to the Chapter Menu. Click the Transparency button from the Chapter Menu, Chapter Introduction, or Visual Summary slides to access the Economic Concepts transparencies that are relevant to this chapter. From within a section, click on this button to access the relevant Daily Focus Skills Transparency. Click the Return button in a feature to return to the main presentation. Click the Economics Online button to access online textbook features. Click the Reference Atlas button to access the Interactive Reference Atlas. Click the Exit button or press the Escape key [Esc] to end the chapter slide show. Click the Help button to access this screen. Links to Presentation Plus! features such as Graphs in Motion, Charts in Motion, and figures from your textbook are located at the bottom of relevant screens.