Chapter Five Hydrograph A hydrograph is a graph


 : Is the increase in the drain because of")


 : Produces subtracted the losses from Total")


+0.")


 The flood hydrograph due to the two consecutive hourly")


 base flow 8 7 6 5 4 15 15 0 0")

 col. ( 4 ÷) 3 0")


- Slides: 43
Chapter Five Hydrograph • A hydrograph is a graph showing stream flow at the concentration point with time. • Steps of development: • At the beginning, there is only base flow (i. e. , the ground water contribution to the stream) • Gradually , after the storm beginning, the initial losses like interception and infiltration are met and then the surface flow begins. • AB (Rising Limb) , The hydrograph gradually rises , and reaches its peak value after a time tp 10/24/2020 1
10/24/2020 2
• BC (Crest Segment) : Is the increase in the drain because of the gradual increase in the storage due to the channels above basin • P(Peak point ): point placed between inflection points (B, and C) • Inter Flow of the rain up to this point and after this there is gradual dragging of catchment storage. • By this time the ground water table has been built up by the more infiltrating water. • CD (falling Limb): it declines and there is a change of slope at the inflection point (c). • this represents for us the process of withdrawing water from the storage , which was stored in basin during the first phase of the hydrograph. 10/24/2020 3
• t. B : time of ground water contribution of stream flow (Base Flow ). • If a second storm occurs now, again the hydrograph starts rising • till it reaches the new peak and then falls and the ground water withdrawal begins. • Hydrograph represent the three cases of runoff : • Surface Runoff. • Inter Flow. • Base Flow. • The hydrograph does not depend on rain- storm characteristics but is entirely dependent on the characteristics of basin. • Basin shape • Volume of basin 10/24/2020 4
Slop of basin. Vegetation in the basin. Geological soil of basin. If there is another basins and catchments in the region. Base Flow Separation : Hydrograph surface Runoff get from total hydrograph by separated the fast flow from the slow runoff(base flow). • if we consider that Inter flow part of the surface runoff, it is located within the fast flow, and for this it is subtracted from the base runoff hydrograph we get the surface runoff hydrograph. • There are three methods used to separate base runoff : • • • 10/24/2020 5
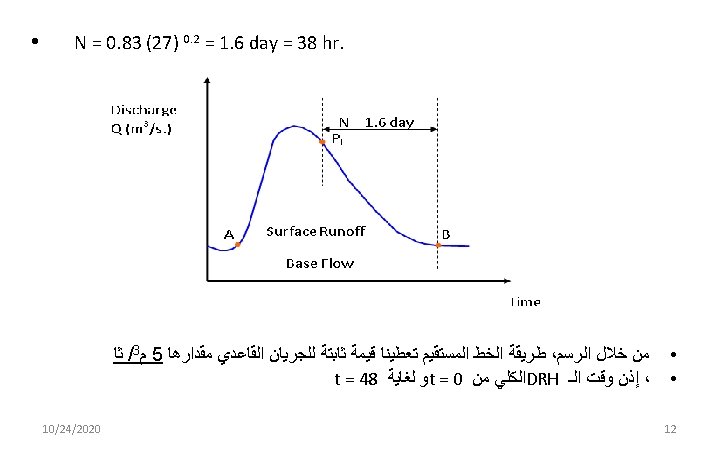
• 1 - The straight-line method : • It is separated runoff base by connect the beginning of surface runoff in a straight line on the falling side, which represents the end of direct runoff • There is experimental equation to determine the time period N (day) of the inflection Pi point to point B: • N = 0. 83 A 0. 2 • A = Area of drainage (km 2) 10/24/2020 6
• Second Method : • Start of surface runoff be extended until intersection with the coordinates of the peak point (point C) and This point to be linked with point B in a straight line. C 10/24/2020 7
• Third method : • In this way, the yield curve of ground flow is extended back until it intersection with the line coming down from the inflection Pi point (line EF) and two points A and F are connect them and be drawn is roughly. 10/24/2020 8
• Excess Rain hydrograph ( ERH) : Produces subtracted the losses from Total runoff hydrograph( TRH). • Both hydrographic ERH and DRH (Direct Rain hydrograph) represent the same total amount but the different in units, where the units of the (ERH) (cm / hr). • when paint the (ERH) against time, the area under curve and you multiply by area basin the output represents the total volume of direct runoff and that It is at the same time represent the area of (DRH). 10/24/2020 9
• Example 1/ • Rain that valued 3. 8, 2. 8 cm occurred during successive term sustainability of 4 hours and the amount of area on the 27 km 2 and has produced the following hydrograph to flow in the discharge basin points, Determine the excess rain and the value of the index Ф? • Solution From the data in the table draw the hydrograph. 10/24/2020 10
10/24/2020 11
• 5 -5=0, 13 -5=8 • Volume of DRH = 6*60*60[0. 5*8+0. 5(8+21)+0. 5(21+16)+0. 5(16+11)+0. 5(11+7)+ • 0. 5(7+4)+0. 5(4+2)+0. 5(2)]= 1. 4904*106 m 3 • Depth of DRH = Runoff vol. / Area = 1. 4904*106 / 27*106 = 5. 52 cm. ( )ﺍﻟﻤﻄﺮﺍﻟﺼﺎﻓﻲ Pnet • Total Rainfall = 2. 8 + 3. 8 = 6. 6 cm. • Time of Duration = 8 hr. • Ф index = (6. 6 – 5. 52) / 8 = 0. 135 cm/hr. 10/24/2020 13
• H. W. • Rain that valued 7 cm occurred during successive term sustainability of 5 hours and the amount of area on the 29 km 2 and has produced the following hydrograph to flow in the discharge basin points, Determine the excess rain and the value of the index Ф? 10/24/2020 14
• UNIT HYDROGRAPH: • is defined as the hydrograph of runoff resulting from an isolated rainfall of some unit duration occurring uniformly over the entire area of the catchment, produces a (unit volume for 1 cm) of runoff. • Steps of unit hydrograph. • Separate the base flow from the total runoff (by the well-known base flow separation procedures). • From the ordinates of the total runoff hydrograph deduct the corresponding ordinates of base flow, to obtain the ordinates of direct runoff. • Divide the volume of direct runoff by the area of the drainage basin to obtain the net rain depth over the basin. • Divide each of the ordinates of direct runoff by the net rain depth to obtain the ordinates of the unit hydrograph. 10/24/2020 15
The steps for the derivation of unit hydrograph can be formulated as follows : 10/24/2020 16
• Example: Determine peak hydrograph 3 - UG standard hours, if you learned that the peak hydrograph flood caused due to 3 hour rain is 270 m 3/s, the rain depth rate equal to 5. 9 cm, suppose that losses rate equal to 0. 3 cm/hour, the base flow value constant and equal to 20 m 3/s? • Solution • Pnet = 5. 9 – 3*0. 3 = 5 cm • Peak for DRH = 270 - 20 =250 m 3/s • Peak for 3 -UH = 250/5= 50 m 3/s /cm 10/24/2020 17
• APPLICATION OF UNIT HYDROGRAPH • The application of unit hydrograph consists of two aspects: • (i) From a unit hydrograph of a known duration to obtain a unit hydrograph of the desired duration, • (ii) From the unit hydrograph , to obtain the flood hydrograph corresponding to a single storm or multiple storms. For design purposes, which with the help of unit hydrograph, gives a design flood hydrograph. 10/24/2020 18
• Example / The successive three-hourly ordinates of a 6 -hr UG for a particular basin are 0, 15, 36, 30, 17. 5, 8. 5, 3, 0 m 3, respectively. The flood peak observed due to a 6 -hr storm was 150 m 3. Assuming a constant base flow of 6 m 3 and an average storm loss of 6 mm/hr, determine the depth of storm rainfall and the stream flow at successive 3 hr interval. 10/24/2020 19
• Example • The design storm of a water shed has the depths of rainfall of 4. 9 and 3. 9 cm for the consecutive 1 -hr periods. The 1 -hr UG can be approximated by a triangle of base 6 hr with a peak of 50 cumec occurring after 2 hr from the beginning. Compute the flood hydrograph assuming an average loss rate of 9 mm/hr and constant base flow of 10 cumec. What its coefficient of runoff? 10/24/2020 20
• Solution • (i) The flood hydrograph due to the two consecutive hourly storms is computed in Table: 10/24/2020 21
• Example : The following information is coordinates 6 - hour record for the collector hydrograph, calculate the direct runoff hydrograph due to excess rain 3. 5 cm, which occur during the 6 -hour vertical coordinates? 66 60 54 48 42 36 30 24 18 15 12 9 6 3 0 (hr. ) Time 0 8 16 25 36 60 110 160 185 160 125 85 50 25 0 coordinate UH (m 3/s) • Solution : 66 60 54 48 42 36 30 24 18 15 12 9 6 3 0 (hr. ) Time 0 8 16 25 36 60 110 160 185 160 125 85 50 25 0 coordinate UH (m 3/s) 0 28 56 87. 5 126 210 385 560 647. 5 560 437. 5 297. 5 175 87. 5 0 coordinate DRH (m 3/s) 10/24/2020 22
• Example /rain storms for each 6 -hour for them to increase their value in the rain 3 and 2 cm alternately occurred one after the other, and that storm worth 2 cm rain occurred after storm 3 cm. Record hydrograph the collector and the 6 -hour is given in the previous example. Compute the DRH output. DRH – 5 cm coordinate DRH – 2 coordinate UH coordinate DRH – 3 time • Solution: coordinate(m 3/s) cm (m 3/s) hr 10/24/2020 0 0 150 50 6 475 100 375 12 805 250 555 18 850 370 480 160 24 550 320 330 110 30 400 220 180 60 36 228 120 108 36 42 147 72 75 25 48 98 50 48 16 54 56 32 24 8 60 (24. 1) (16) (8. 1) (2. 7) (66) 23
10/24/2020 24
• Example: / Rain storm rate table below the collector in three successive periods and 6 -hour values were, respectively, 3. 5, 7. 5 and 5. 5 cm. Loss of the storm rain rate (index Ф) falling on the collector was guessed by 0. 25 cm / hour. Use a 6 -hour time for the vertical coordinates of the unit hydrograph in the table, direct runoff hydrograph. If the assumption that the runoff base flow value is 15 m 3 / s at the beginning and increasingly 2 m 3 / sec every 12 hours until the end of the direct runoff hydrograph. Evaluated flood hydrograph output? 66 60 54 48 42 36 30 24 18 12 6 0 (hr. ) Time 2. 7 8 16 25 36 60 110 180 200 130 75 0 coordinate UH (m 3/s) Solution : loess = 0. 25* 6= 1. 5 cm 10/24/2020 25
flood hydrograph (6+7) base flow 8 7 6 5 4 15 15 0 0 115 15 100 556 15 1337 End 4* 2 col. coordinate hr 12 second (3+4+5) DRH 6* 2 col. hr 6 first coordinate UH tim hr 3 2 1 0 0 0 100 50 6 550 0 300 250 125 12 17 1320 200 750 370 185 18 7194 17 1930 500 1110 320 160 24 7193 17 1920 740 960 220 110 30 1439 19 1420 640 660 120 60 36 891 19 872 440 360 72 36 42 525 19 506 240 216 50 25 48 347 21 326 144 150 32 16 54 233 21 212 100 96 16 8 60 138 21 (117) (64) (48) (5. 4) (2. 7) 66 10/24/2020 2 * 2 col. 26
• Unit Hydrograph Derivation : • Is the process of finding a standard hydrograph coordinates By dividing the coordinates of the DRH on the excess rain or( Pnet ) • The( Pnet) result from the summation of DRH multiply the time and divided by area of basin. • Example: • The following information is coordinates hydrograph rain storm basin of area of 432 km 2 flow base value is 10 m 3/s at the beginning and increasingly 0. 5 m 3/ s every 12 hours until the end of the direct runoff. Derive record hydrograph coordinates of 6 hours? 10/24/2020 27
Coordinate of hydrograph for 6 hr (m 3/s) col. ( 4 ÷) 3 0 6. 7 25. 7 33. 7 30. 7 24. 7 20 16 12 9. 2 6. 6 4. 6 3. 2 1. 8 0 Coordinate (m 3/s) DRH Base flow (m 3/s) Coordinate of storm (m 3/s) Time of storm (hr) 0 20 77 101 92 74 60 48 36 27. 5 20 14 9. 5 5. 5 2. 5 0 10 10 10. 5 11 11. 5 12 12. 5 10 30 87. 5 111. 5 102. 5 85 71 59 47. 5 39 31. 5 26 21. 5 17. 5 15 12. 5 0 6 12 18 24 30 36 42 48 54 60 66 72 78 84 90 587 m 3/s Depth of DRH = (587*6*3600)/ (423*106)= 3 cm 10/24/2020 28
• Example : The runoff data at a stream gauging station for a flood are given below. the drainage area is 40 km 2 the duration of rainfall is 3 hours. Derive the 3 -hour unit hydrograph for the basin and plot the same. 10/24/2020 29
• Solution 10/24/2020 30
• Unit Hydrograph for Different Duration: • There are several ways derivation standard hydrograph which sustainability n. D - an hour from a standard water scheme sustainability D - an hour, and most important of these ways: • Super Position Method. • S - Curve Method. 10/24/2020 31
• Super Position Method. • If the availability of a standard hydrograph who sustainability D - an hour and was required is a derivative standard water scheme n. D for - hour, where n is an integer, • Example (8) / information given is the Y-coordinates record hydrograph sustainability 4 - hour, derived the y-coordinate is 12 - hour water hydrograph record. Time hr 0 4 8 Y-coordinates record hydrograph 0 20 80 12 16 20 24 28 32 36 40 44 48 52 130 150 130 90 52 27 15 5 0 - - • Solution : make table 10/24/2020 32
10/24/2020 33
• S - Curve Method : • This method is used if desired derivative record hydrograph sustainability m. D where m non an integer. • Ex / Prepared solution of the previous example S curved way. (4/12) ÷ 6 ﺍﻟﻌﻤﻮﺩ 5 – ﻋﻤﻮﺩ 4 ﻋﻤﻮﺩ ﻤﺘﺨﻠﻒ S ﻤﻨﺤﻨﻲ ﺳﺎﻋﺔ 12 ﺑـ 7 0 6. 7 33. 3 76. 7 120 136. 7 123. 3 90. 7 56. 3 31. 3 15. 7 6. 7 1. 7 0 6 0 20 100 230 360 410 370 272 169 94 47 20 5 0 20 100 230 380 510 600 652 679 694 699 10/24/2020 ﺇﺤﺪﺍﺛﻴﺎﺕ S ﻤﻨﺤﻨﻲ (2+3) 4 0 20 100 230 380 510 600 652 679 694 699 699 S ﻤﻨﺤﻨﻲ ﺇﺤﺪﺍﺛﻴﺎﺕ UH-4 hr ﺍﻟﻮﻗﺖ ( )ﺳﺎﻋﺔ 3 0 0 20 100 230 380 510 600 652 679 694 699 - 2 0 20 80 130 150 130 90 52 27 15 5 0 - 1 0 4 8 12 16 20 24 28 32 36 40 44 48 52 34
• Ex/ Vertical coordinates of hydrograph 4 - hour shown below. Use these coordinates and derived hydrograph coordinates sustainability hydrograph 2 hour for the same basin by S - Curve Method. 10/24/2020 (4/2) ÷ 6 ﺍﻟﻌﻤﻮﺩ ( UH – 2 hr) 5 – ﻋﻤﻮﺩ 4 ﻋﻤﻮﺩ 7 0 16 24 62 98 122 138 154 146 138 122 102 78 62 42 34 20 20 10 10 6 0 8 12 31 49 61 69 77 73 69 61 51 39 31 21 17 10 10 5 5 S ﻤﻨﺤﻨﻲ 2 ﻤﺘﺨﻠﻒ ﺑـ ﺳﺎﻋﺔ 5 0 8 20 51 100 161 230 307 380 449 510 561 600 631 652 669 679 689 694 ﺇﺤﺪﺍﺛﻴﺎﺕ S ﻤﻨﺤﻨﻲ (2+3) 4 0 8 20 51 100 161 230 307 380 449 510 561 600 631 652 669 679 689 694 699 S ﻤﻨﺤﻨﻲ ﺇﺤﺪﺍﺛﻴﺎﺕ UH-4 hr ﺍﻟﻮﻗﺖ ( )ﺳﺎﻋﺔ 3 0 8 20 51 100 161 230 307 380 449 510 561 600 631 652 669 679 689 2 0 8 12 31 49 61 69 77 73 119 61 51 39 31 21 17 10 10 0 0 1 0 2 4 6 8 10 12 14 16 18 20 22 24 26 28 30 32 34 36 38 35
• Distribution percentages: • The distribution shows the percentages of total unit hydrograph, which occur during successive uniform time increments. • The procedure of deriving the distribution graph is first to separate the base flow from the total runoff. • Example / Analysis of the DRO for a one day unit storm over a basin for the following data: 18, 96, 120, 82, 47, 25, 12, and 2 m 3. Determine the distribution graph percentages. 10/24/2020 36
● ● Example / Basin area of 200 hectares, the rainfall in three consecutive days and the depths of the rain was the 7. 5, 2 and 5 cm, respectively. the index rate Ф 2. 5 cm / day, the distribution percentage of surface runoff per day rainstorm that one day is 5, 15, 40, 25, 10, 5. determine the hydrograph of runoff ? (cm) Distribution of ER runoff m 3 /s 0. 0579* 0. 1736 0. 4919 0. 3762 0. 3472 0. 2025 0. 0579 0. 0289 0 ● ● cm 2. 5 0 5 distribution %percentages 0. 25 0. 75 2. 125 1. 625 1. 5 0. 875 0. 25 0. 125 0. 375 1 0. 625 0. 125 0 0 0 0 0. 25 0. 75 2 1. 25 0 5 15 40 25 10 5 0 ER (cm) (Ф (cm/day Rainfall (cm) time (day) 5 0 2. 5 2. 5 7. 5 2 5 1 - 0 2 - 1 3– 2 4– 3 5– 4 6– 5 7– 6 8– 7 9 -8 ﺛﺎ / 2 ﻡ 23. 148 = (60*60*24 / 410*200) = ﺍﻟﺴﻴﺢ ﻓﻲ ﻳﻮﻡ ﻭﺍﺣﺪ 0. 25 /100*(23. 148) =0. 0579 m 3/s 10/24/2020 37
• APPLICATION OF UNIT HYDROGRAPH: • The application of unit hydrograph consists of : • (i) From a unit hydrograph of a known duration to obtain a unit hydrograph of the demand duration, either by the S-curve method or by the principle of superposition. • (ii) From the unit hydrograph, so derived to obtain the flood hydrograph corresponding to a single storm or multiple storms. For design purposes, a design storm is assumed with the help of unit hydrograph, gives a design flood hydrograph. 10/24/2020 38
• Example • The 3 -hr unit hydrograph ordinates for a basin are given below. There was a storm, which commenced on July 15 at (6 -hr ), which was followed by another storm on July 16 at (12 -hr). the amount of rainfall on July 15 was 5. 75 cm for first (3 -hr ) and 3. 75 cm for next (3 -hr) , and on July 16, 4. 45 cm for all (12 -hr). Assuming an average loss of 0. 25 cm/hr and 0. 15 cm/hr for the two storms, respectively, and a constant base flow of 10 m 3. Determine the stream flow hydrograph and peak flow. 10/24/2020 39
• Solution • Since the duration of the UG is 3 hr, the 6 -hr storm can be considered as 2 -unit storm. • A net rain of 5. 75 – 0. 25 × 3 = 5 cm in the first 3 -hr period and a net rain of 3. 75 – 0. 25 × 3 = 3 cm in the next 3 -hr period. • The unit hydrograph ordinates are multiplied by the net rain of each period by 3 hr. Similarly, • Another unit storm by 12 hr (next day) produces a net rain of 4. 45 – 0. 15 × 3 = 4 cm which is multiplied by the UGO. • Table show the rainfall excesses due to the three storms are added up to get the total direct surface discharge ordinates. 10/24/2020 40
10/24/2020 41
• Example /Storm rainfalls of 3. 2, 8. 2 and 5. 2 cm occur during three successive hours over an area of 45 km 2. The storm loss rate is 1. 2 cm/hr. The distribution percentages of successive • hours are 5, 20, 40, 20, 10 and 5. Determine the stream flows for successive hours assuming a constant base flow of 10 m 3. • Solution 10/24/2020 42
10/24/2020 43