
Chapter Eleven 11 International Portfolio INTERNATIONAL Investments FINANCIAL









- Slides: 31
Chapter Eleven 11 International Portfolio INTERNATIONAL Investments FINANCIAL Chapter Objectives: MANAGEMENT 1. Why investors diversify their portfolios internationally. 2. How much investors can gain from international diversification. 3. The effects of fluctuating exchange rates on international portfolio investments. EUN / RESNICK 4. Whether and how much investors can benefit from Second Edition investing in U. S. based international mutual funds. 5. The reasons for “home bias” in portfolio holdings.
Chapter Outline l l l International Correlation Structure and Risk Diversification Optimal International Portfolio Selection Effects of Changes in the Exchange Rate International Bond Investment International Mutual Funds: A Performance Evaluation Mc. Graw-Hill/Irwin 1 Copyright © 2001 by The Mc. Graw-Hill Companies, Inc. All rights reserved.
Chapter Outline (continued) l l International Diversification through Country Funds International Diversification with ADRs International Diversification with WEBS Why Home Bias in Portfolio Holdings? Mc. Graw-Hill/Irwin 2 Copyright © 2001 by The Mc. Graw-Hill Companies, Inc. All rights reserved.
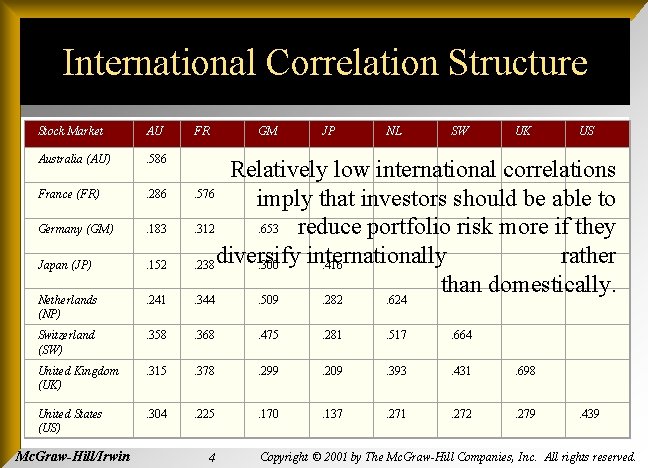
International Correlation Structure and Risk Diversification l Security returns are much less correlated across countries than within a country. n n This is so because economic, political, institutional, and even psychological factors affecting security returns tend to vary across countries, resulting in low correlations among international securities. Business cycles are often high asynchronous across countries. Mc. Graw-Hill/Irwin 3 Copyright © 2001 by The Mc. Graw-Hill Companies, Inc. All rights reserved.
International Correlation Structure Stock Market AU FR GM JP NL SW UK US Australia (AU) . 586 France (FR) . 286 Germany (GM) . 183 Japan (JP) . 152 Netherlands (NP) . 241 . 344 . 509 . 282 . 624 Switzerland (SW) . 358 . 368 . 475 . 281 . 517 . 664 United Kingdom (UK) . 315 . 378 . 299 . 209 . 393 . 431 . 698 United States (US) . 304 . 225 . 170 . 137 . 271 . 272 . 279 . 439 Mc. Graw-Hill/Irwin Relatively low international correlations . 576 imply that investors should be able to . 312. 653 reduce portfolio risk more if they . 238 diversify internationally rather . 300. 416 than domestically. 4 Copyright © 2001 by The Mc. Graw-Hill Companies, Inc. All rights reserved.
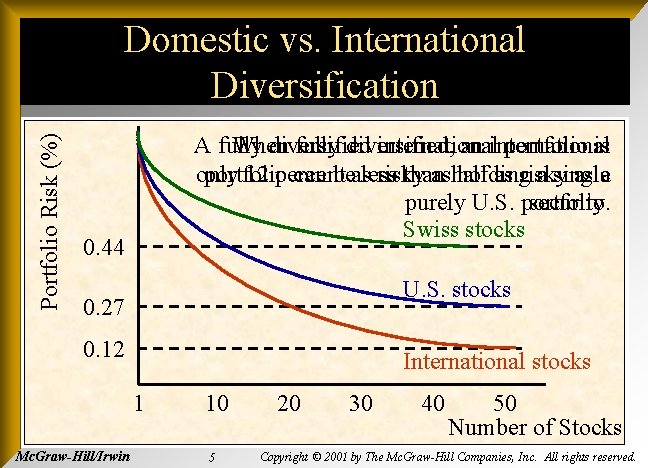
Portfolio Risk (%) Domestic vs. International Diversification A fully diversified international portfolio is When fully diversified, an international only 12 percent as risky as holding a single portfolio can be less than half as risky as a purely U. S. portfolio. security. Swiss stocks 0. 44 U. S. stocks 0. 27 0. 12 International stocks 1 Mc. Graw-Hill/Irwin 10 5 20 30 40 50 Number of Stocks Copyright © 2001 by The Mc. Graw-Hill Companies, Inc. All rights reserved.
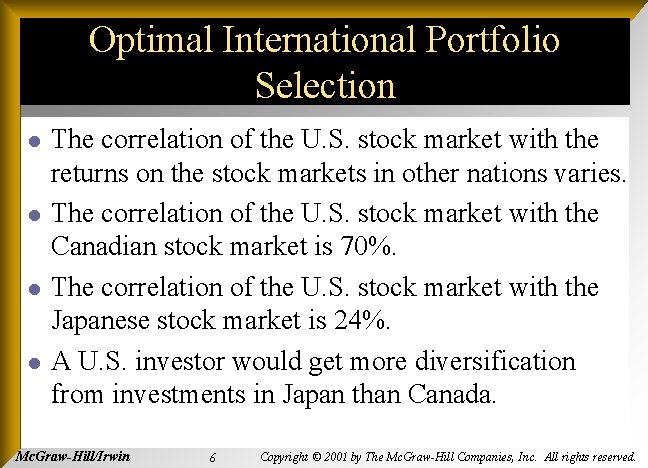
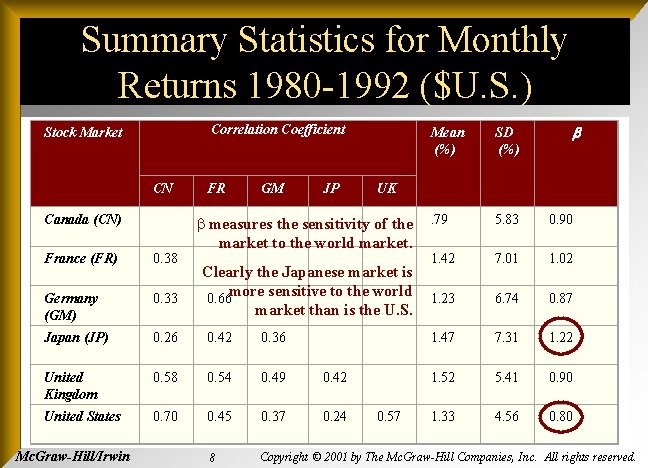
Optimal International Portfolio Selection l l The correlation of the U. S. stock market with the returns on the stock markets in other nations varies. The correlation of the U. S. stock market with the Canadian stock market is 70%. The correlation of the U. S. stock market with the Japanese stock market is 24%. A U. S. investor would get more diversification from investments in Japan than Canada. Mc. Graw-Hill/Irwin 6 Copyright © 2001 by The Mc. Graw-Hill Companies, Inc. All rights reserved.
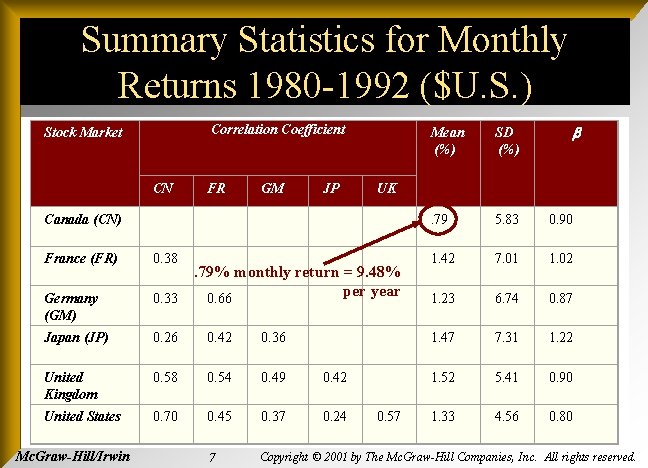
Summary Statistics for Monthly Returns 1980 -1992 ($U. S. ) Correlation Coefficient Stock Market Mean (%) SD (%) CN FR GM JP UK Canada (CN) . 79 5. 83 0. 90 France (FR) 0. 38 1. 42 7. 01 1. 02 Germany (GM) 0. 33 1. 23 6. 74 0. 87 Japan (JP) 0. 26 0. 42 0. 36 1. 47 7. 31 1. 22 United Kingdom 0. 58 0. 54 0. 49 0. 42 1. 52 5. 41 0. 90 United States 0. 70 0. 45 0. 37 0. 24 0. 57 1. 33 4. 56 0. 80 7 Copyright © 2001 by The Mc. Graw-Hill Companies, Inc. All rights reserved. Mc. Graw-Hill/Irwin . 79% monthly return = 9. 48% 0. 66 per year
Summary Statistics for Monthly Returns 1980 -1992 ($U. S. ) Correlation Coefficient Stock Market CN FR GM JP Mean (%) SD (%) UK Canada (CN) France (FR) 0. 38 Germany (GM) 0. 33 Japan (JP) 0. 26 0. 42 0. 36 United Kingdom 0. 58 0. 54 0. 49 0. 42 United States 0. 70 0. 45 0. 37 0. 24 8 Copyright © 2001 by The Mc. Graw-Hill Companies, Inc. All rights reserved. Mc. Graw-Hill/Irwin . 79 b measures the sensitivity of the market to the world market. 5. 83 0. 90 7. 01 1. 02 6. 74 0. 87 1. 47 7. 31 1. 22 1. 52 5. 41 0. 90 0. 57 1. 33 4. 56 0. 80 1. 42 Clearly the Japanese market is 0. 66 more sensitive to the world 1. 23 market than is the U. S.
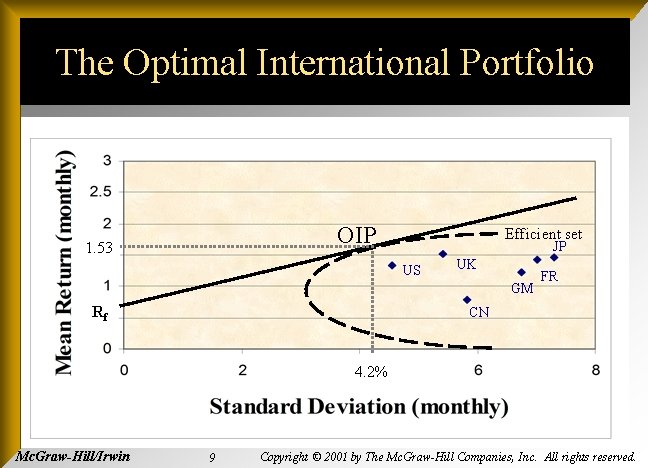
The Optimal International Portfolio OIP 1. 53 Efficient set JP US UK GM Rf FR CN 4. 2% Mc. Graw-Hill/Irwin 9 Copyright © 2001 by The Mc. Graw-Hill Companies, Inc. All rights reserved.
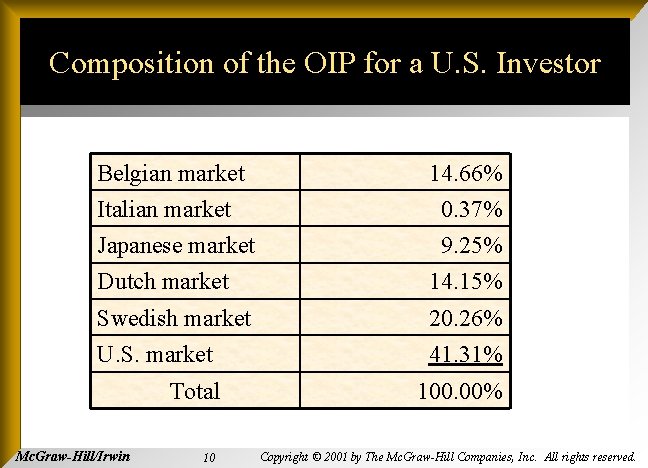
Composition of the OIP for a U. S. Investor Belgian market 14. 66% Italian market 0. 37% Japanese market 9. 25% Dutch market 14. 15% Swedish market 20. 26% U. S. market 41. 31% Total Mc. Graw-Hill/Irwin 10 100. 00% Copyright © 2001 by The Mc. Graw-Hill Companies, Inc. All rights reserved.
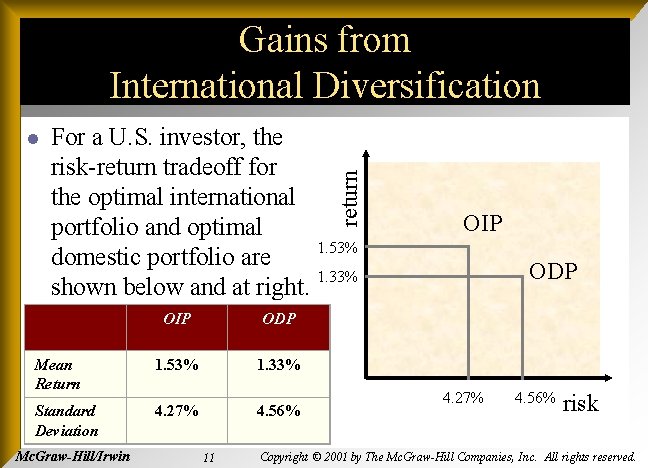
l For a U. S. investor, the risk-return tradeoff for the optimal international portfolio and optimal domestic portfolio are shown below and at right. OIP ODP Mean Return 1. 53% 1. 33% Standard Deviation 4. 27% Mc. Graw-Hill/Irwin 4. 56% 11 return Gains from International Diversification OIP 1. 53% ODP 1. 33% 4. 27% 4. 56% risk Copyright © 2001 by The Mc. Graw-Hill Companies, Inc. All rights reserved.
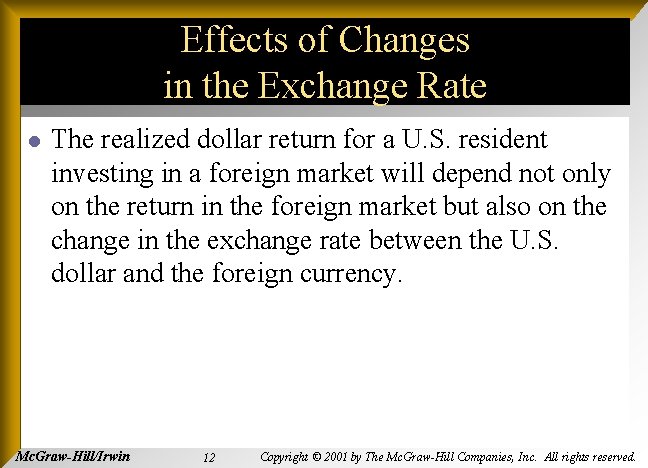
Effects of Changes in the Exchange Rate l The realized dollar return for a U. S. resident investing in a foreign market will depend not only on the return in the foreign market but also on the change in the exchange rate between the U. S. dollar and the foreign currency. Mc. Graw-Hill/Irwin 12 Copyright © 2001 by The Mc. Graw-Hill Companies, Inc. All rights reserved.
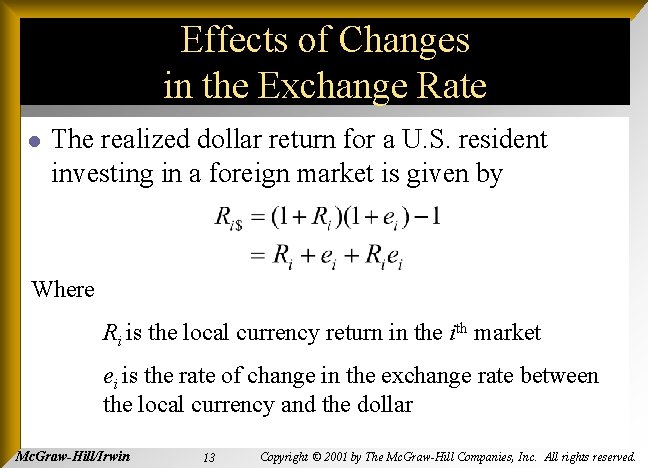
Effects of Changes in the Exchange Rate l The realized dollar return for a U. S. resident investing in a foreign market is given by Where Ri is the local currency return in the ith market ei is the rate of change in the exchange rate between the local currency and the dollar Mc. Graw-Hill/Irwin 13 Copyright © 2001 by The Mc. Graw-Hill Companies, Inc. All rights reserved.
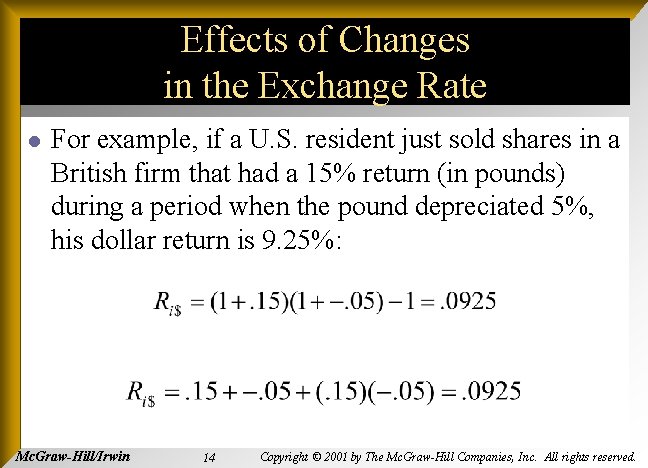
Effects of Changes in the Exchange Rate l For example, if a U. S. resident just sold shares in a British firm that had a 15% return (in pounds) during a period when the pound depreciated 5%, his dollar return is 9. 25%: Mc. Graw-Hill/Irwin 14 Copyright © 2001 by The Mc. Graw-Hill Companies, Inc. All rights reserved.
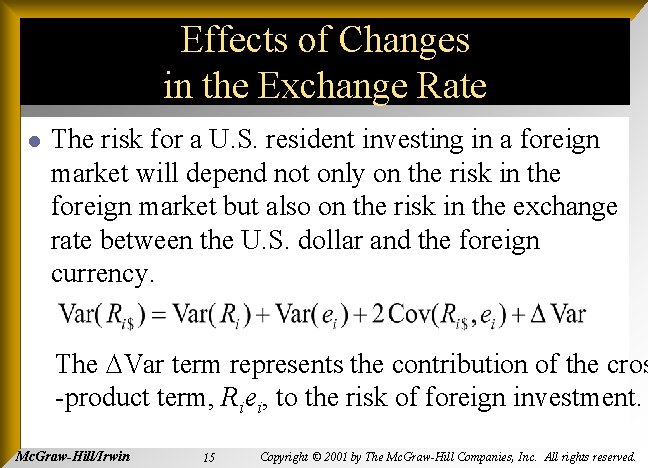
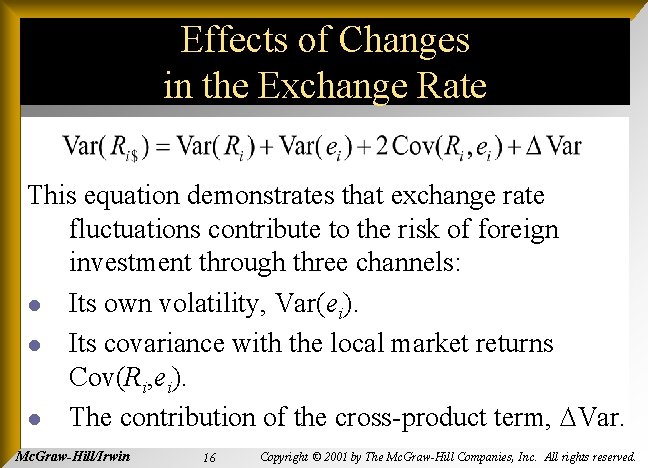
Effects of Changes in the Exchange Rate l The risk for a U. S. resident investing in a foreign market will depend not only on the risk in the foreign market but also on the risk in the exchange rate between the U. S. dollar and the foreign currency. The Var term represents the contribution of the cros -product term, Riei, to the risk of foreign investment. Mc. Graw-Hill/Irwin 15 Copyright © 2001 by The Mc. Graw-Hill Companies, Inc. All rights reserved.
Effects of Changes in the Exchange Rate This equation demonstrates that exchange rate fluctuations contribute to the risk of foreign investment through three channels: l Its own volatility, Var(ei). l Its covariance with the local market returns Cov(Ri, ei). l The contribution of the cross-product term, Var. Mc. Graw-Hill/Irwin 16 Copyright © 2001 by The Mc. Graw-Hill Companies, Inc. All rights reserved.
International Bond Investment l l There is substantial exchange rate risk in foreign bond investment. This suggests that investors may be able to increase their gains is they can control this risk, for example with currency forward contracts or swaps. The advent of the euro is likely to alter the riskreturn characteristics of the euro-zone bond markets enhancing the importance of non-euro currency bonds. Mc. Graw-Hill/Irwin 17 Copyright © 2001 by The Mc. Graw-Hill Companies, Inc. All rights reserved.
International Mutual Funds: A Performance Evaluation l l l A U. S. investor can easily achieve international diversification by investing in a U. S. -based international mutual fund. The advantages include: Savings on transaction and information costs. Circumvention of legal and institutional barriers to direct portfolio investments abroad. Professional management and record keeping. Mc. Graw-Hill/Irwin 18 Copyright © 2001 by The Mc. Graw-Hill Companies, Inc. All rights reserved.
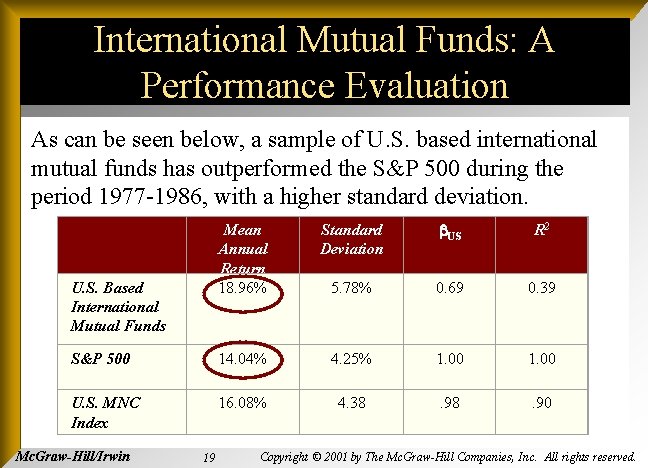
International Mutual Funds: A Performance Evaluation As can be seen below, a sample of U. S. based international mutual funds has outperformed the S&P 500 during the period 1977 -1986, with a higher standard deviation. US Mean Annual Return 18. 96% Standard Deviation US R 2 5. 78% 0. 69 0. 39 S&P 500 14. 04% 4. 25% 1. 00 U. S. MNC Index 16. 08% 4. 38 . 90 U. S. Based International Mutual Funds Mc. Graw-Hill/Irwin 19 Copyright © 2001 by The Mc. Graw-Hill Companies, Inc. All rights reserved.
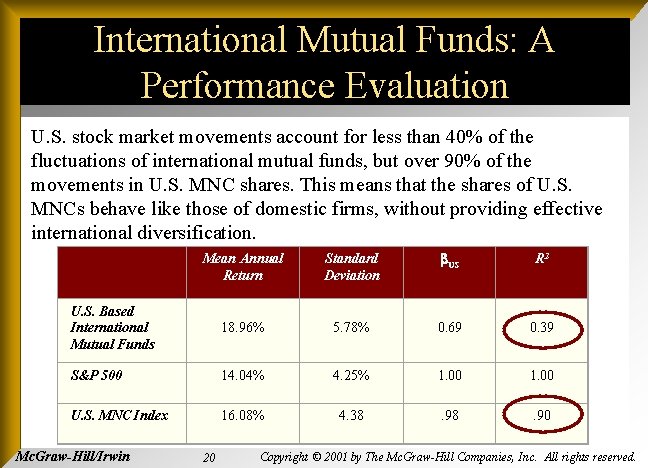
International Mutual Funds: A Performance Evaluation U. S. stock market movements account for less than 40% of the fluctuations of international mutual funds, but over 90% of the movements in U. S. MNC shares. This means that the shares of U. S. MNCs behave like those of domestic firms, without providing effective international diversification. Mean Annual Return Standard Deviation US R 2 U. S. Based International Mutual Funds 18. 96% 5. 78% 0. 69 0. 39 S&P 500 14. 04% 4. 25% 1. 00 U. S. MNC Index 16. 08% 4. 38 . 90 Mc. Graw-Hill/Irwin 20 Copyright © 2001 by The Mc. Graw-Hill Companies, Inc. All rights reserved.
International Diversification through Country Funds l l Recently, country funds have emerged as one of the most popular means of international investment. A country fund invests exclusively in the stocks of a single county. This allows investors to: 1. 2. 3. Speculate in a single foreign market with minimum cost. Construct their own personal international portfolios. Diversify into emerging markets that are otherwise practically inaccessible. Mc. Graw-Hill/Irwin 21 Copyright © 2001 by The Mc. Graw-Hill Companies, Inc. All rights reserved.
American Depository Receipts l l l Foreign stocks often trade on U. S. exchanges as ADRs. It is a receipt that represents the number of foreign shares that are deposited at a U. S. bank. The bank serves as a transfer agent for the ADRs Mc. Graw-Hill/Irwin 22 Copyright © 2001 by The Mc. Graw-Hill Companies, Inc. All rights reserved.
American Depository Receipts l There are many advantages to trading ADRs as opposed to direct investment in the company’s shares: n n n ADRs are denominated in U. S. dollars, trade on U. S. exchanges and can be bought through any broker. Dividends are paid in U. S. dollars. Most underlying stocks are bearer securities, the ADRs are registered. Mc. Graw-Hill/Irwin 23 Copyright © 2001 by The Mc. Graw-Hill Companies, Inc. All rights reserved.
International Diversification with ADRs l Adding ADRs to domestic portfolios has a substantial risk reduction benefit. Mc. Graw-Hill/Irwin 24 Copyright © 2001 by The Mc. Graw-Hill Companies, Inc. All rights reserved.
World Equity Benchmark Shares l World Equity Benchmark Shares (WEBS) n n n Country-specific baskets of stocks designed to replicate the country indexes of 14 countries. WEBS are subject to U. S. SEC and IRS diversification requirements. Low cost, convenient way for investors to hold diversified investments in several different countries. Mc. Graw-Hill/Irwin 25 Copyright © 2001 by The Mc. Graw-Hill Companies, Inc. All rights reserved.
International Diversification with WEBS l l Recent research suggests that WEBs are an excellent tool for international risk diversification. For investors who desire international exposure, WEBs may well serve as a major alternative to such traditional tools as international mutual funds, ADRs, and closed-end country funds Mc. Graw-Hill/Irwin 26 Copyright © 2001 by The Mc. Graw-Hill Companies, Inc. All rights reserved.
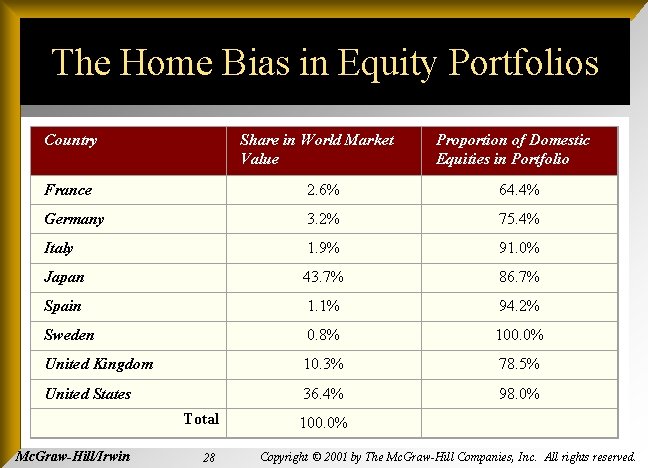
Why Home Bias in Portfolio Holdings? l Home bias refers to the extent to which portfolio investments are concentrated in domestic equities. Mc. Graw-Hill/Irwin 27 Copyright © 2001 by The Mc. Graw-Hill Companies, Inc. All rights reserved.
The Home Bias in Equity Portfolios Country Share in World Market Value Proportion of Domestic Equities in Portfolio France 2. 6% 64. 4% Germany 3. 2% 75. 4% Italy 1. 9% 91. 0% Japan 43. 7% 86. 7% Spain 1. 1% 94. 2% Sweden 0. 8% 100. 0% United Kingdom 10. 3% 78. 5% United States 36. 4% 98. 0% 100. 0% Total Mc. Graw-Hill/Irwin 28 Copyright © 2001 by The Mc. Graw-Hill Companies, Inc. All rights reserved.
Why Home Bias in Portfolio Holdings? l Three explanations come to mind: 1. Domestic equities may provide a superior inflation hedge. 2. Home bias may reflect institutional and legal restrictions on foreign investment. 3. Extra taxes and transactions/information costs foreign securities may give rise to home bias. Mc. Graw-Hill/Irwin 29 Copyright © 2001 by The Mc. Graw-Hill Companies, Inc. All rights reserved.
End Chapter Eleven Mc. Graw-Hill/Irwin 30 Copyright © 2001 by The Mc. Graw-Hill Companies, Inc. All rights reserved.