
Chapter 9 Monitoring Foodservice Operations Daily Food Cost
- Slides: 22
Chapter 9 Monitoring Foodservice Operations Daily Food Cost “Figure out how to stop the damage before it happens, not how to add it up afterwards”_The Underground Chef - Notes From Maggie’s Farm
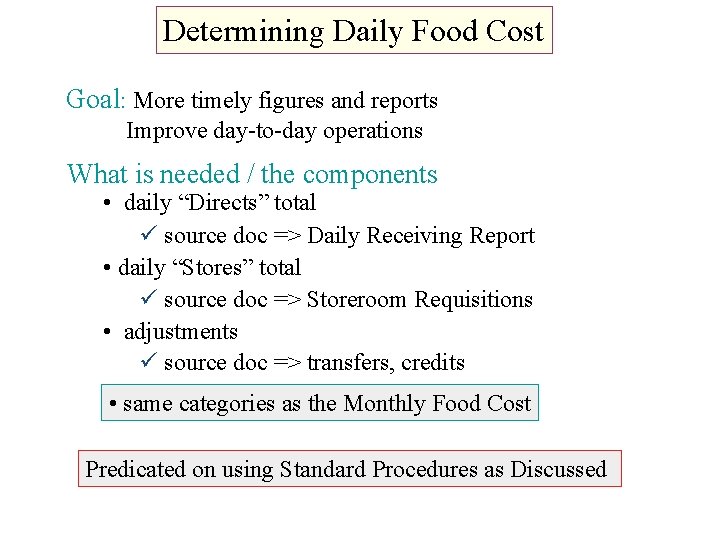
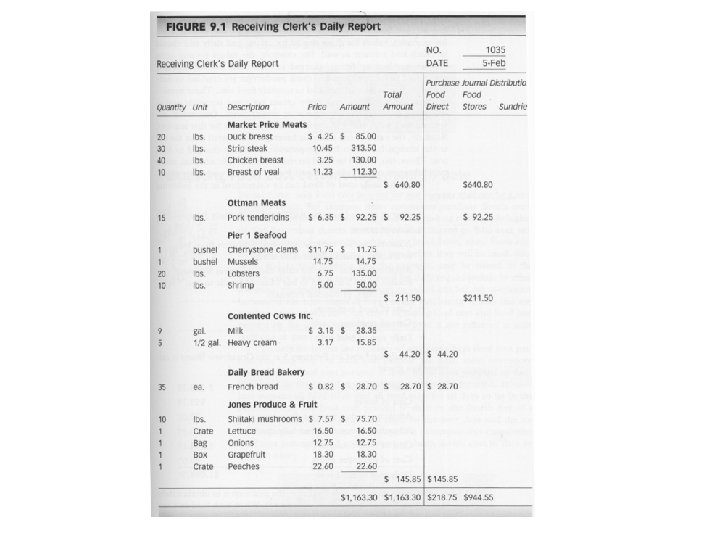
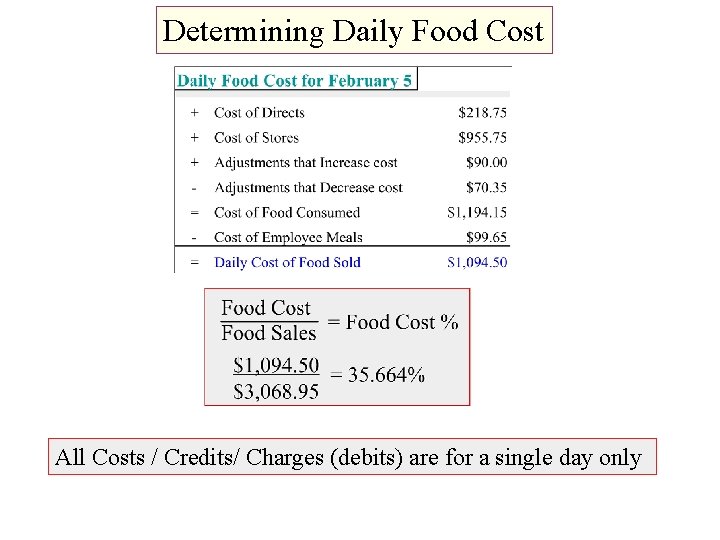
Determining Daily Food Cost Goal: More timely figures and reports Improve day-to-day operations What is needed / the components • daily “Directs” total ü source doc => Daily Receiving Report • daily “Stores” total ü source doc => Storeroom Requisitions • adjustments ü source doc => transfers, credits • same categories as the Monthly Food Cost Predicated on using Standard Procedures as Discussed
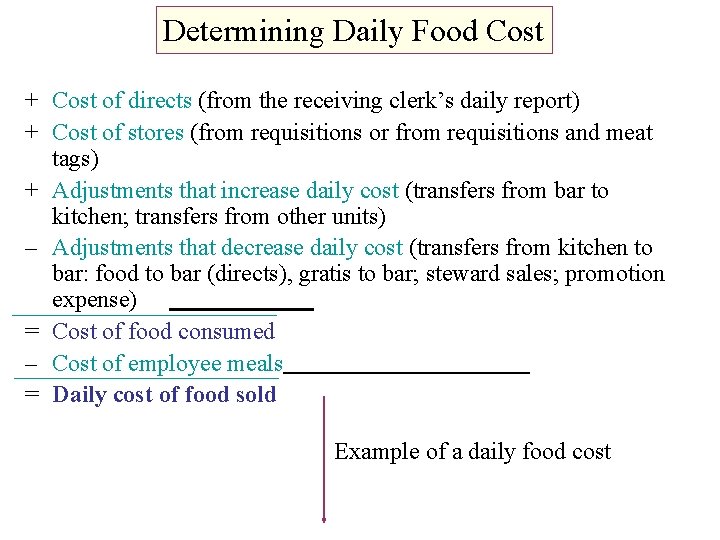
Determining Daily Food Cost + Cost of directs (from the receiving clerk’s daily report) + Cost of stores (from requisitions or from requisitions and meat tags) + Adjustments that increase daily cost (transfers from bar to kitchen; transfers from other units) – Adjustments that decrease daily cost (transfers from kitchen to bar: food to bar (directs), gratis to bar; steward sales; promotion expense) = Cost of food consumed – Cost of employee meals = Daily cost of food sold Example of a daily food cost
Determining Daily Food Cost All Costs / Credits/ Charges (debits) are for a single day only
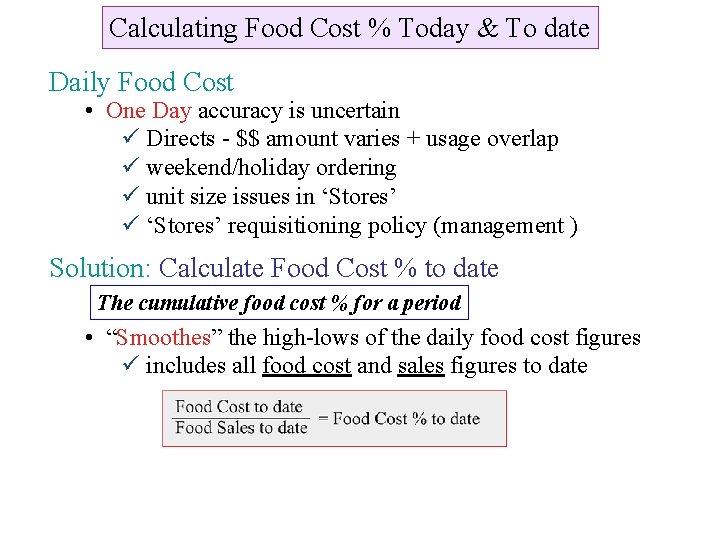
Calculating Food Cost % Today & To date Daily Food Cost • One Day accuracy is uncertain ü Directs - $$ amount varies + usage overlap ü weekend/holiday ordering ü unit size issues in ‘Stores’ ü ‘Stores’ requisitioning policy (management ) Solution: Calculate Food Cost % to date The cumulative food cost % for a period • “Smoothes” the high-lows of the daily food cost figures ü includes all food cost and sales figures to date
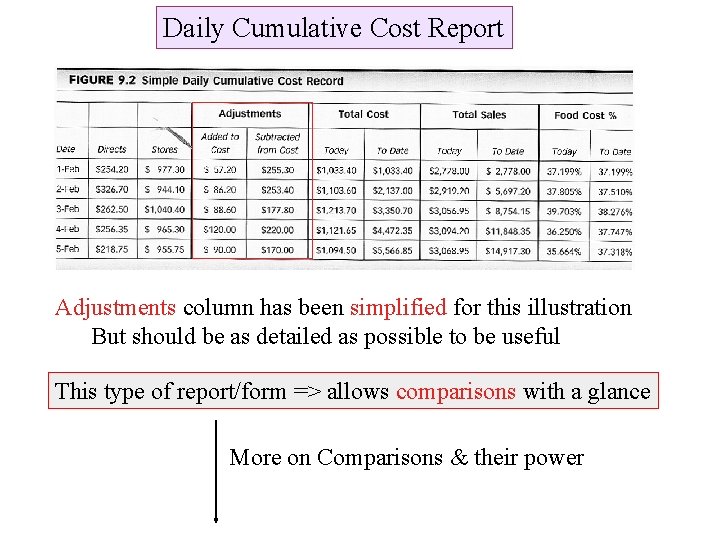
Daily Cumulative Cost Report Adjustments column has been simplified for this illustration But should be as detailed as possible to be useful This type of report/form => allows comparisons with a glance More on Comparisons & their power
Comparing Similar Periods Elements of Comparing Daily Results • Built on the ‘Monthly’ report approach • Better asses Operations & Cost Control Measures • These results reveal ü food: cost/sales/% - for any &/or all days-to-date in period ü compares these figures to a Similar period Advantages • Comparing cumulative figures • Makes it easier to MONITOR operations • Aggregating Daily ‘Sounding” or ‘Sighting” ü readjust by making TIMELY operational decisions ü implement decisions via Corrective Actions
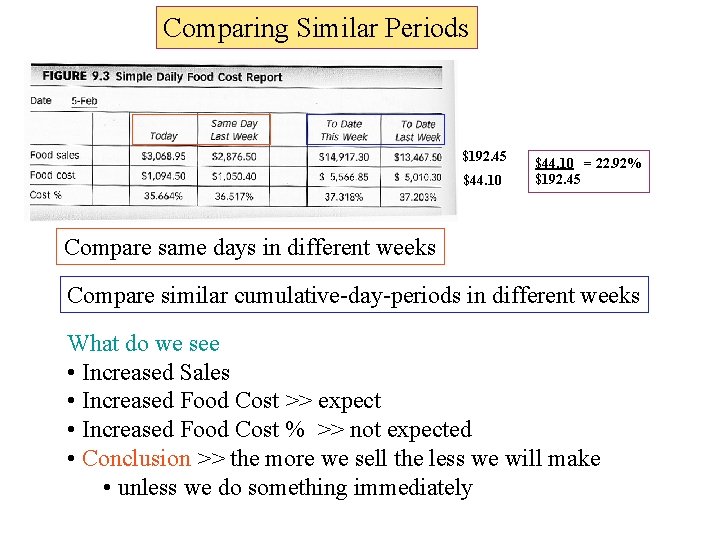
Comparing Similar Periods $192. 45 $44. 10 = 22. 92% $192. 45 Compare same days in different weeks Compare similar cumulative-day-periods in different weeks What do we see • Increased Sales • Increased Food Cost >> expect • Increased Food Cost % >> not expected • Conclusion >> the more we sell the less we will make • unless we do something immediately
Comparing Similar Periods Validation of what we think we see 1. Need to investigate what is driving high FC% >> corrective action… • If too much ‘Direct’ purchasing is the reason >> stop buying… • If too many “Stores” issues is the reason >> stop issuing… • These types of corrective actions have immediate impact • and lower food cost • BUT give symptomatic (tactical) & not operational (strategic) healing ( like menu revision/standards/standard procedures/training/etc. ) 2. Perhaps cannot make conclusive decision as to cause • Requires more information, more details = NEW REPORT • Make sure the increased cost is worth the projected returns • a cost-benefit trade off decision • do you really need this much detail? (easily done with POS)
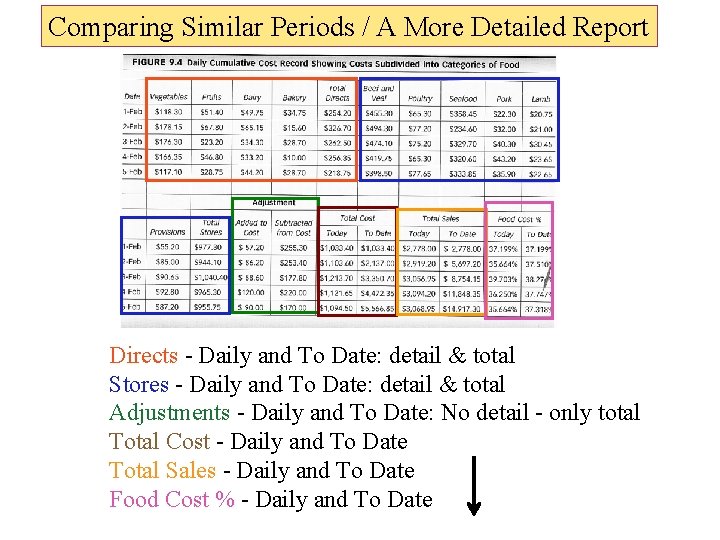
Comparing Similar Periods / A More Detailed Report Directs - Daily and To Date: detail & total Stores - Daily and To Date: detail & total Adjustments - Daily and To Date: No detail - only total Total Cost - Daily and To Date Total Sales - Daily and To Date Food Cost % - Daily and To Date
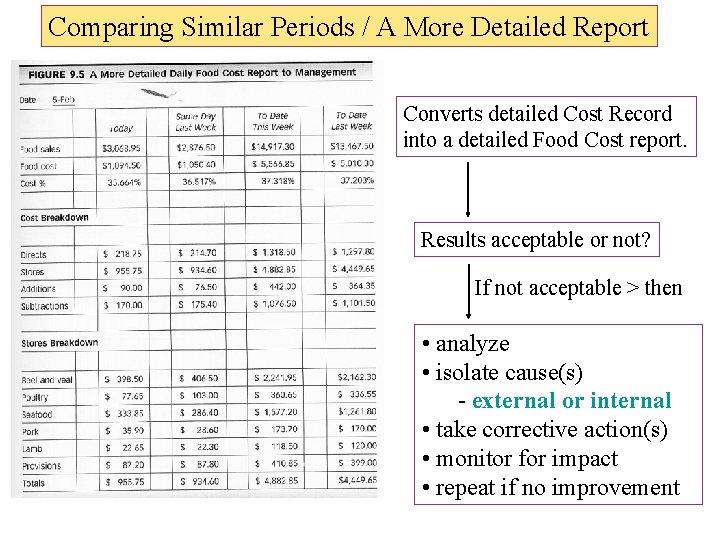
Comparing Similar Periods / A More Detailed Report Converts detailed Cost Record into a detailed Food Cost report. Results acceptable or not? If not acceptable > then • analyze • isolate cause(s) - external or internal • take corrective action(s) • monitor for impact • repeat if no improvement
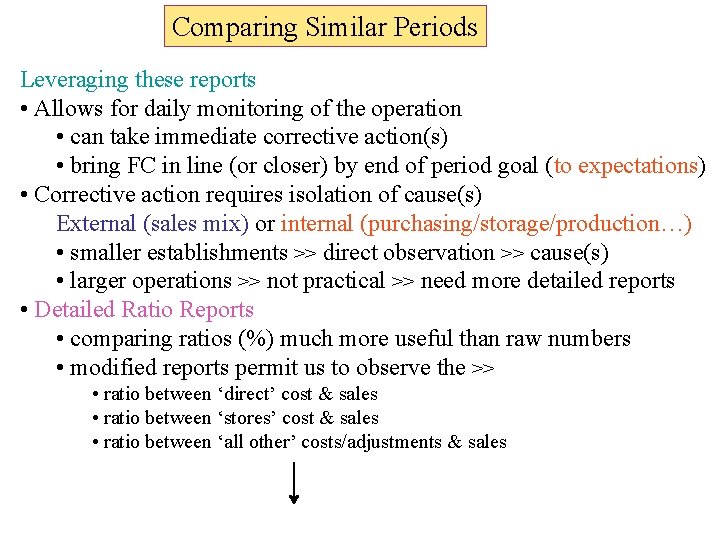
Comparing Similar Periods Leveraging these reports • Allows for daily monitoring of the operation • can take immediate corrective action(s) • bring FC in line (or closer) by end of period goal (to expectations) • Corrective action requires isolation of cause(s) External (sales mix) or internal (purchasing/storage/production…) • smaller establishments >> direct observation >> cause(s) • larger operations >> not practical >> need more detailed reports • Detailed Ratio Reports • comparing ratios (%) much more useful than raw numbers • modified reports permit us to observe the >> • ratio between ‘direct’ cost & sales • ratio between ‘stores’ cost & sales • ratio between ‘all other’ costs/adjustments & sales
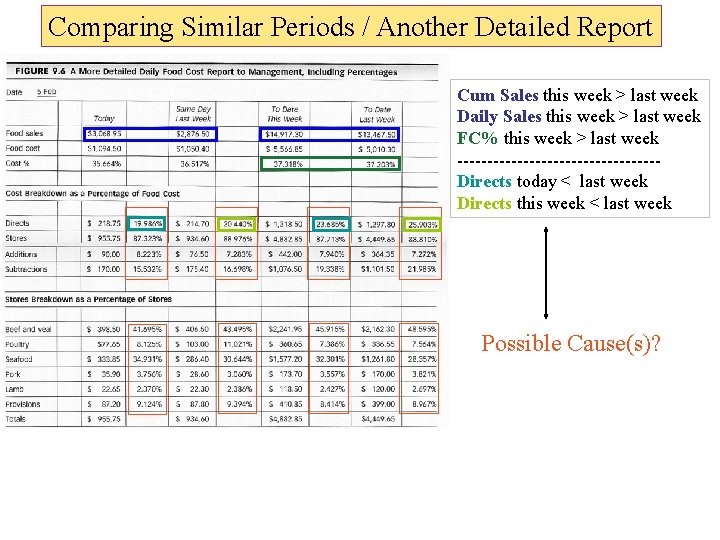
Comparing Similar Periods / Another Detailed Report Cum Sales this week > last week Daily Sales this week > last week FC% this week > last week -----------------Directs today < last week Directs this week < last week Possible Cause(s)?
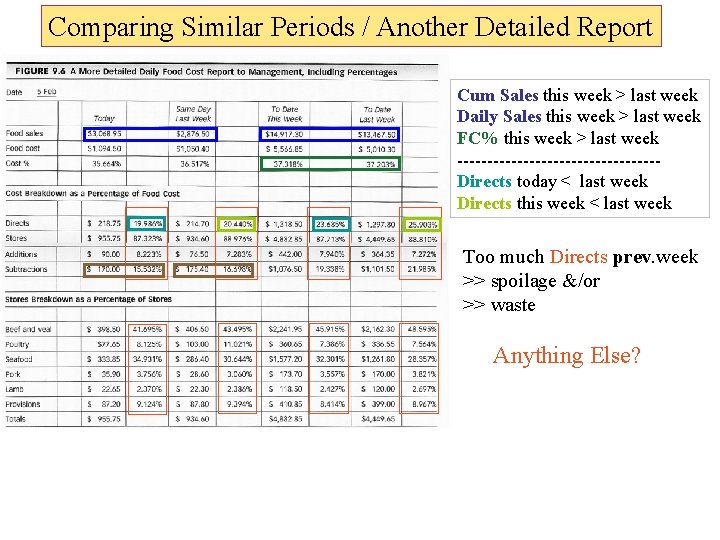
Comparing Similar Periods / Another Detailed Report Cum Sales this week > last week Daily Sales this week > last week FC% this week > last week -----------------Directs today < last week Directs this week < last week Too much Directs prev. week >> spoilage &/or >> waste Anything Else?
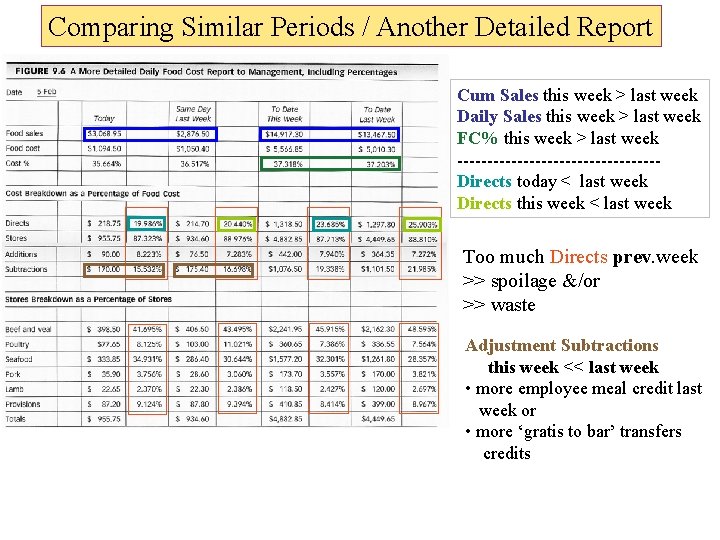
Comparing Similar Periods / Another Detailed Report Cum Sales this week > last week Daily Sales this week > last week FC% this week > last week -----------------Directs today < last week Directs this week < last week Too much Directs prev. week >> spoilage &/or >> waste Adjustment Subtractions this week << last week • more employee meal credit last week or • more ‘gratis to bar’ transfers credits
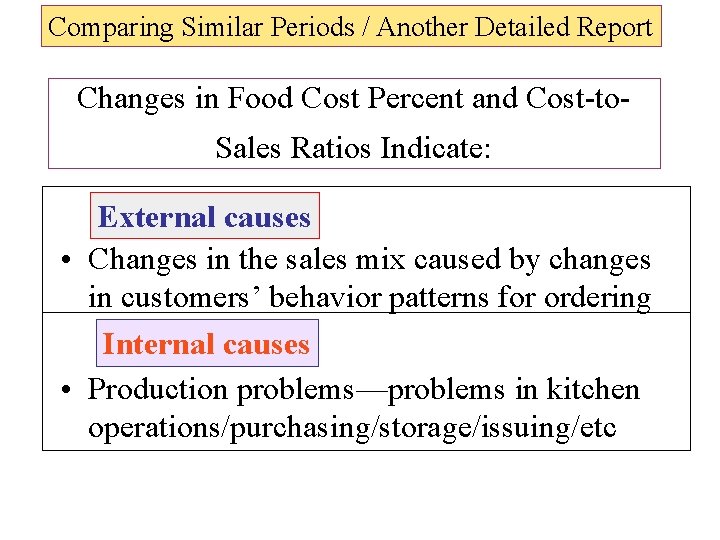
Comparing Similar Periods / Another Detailed Report Changes in Food Cost Percent and Cost-to. Sales Ratios Indicate: External causes • Changes in the sales mix caused by changes in customers’ behavior patterns for ordering Internal causes • Production problems—problems in kitchen operations/purchasing/storage/issuing/etc
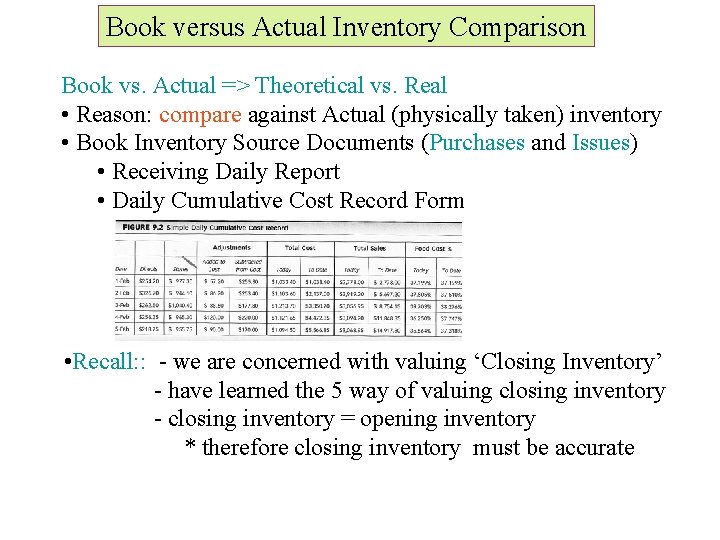
Book versus Actual Inventory Comparison Book vs. Actual => Theoretical vs. Real • Reason: compare against Actual (physically taken) inventory • Book Inventory Source Documents (Purchases and Issues) • Receiving Daily Report • Daily Cumulative Cost Record Form • Recall: : - we are concerned with valuing ‘Closing Inventory’ - have learned the 5 way of valuing closing inventory - closing inventory = opening inventory * therefore closing inventory must be accurate
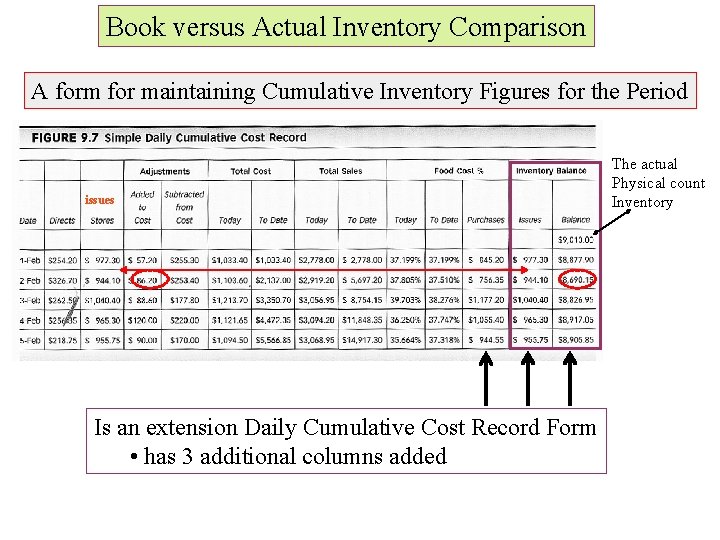
Book versus Actual Inventory Comparison A form for maintaining Cumulative Inventory Figures for the Period issues Is an extension Daily Cumulative Cost Record Form • has 3 additional columns added The actual Physical count Inventory
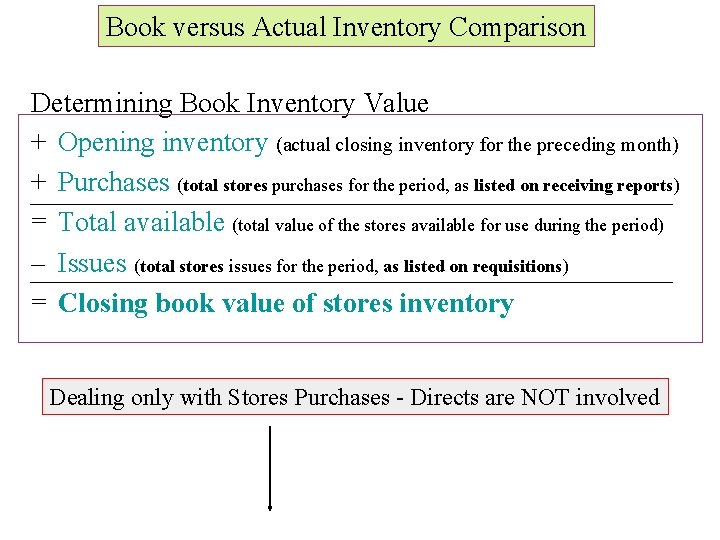
Book versus Actual Inventory Comparison Determining Book Inventory Value + Opening inventory (actual closing inventory for the preceding month) + Purchases (total stores purchases for the period, as listed on receiving reports) = Total available (total value of the stores available for use during the period) – Issues (total stores issues for the period, as listed on requisitions) = Closing book value of stores inventory Dealing only with Stores Purchases - Directs are NOT involved
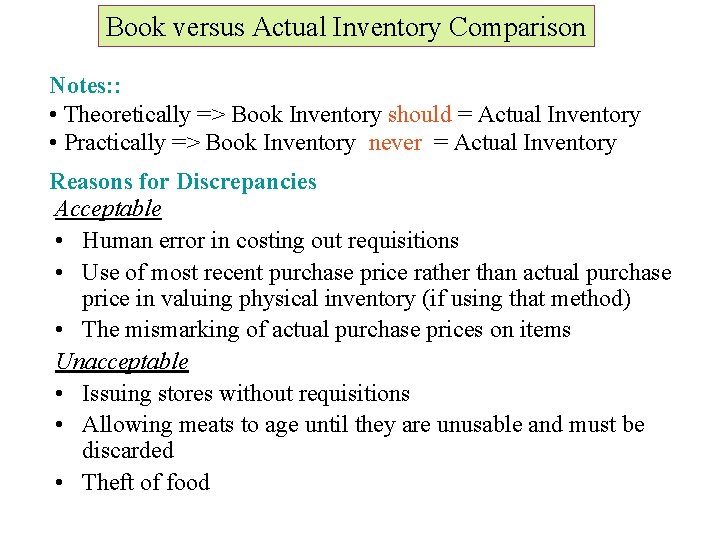
Book versus Actual Inventory Comparison Notes: : • Theoretically => Book Inventory should = Actual Inventory • Practically => Book Inventory never = Actual Inventory Reasons for Discrepancies Acceptable • Human error in costing out requisitions • Use of most recent purchase price rather than actual purchase price in valuing physical inventory (if using that method) • The mismarking of actual purchase prices on items Unacceptable • Issuing stores without requisitions • Allowing meats to age until they are unusable and must be discarded • Theft of food
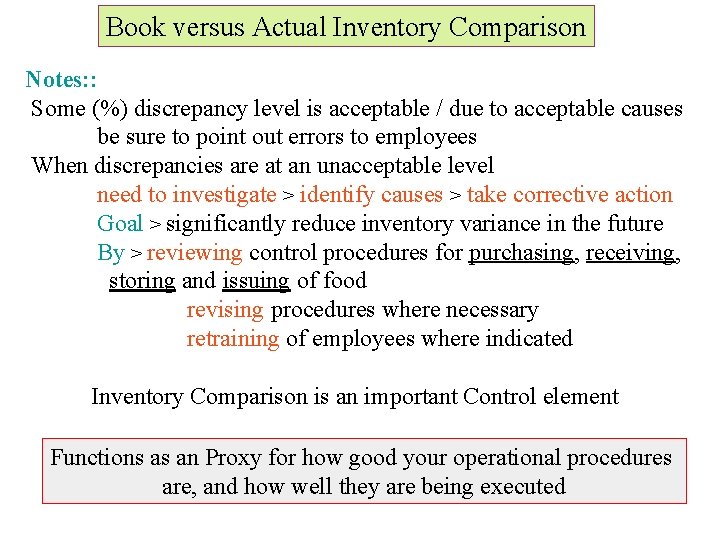
Book versus Actual Inventory Comparison Notes: : Some (%) discrepancy level is acceptable / due to acceptable causes be sure to point out errors to employees When discrepancies are at an unacceptable level need to investigate > identify causes > take corrective action Goal > significantly reduce inventory variance in the future By > reviewing control procedures for purchasing, receiving, storing and issuing of food revising procedures where necessary retraining of employees where indicated Inventory Comparison is an important Control element Functions as an Proxy for how good your operational procedures are, and how well they are being executed