Chapter 9 Inferences Based on Two Samples 9

Chapter 9 Inferences Based on Two Samples

9. 1 z Tests and Confidence Intervals for a Difference Between Two Population Means

The Difference Between Two Population Means New Notation Assumptions: 1. X 1, …, Xm is a random sample from a population with m: sample size 1 2. Y 1, …, Yn is a random sample from a population with n: sample size 2 3. The X and Y samples are independent of one another

Expected Value and Standard Deviation of The expected value is So is an estimator of The standard deviation is Think of this as the parameter.

Test Procedures for Normal Populations With Known Variances Null hypothesis: same Test statistic value:
 Alt. Hypothesis Similar to p. 330 formulas")
= P(Type II Error) Alt. Hypothesis Similar to p. 330 formulas

Large-Sample Tests The assumptions of normal population distributions and known values of are unnecessary. The Central Limit Theorem guarantees that has approximately a normal distribution. Rule of thumb: Both m, n>40

Large-Sample Tests Use of the test statistic value Usually zero m, n >40 along with previously stated rejection regions based on z critical values give large-sample tests whose significance levels are approximately

Confidence Interval for Provided m and n are large, a CI for with a confidence level of is confidence bounds can be found by replacing

9. 2 The Two-Sample t Test and Confidence Interval

Assumptions Both populations are normal, so that X 1, …, Xm is a random sample from a normal distribution and so is Y 1, …, Yn. The plausibility of these assumptions can be judged by constructing a normal probability plot of the xi’s and another of the yi’s. Normality assumption important for (small-sample) t-tests!

t Distribution When the population distributions are both normal, the standardized variable has approximately a t distribution…

t Distribution df v can be estimated from the data by Yuck! Don’t do by hand if you can help it. (round down to the nearest integer)

Two-Sample CI for The two-sample CI for with a confidence level of is

Two-Sample t Test Null hypothesis: Usually zero Test statistic value:

The Two-Sample t Test Alternative Hypothesis Rejection Region for Approx. Level Test or

Important: pooled t assumes equal variances Pooled t Procedures Assume two populations are normal and have equal variances. If denotes the common variance, it can be estimated by combining information from the two samples. Standardizing using the pooled estimator gives a t variable based on m + n – 2 df.

Pooled sample variance Usage in formulas:

9. 3 Analysis Paired Data of
 Important: A natural pairing must exist! The data consists of n")
Paired Data (Assumptions) Important: A natural pairing must exist! The data consists of n independently selected pairs (X 1, Y 1), …, (Xn, Yn), with Let D 1 = X 1 – Y 1, …, Dn = Xn – Yn. The Di’s are assumed to be normally distributed with mean value and variance Bottom line: Two-sample problem becomes a one-sample problem!

The Paired t Test Null hypothesis: Usually zero Test statistic value: are the sample mean and standard deviation of the di’s.

The Paired t Test Alternative Hypothesis Nothing new here! Rejection Region for Level Test or

Confidence Interval for The paired t CI for is Nothing new here! confidence bounds can be found by replacing For large samples, you could use Z test and CI

Paired Data and Two-Sample t Remember: Smaller variance means better estimates Independence between X and Y Positive dependence

Pros and Cons of Pairing 1. For great heterogeneity and large correlation within experimental units, the loss in degrees of freedom will be compensated for by an increased precision associated with pairing Usually, we’re in case 1; (use pairing). use pairing if possible. 2. If the units are relatively homogeneous and the correlation within pairs is not large, the gain in precision due to pairing will be outweighed by the decrease in degrees of freedom (use independent samples).

9. 4 Inferences Concerning a Difference Between Population Proportions
 and Y ~Bin(n, p 2)")
Difference Between Population Proportions Let X ~Bin(m, p 1) and Y ~Bin(n, p 2) with X and Y independent variables. Then (qi = 1 – pi)

Large-Samples Null hypothesis: Test statistic value:
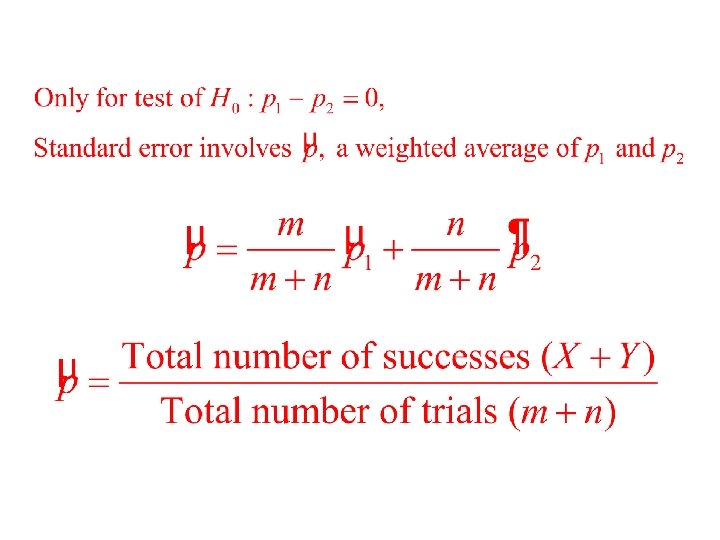

Confidence Interval for p 1 – p 2 Note: Standard error here is slightly different than for test!
- Slides: 30