
Chapter 9 Historic Ex Post Returns u Dollar
- Slides: 13
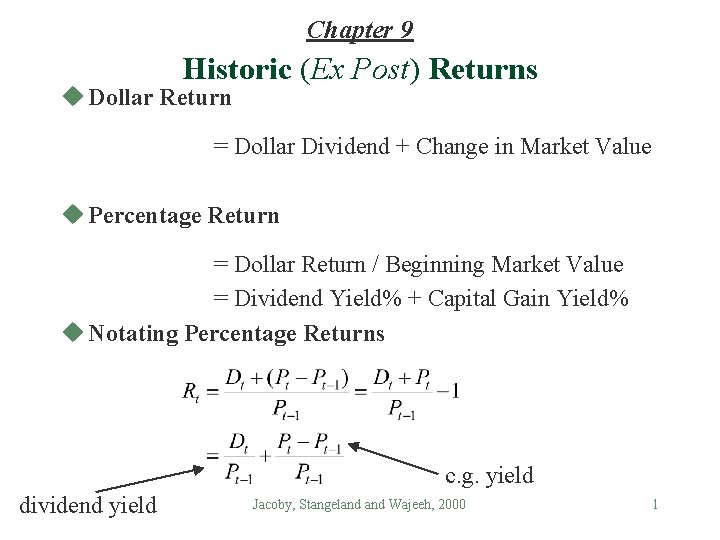
Chapter 9 Historic (Ex Post) Returns u Dollar Return = Dollar Dividend + Change in Market Value u Percentage Return = Dollar Return / Beginning Market Value = Dividend Yield% + Capital Gain Yield% u Notating Percentage Returns c. g. yield dividend yield Jacoby, Stangeland Wajeeh, 2000 1
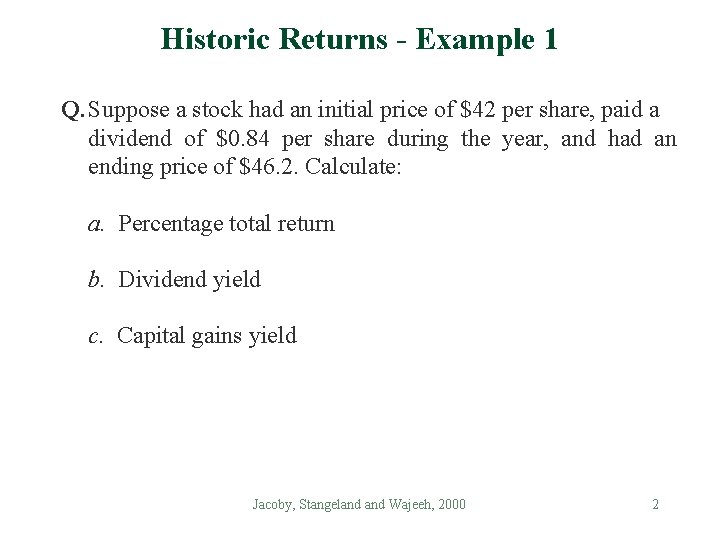
Historic Returns - Example 1 Q. Suppose a stock had an initial price of $42 per share, paid a dividend of $0. 84 per share during the year, and had an ending price of $46. 2. Calculate: a. Percentage total return b. Dividend yield c. Capital gains yield Jacoby, Stangeland Wajeeh, 2000 2
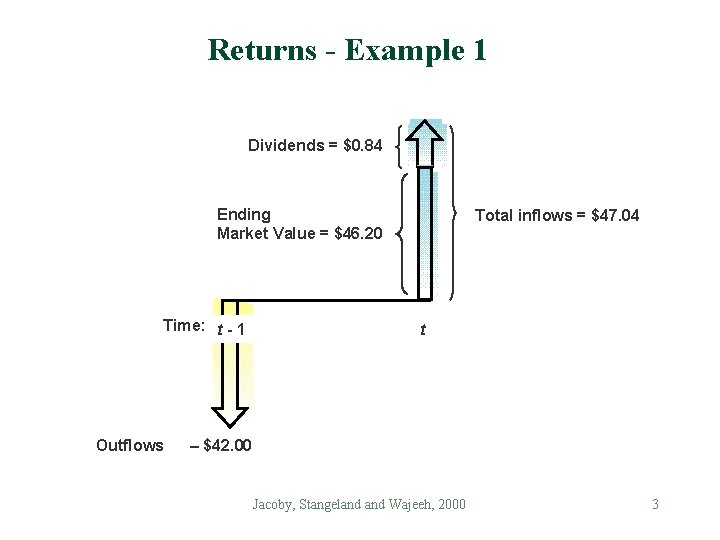
Returns - Example 1 Dividends = $0. 84 Ending Market Value = $46. 20 Time: t - 1 Outflows Total inflows = $47. 04 t – $42. 00 Jacoby, Stangeland Wajeeh, 2000 3
Historic Returns - Example 1 A. a. percentage total return b. dividend yield c. capital gains yield 4
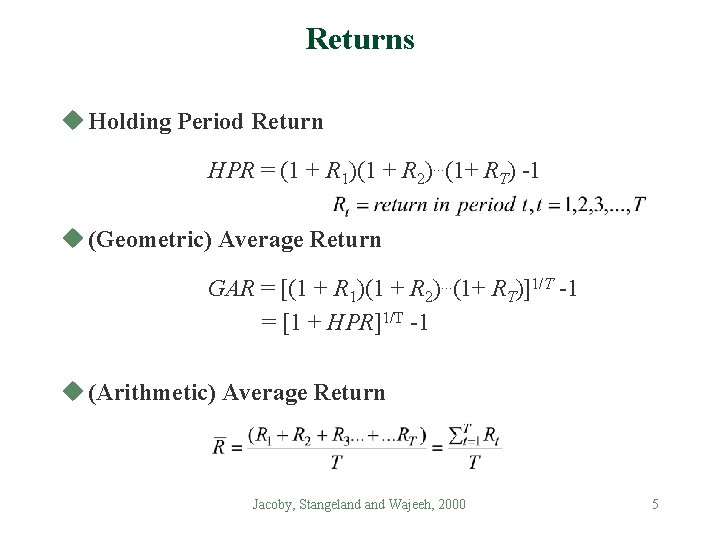
Returns u Holding Period Return HPR = (1 + R 1)(1 + R 2). . . (1+ RT) -1 u (Geometric) Average Return GAR = [(1 + R 1)(1 + R 2). . . (1+ RT)]1/T -1 = [1 + HPR]1/T -1 u (Arithmetic) Average Return Jacoby, Stangeland Wajeeh, 2000 5
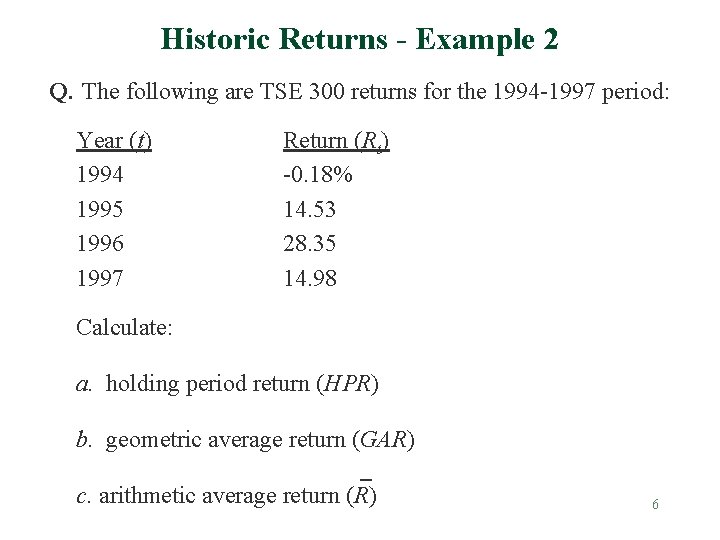
Historic Returns - Example 2 Q. The following are TSE 300 returns for the 1994 -1997 period: Year (t) 1994 1995 1996 1997 Return (Rt) -0. 18% 14. 53 28. 35 14. 98 Calculate: a. holding period return (HPR) b. geometric average return (GAR) c. arithmetic average return (R) 6
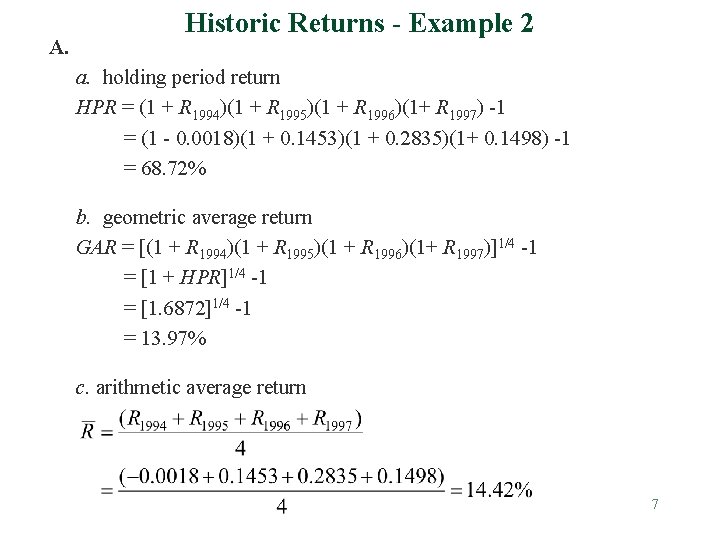
A. Historic Returns - Example 2 a. holding period return HPR = (1 + R 1994)(1 + R 1995)(1 + R 1996)(1+ R 1997) -1 = (1 - 0. 0018)(1 + 0. 1453)(1 + 0. 2835)(1+ 0. 1498) -1 = 68. 72% b. geometric average return GAR = [(1 + R 1994)(1 + R 1995)(1 + R 1996)(1+ R 1997)]1/4 -1 = [1 + HPR]1/4 -1 = [1. 6872]1/4 -1 = 13. 97% c. arithmetic average return 7
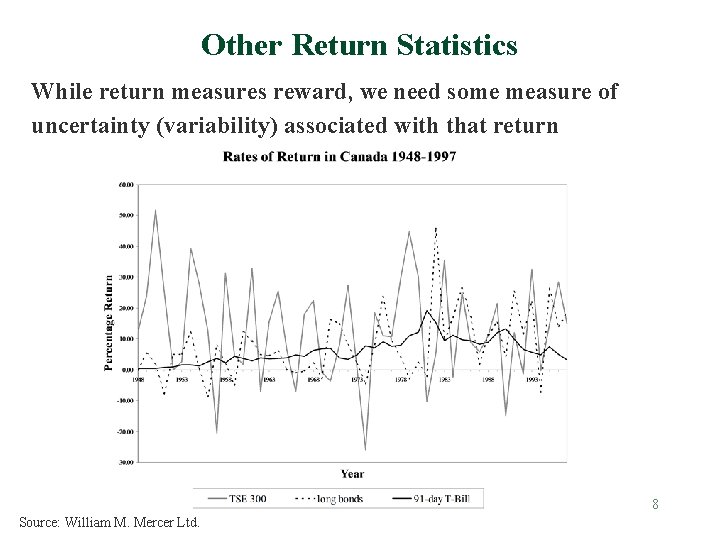
Other Return Statistics While return measures reward, we need some measure of uncertainty (variability) associated with that return 8 Source: William M. Mercer Ltd.
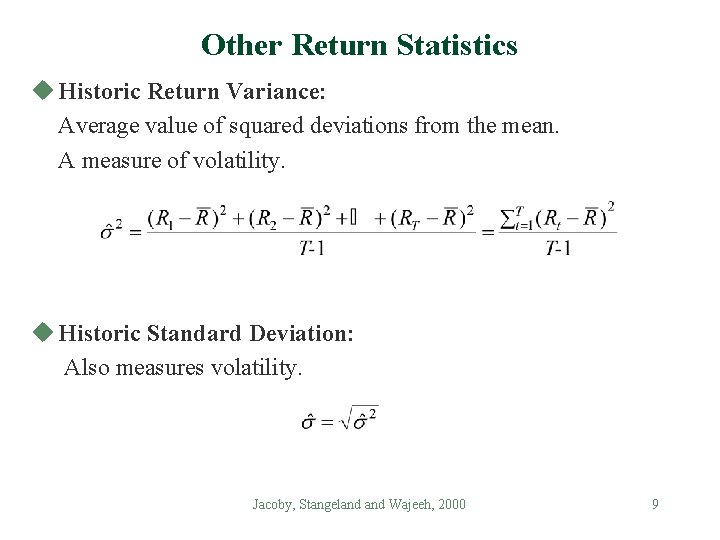
Other Return Statistics u Historic Return Variance: Average value of squared deviations from the mean. A measure of volatility. u Historic Standard Deviation: Also measures volatility. Jacoby, Stangeland Wajeeh, 2000 9
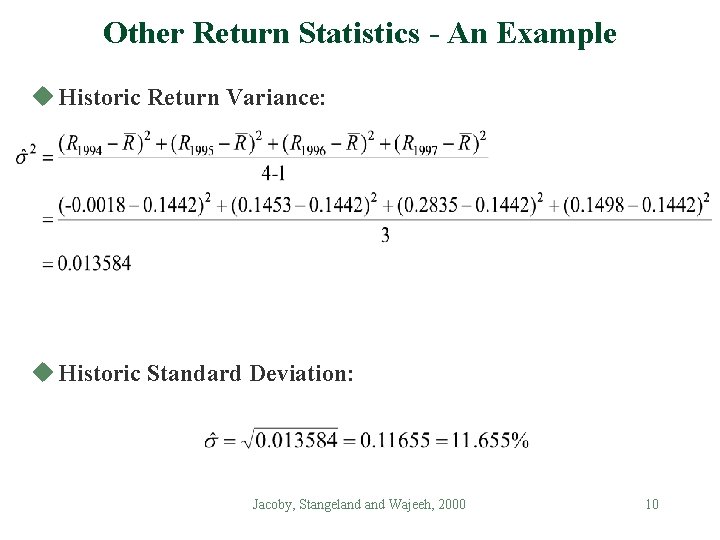
Other Return Statistics - An Example u Historic Return Variance: u Historic Standard Deviation: Jacoby, Stangeland Wajeeh, 2000 10
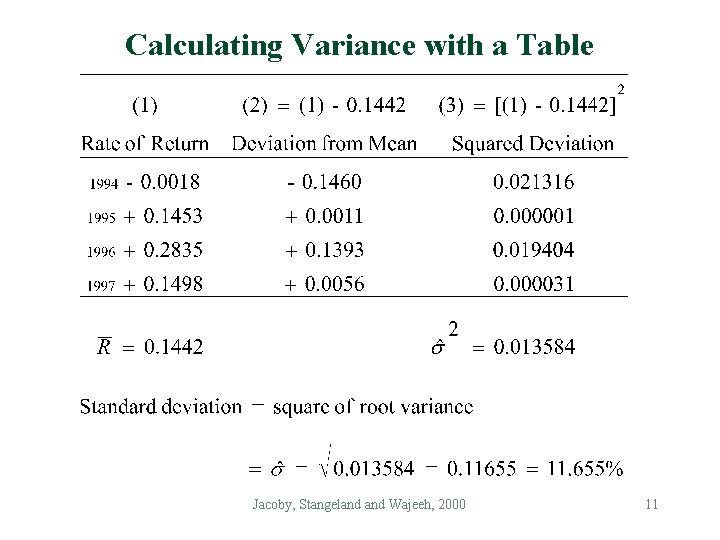
Calculating Variance with a Table Jacoby, Stangeland Wajeeh, 2000 11
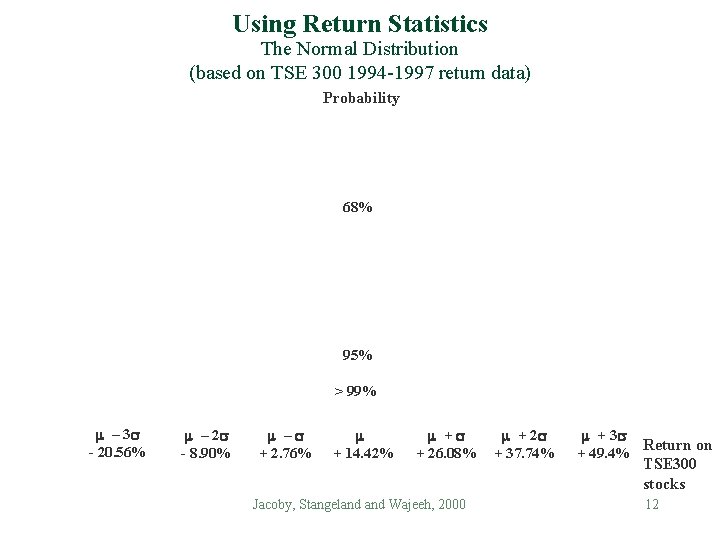
Using Return Statistics The Normal Distribution (based on TSE 300 1994 -1997 return data) Probability 68% 95% > 99% m – 3 s - 20. 56% m – 2 s - 8. 90% m –s + 2. 76% m + 14. 42% m +s + 26. 08% Jacoby, Stangeland Wajeeh, 2000 m + 2 s + 37. 74% m + 3 s Return on + 49. 4% TSE 300 stocks 12
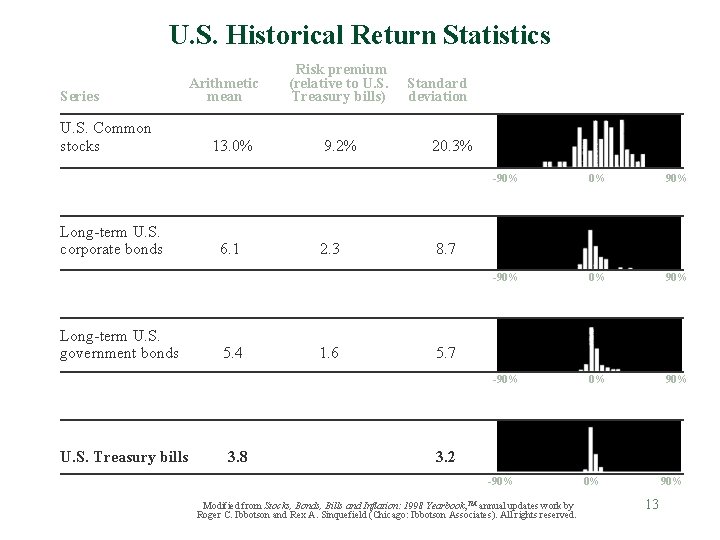
U. S. Historical Return Statistics Series U. S. Common stocks Long-term U. S. corporate bonds Long-term U. S. government bonds U. S. Treasury bills Arithmetic mean 13. 0% 6. 1 5. 4 3. 8 Risk premium (relative to U. S. Treasury bills) 9. 2% 2. 3 1. 6 Standard deviation 20. 3% -90% 0% 90% 8. 7 5. 7 3. 2 -90% Modified from Stocks, Bonds, Bills and Inflation: 1998 Yearbook, TM annual updates work by Roger C. Ibbotson and Rex A. Sinquefield (Chicago: Ibbotson Associates). All rights reserved. 0% 90% 13