Chapter 9 Formation and Growth of Ice Crystals

 Freezing of a liquid droplet (2) Direct")


 Crystal")


 explained that ice concentrations")


 Here the kinetic effects and ventilation")
 depends on temperature")


- Slides: 44
Chapter 9 Formation and Growth of Ice Crystals
Two phase transitions for ice formation: (1) Freezing of a liquid droplet (2) Direct deposition of vapor to the solid ice n An important fact: esi < esw for T < 0 o. C If the vapor in the cloud is saturated w. r. t. liquid water, it is supersaturated to ice. In a few minutes, a crystal can grow to 30~90 μm in size with terminal velocity of 20~40 cm/s. n The growth processes for ice crystals are mainly diffusion followed by coagulation. n Diffusion growth is more significant for the crystal than for the droplet because of the difference in saturation vapor pressure over water and ice. n
Nucleation of the ice phase n n Homogeneous freezing of a pure liquid drop occurs when statistical fluctuations of the molecular arrangement of the water produce a stable, icelike structure that can serve as an ice nucleus. Two factors determine the conditions for homogeneous nucleation of freezing: (1) the size of the stable nucleus and (2) the probability of occurrence of embryonic ice nuclei by random rearrangement of water molecules. The occurrence of embryonic ice nuclei depend on the surface free energy of a crystal/liquid interface, with a numerical value close to 2. 0 × l 0 -2 N/m. Most droplets smaller than 5μm will freeze spontaneously at a temperature of about – 40 o. C, and larger droplets can freeze at slightly warmer temperatures.
Nucleation of the ice phase n n n In natural clouds, few liquid drops are observed to exist at temperatures as cold as – 40 o. C, implying that heterogeneous freezing usually occurred at temperatures warmer than – 40 o. C. Some liquid in clouds as cold as – 20 o. C is not uncommon. Homogeneous deposition occurs when vapor molecules form a stable ice embryo by chance collisions. Although the surface free energy of a crystal/vapor interface is poorly known, theory predicts that homogeneous nucleation of deposition should only occur for extreme conditions of supersaturation. More than twenty-fold supersaturation with respect to ice is required at a temperature a few degrees below 0 o. C, and still higher supernaturations at colder temperatures. Despite the experimental uncertainties, it is clear that
Nucleation of the ice phase n n Ice crystals usually appear in a cloud in appreciable number when the temp. T < – 15 o. C, signifying heterogeneous nucleation. Water in contact with most materials freezes at temperatures warmer than – 40 o. C, and deposition occurs on most surfaces at supersaturations and supercoolings less than the homogeneous nucleation values. Thus the nucleation of ice in supercooled water or a supersaturated environment is aided by the presence of foreign (ice nuclei) surfaces or suspended particles. The foreign material provides a surface on which water molecules can impinge, stick, bond together, and form aggregates with an icelike structure.
Nucleation of the ice phase n n n The probability of heterogeneous nucleation of freezing or deposition depends strongly on the properties of the substrate material as well as on the supercooling and supematuration. The more tightly-bound the water molecules are to the substrate, the greater will be the probability of ice nucleation. In addition, if the crystal structure of the substrate closely resembles that of an ice crystal plane, it will increase the chances of ice nucleation. Supercooled clouds in the atmosphere develop and exist in the presence of vast numbers of aerosol particles, a small fraction of which can serve as ice nuclei at temperatures considerably warmer than the – 40 o. C threshold for homogeneous freezing. The schematic diagram in Fig. 9. 1 shows several possible nucleation mechanisms.
Nucleation of the ice phase ICE NUCLEATION MECHANISMS Fig. 9. 1. Schematic picture of the different ways atmospheric ice nuclei can account for ice formation n It is clear that the subject of ice nucleation is beset with theoretical and experimental uncertainties. Knight (1979) may be consulted for a review of some of the fundamental questions.
Experiments on heterogeneous ice nucleation n n The nucleating properties of small particles are studied by introducing the particles into cloud chambers with controlled supercooling and supersaturation. Other experiments consist of adding finely divided material to supercooled, purified water and noting the threshold temperature for freezing. Table 9. 1 summarizes the threshold ice-forming temperatures of certain pure and natural substances. Also listed are the dimensions of the two axes that characterize the lattice structure of the crystalline substances. The material matching ice the closest in structure is silver iodide (Ag. I), with a relatively warm nucleation temperature. Ag. I is thus the most widely used substance for artificial cloud seeding.
TABLE 9. 1. Temperatures at which different substances nucleate ice. (From Houghton, 1985) Crystal lattice dimension Temperature to nucleate Substance A axis (Å) c axis (Å) ice (o. C) Comments Ice 4. 52 7. 36 0 --- Ag. I 4. 58 7. 49 – 4 Insoluble Pb. I 2 4. 54 6. 86 – 6 Slightly soluble Cu. S 3. 80 16. 43 – 7 Insoluble Cu. O 4. 65 5. 11 – 7 Insoluble Hg. I 2 4. 36 12. 34 – 8 Insoluble Ag 2 S 4. 20 9. 50 – 8 Insoluble Cd. I 2 4. 24 6. 84 – 12 Soluble I 2 4. 78 9. 77 – 12 Soluble Pure substances
Atmospheric ice nuclei n n Several methods have been used to study atmospheric ice nuclei. The common methods are cloud chambers and filter systems into which air samples are drawn. In the cloud chambers, the sample is cooled down to a controlled temperature and a cloud is formed by adding sufficient water vapor. An optical system is used to count the number of ice crystals that form as a function of the degree of supercooling. The second method is to collect aerosols by drawing the air sample through filter paper with known pore sizes. The particulates trapped on the filters are then introduced to an environment suitable for ice crystal development and observations are made of the number of crystals that form on a substrate.
Atmospheric ice nuclei n n The concentrations of atmospheric ice nuclei inferred from these methods of detection are subject to uncertainty because of the major influence of the history of the aerosol, the humidity of the cloud chamber, and other experimental variables. Fletcher (1962) gave a typical concentration of one ice nucleus per liter of air at a temperature of – 20 o. C, increasing by a factor often for each 4 o. C of additional cooling. Taking a typical concentration of aerosol particles of 104 cm 3, we see that the one nucleus per liter active at – 20 o. C is only one particle in l 07. Although uncertainties remain, much evidence points to clay minerals, especially kaolinite (see Table 9. 1), as a major component of atmospheric ice nuclei. This is a common material found in many soil types. The nucleation threshold is at a fairly warm temperature of – 9 o. C.
Atmospheric ice nuclei n n The bacteria in decaying plant leaf material can be an effective ice nuclei at warm temperatures. Vali and his colleagues showed that the bacterium Pseudomonas syringae itself serves as an ice nucleus at a temperature as warm as – 1. 3 o. C, although its nucleating ability is a rare and changeable property. More ice nuclei is over land than over the ocean. The concentrations of ice nuclei also tend to decrease with altitude over land, indicating a source at the surface. Several material may serve as atmospheric ice nuclei. Depending on temperature, humidity, and proximity to sources, one may be more important than the others in a given cloud. Although the atmosphere has many CCN (cloud condensation nuclei), ice nuclei are scarce. Thus the supercooling of cloud water to – 15 o. C or colder is not uncommon, though supersaturations exceeding l% in the atmosphere are very rare.
The ice phase in clouds n n The occurrence of ice crystals in clouds is related to cloud type, temperature, and cloud age. Overall, observations confirm that the colder the cloud temperature, the greater is the likelihood that some ice crystals are present along with the supercooled water droplets. Ice is more common in decaying cumulus clouds than in newly developing clouds, and is more common in stratiform clouds than in cumulus clouds with the same cloud-top temperature. Measured concentrations of ice crystals in clouds range from the lower limit of 0. 01 L-1 (per liter) to about l 00 L-1. Concentrations are high in cirrus clouds, and still higher in ice fogs, which develop under extremely cold arctic conditions.
The ice phase in clouds n The first crystals to appear in a cloud must form on ice nuclei. Additional crystals may then be produced by secondary processes in which the primary crystals are “multiplied”. FIG. 9. 2. Summary of observed ice particle concentrations for clouds in which secondary processe of ice formation are believed to be unimportant. Temperatures refer to the origins of the ice particle the data have been averaged over intervals of 5 o. C. (Data compiled by W. A. Cooper. ) (Adapted fro Vali, 1985. )
The ice phase in clouds n n n Mossop (1985) explained that ice concentrations usually agree with the nucleus concentrations to within a factor of ten in clouds that contain no drops larger than 25μm diameter at temperatures warmer than –l 0 o. C. Two mechanisms are recognized as contributing to secondary ice particle production: the fracture of ice crystals and the shattering or splintering of freezing drops. Many crystal fragments are included with falling snow. These are probably produced when dense graupel particles overtake and collide with fragile, slower-falling dendritic crystals. Another mechanism of ice multiplication, thought to be very effective in the right conditions, is the production of secondary particles when supercooled drops of the appropriate size and temperature are captured by graupel particles Hallett and Mossop (1974) showed that small particles are ejected by drops larger than 25μm in diameter when they freeze on to an ice substrate at temperatures between – 3 o. C and – 8 o. C.
The ice phase in clouds n n n At temperatures warmer than – 3 o. C drops tend to spread over the ice surface instead of freezing as discrete drops. At temperatures colder than – 8 o. C the freezing is thought to proceed so rapidly, starting with an outer shell of ice, that disruption does not occur. Drops smaller than 25μm in diameter probably freeze too rapidly to be disrupted. This mechanism of secondary particle production, sometimes called rime-splintering, may account for high concentrations of ice crystals that are sometimes observed in maritime cumulus clouds with temperatures no colder than –l 0 o. C. Because our understanding of secondary production processes of ice crystals is very limited, many observations of crystal concentrations cannot be explained quantitatively (Mossop, 1985).
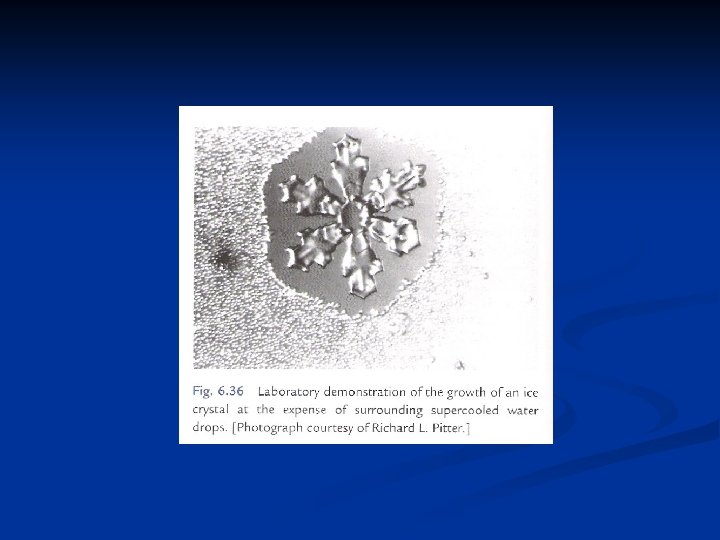
Diffusional growth of ice crystals n n When the first ice crystals nucleate in a cloud, they are in an environment in which the vapor pressure is equal to or slightly greater than the equilibrium vapor pressure es over liquid water. The saturation ratio relative to ice may be written (9. 1) where S denotes the saturation ratio with respect to water. FIG. 9. 3. Supersaturation relative to ice in an atmosphere at equilibrium saturation relative to wate
Diffusional growth of ice crystals n n n Fig. 9. 3 shows that a water-saturated cloud has high supersaturation relative to ice and is a favorable environment for rapid growth by diffusion and deposition. The environment will remain favorable for crystal growth as long as liquid droplets are available to evaporate and maintain the vapor pressure at equilibrium relative to water. If the droplets eventually disappear, by evaporation or freezing, the saturation ratio will decrease to equilibrium relative to ice. The problem of determining the rate of growth of a crystal by diffusion is analogous to that of the growth of a water droplet by condensation but with a complication because of the nonspherical shape of the crystal. Maxwell in his theory of the wet-bulb thermometer solved the equations of heat and mass transfer by drawing on the analogy between the diffusion equation and equations in electrostatics that describe the distribution of potential around a charged conductor with a nonspherical shape.
Diffusional growth of ice crystals n n The electrostatic analogy is the starting point of theory of ice crystal growth by diffusion. The generalized diffusion growth for ice crystal is (9. 2) where C denotes the electrical capacitance, with length units, a function of the size and shape of the particle. For a sphere, C = r and (9. 2) reduces to the growth equation for a water droplet (7. 7). For a circular disk of radius r, like plate-type ice crystals, C = 2 r/π. Ice needles may be approximated by the formula for a prolate spheroid of major and minor semi-axes a and b, for which and For an oblate spheroid, where the ellipticity is
Diffusional growth of ice crystals n n n Plane dendrites and plates, however, which are common crystal types, can be reasonably approximated by a circular disk of equal area. Likewise needles can be approximated by long prolates. Under stationary growth conditions the value of ρvr over an ice crystal surface is determined by the balance between the rates of latent heating and heat transfer away from the surface, which balance is expressed (9. 3) Following thermodynamic arguments in Chapter 7, (9. 2) and (9. 3) may be combined to give an analytical expression for crystal growth rate. This formula is precisely the same as was obtained for water drops if we replace r by C, es(T) by ei(T) and L by Ls, the latent heat of sublimation:
Diffusional growth of ice crystals n (9. 4) Here the kinetic effects and ventilation are neglected, since these effects are not understood for ice crystals as well. n n Experiments by Fukuta (1969) indicated that at temperatures between about 0 o. C and – 10 o. C the growth rates of small crystals are about half as fast as predicted by (9. 4). For large crystal sizes, the formula may be a better approximation. However, ventilation effects become important when the crystal is large enough to fall with a significant velocity relative to air. These effects tend to increase the growth rate, and may be included by modifying the two terms in the denominator of (9. 4) with aerodynamic correction factors given by Koenig (1971).
Diffusional growth of ice crystals n The denominator of (9. 4) depends on temperature and pressure in approximately the manner indicated in Fig. 7. 1 for water droplets. Byers (1965) combined his temperature dependence with that of Si, assuming a water-saturated environment, to determine the dependence of ice crystal growth rate on temperature and pressure as shown in Fig. 9. 4. FIG. 9. 4. Normalized ice crystal growth rate as a function of temperature. (Adapted from Byers, 19
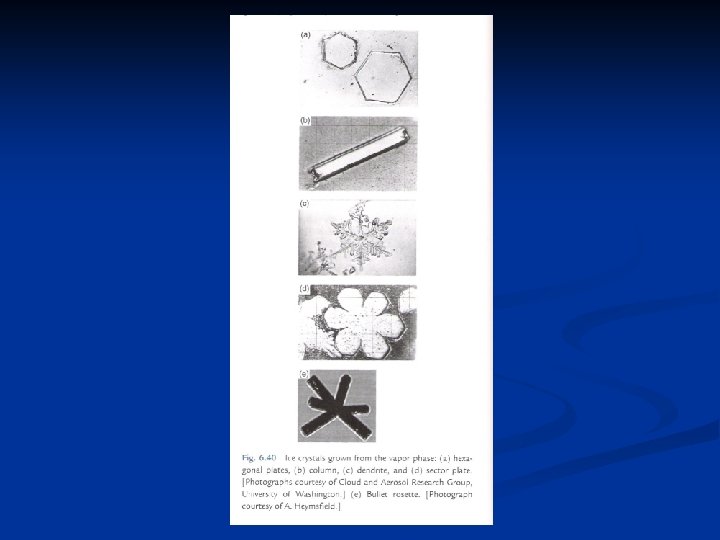
Diffusional growth of ice crystals n n These curves in Fig. 9. 4 indicate that the growth rate varies inversely with pressure, and that the temperature for maximum growth is about – 15 o. C over a wide range of pressure. All of ice crystal forms are basically hexagonal structures, but with widely different axis ratios. Figure 9. 5 illustrates the main crystal types, namely column, plate, and dendrite. Sector stars are formed when plates develop peripheral dendritic structure; capped columns arise when columns develop plates on their ends. The intricate stellar shapes which are often observed are variations on the dendritic form. FIG. 9. 5. Schematic representation of the main shapes of ice crystals: (a) column; (b) plate; (c) dend
Diffusional growth of ice crystals FIG. 9. 6. Kobayashi’s diagram of crystal habit as function of temperature and excess vapor density over ice saturation. (From Fletcher, 1962. ) n Figure 9. 6 showed the dependence of crystal habit on environmental conditions, based on the work by Kobayashi. This figure also indicates the excess vapor density over ice equilibrium in an atmosphere saturated with respect to plane
Diffusional growth of ice crystals n n Fig. 9. 6 shows that the excess vapor density is a maximum at about –l 5 o. C, also the temperature of maximum growth rate. The treatment of crystal growth as a process controlled by diffusion of water vapor cannot explain the different growth habits of ice from one habit to another. Ice crystal surface is made up of flat terraces of different heights terminating at ledges and separated by steps. Molecules of water that impinge on the surface of the crystal are bound more strongly at the ledges than on the terraces. The rate of growth is determined by the rates at which steps are generated and advance, and these rates in turn are controlled by temperature and supersaturation. These kinetic effects determine the crystal habit and tend to slow the rate of crystal growth from the value given by the continuum vapor diffusion theory.
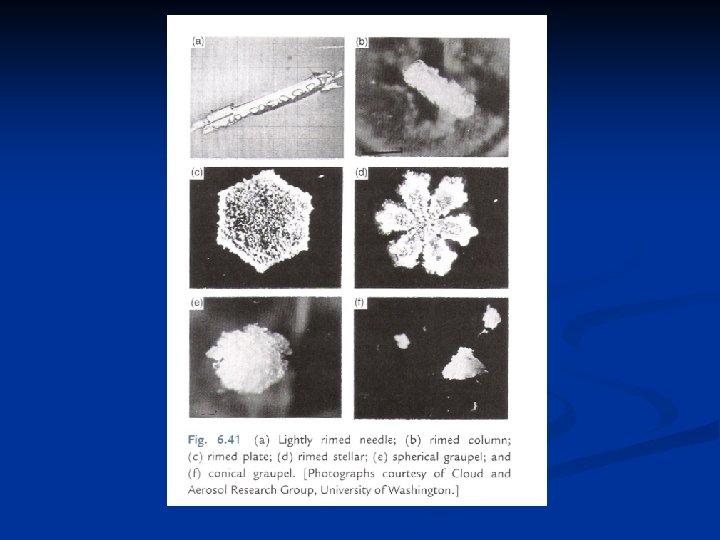
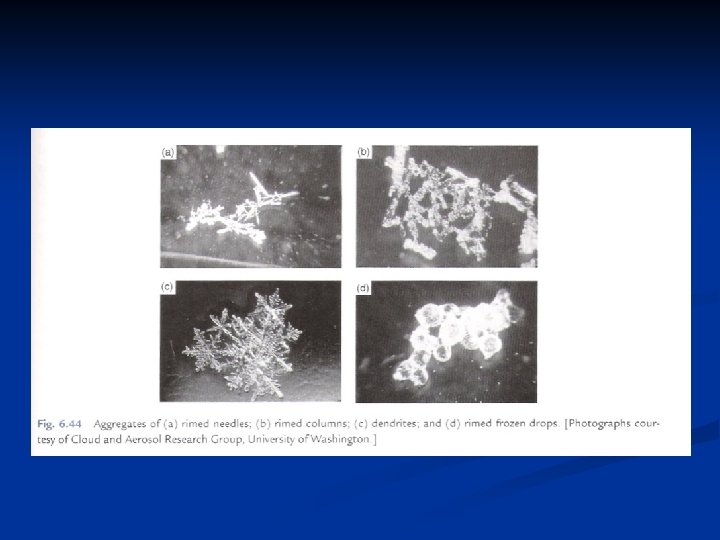
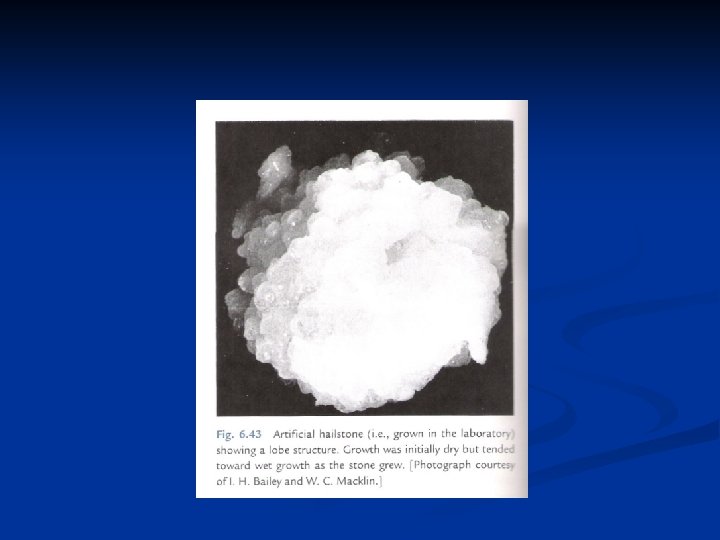
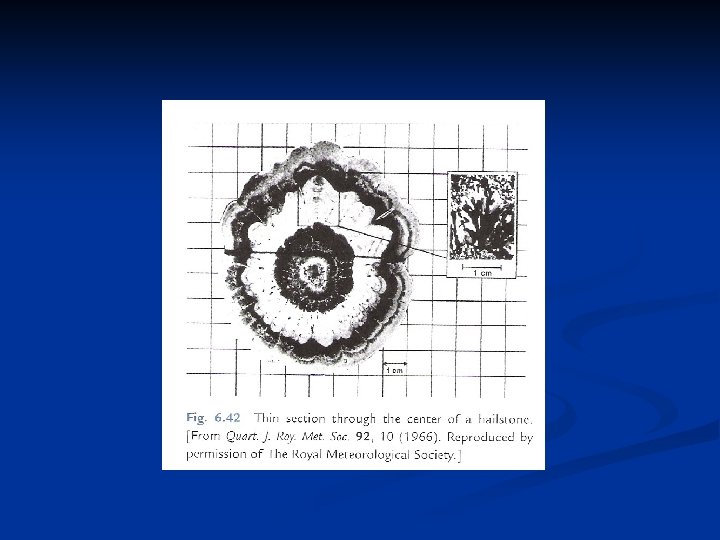
Further growth by accretion n Accretion refers to the capture of supercooled droplets by an icephase precipitation particle. If the droplets freeze immediately on contact they form a coating of rime, leading to rimed crystals or graupel. If the freezing is not immediate, denser structures are created, of which hail is an extreme example. n Coalescence refers to the capture of small cloud droplets by larger cloud drops, like the capture of cloud droplets by raindrops. Aggregation is the clumping together of ice crystals to form snowflakes. Important in ice crystal growth by collision and capture is the falls speed of ice crystals, given in Fig. 9. 7. The fastest falling crystals are graupel particles (which are not really crystals, but aggregates of frozen droplets). The rimed structures (crystal with droplets) fall at about 1 m/s, but all the pure crystal types fall n n
Further growth by accretion FIG. 9. 7. Nakaya and Terada’s measured terminal velocities of ice crystals. (From Fletcher, 1962
Further growth by accretion n An empirical formula that provides an approximate fit to the graupel curve is u = 343 D 0. 6, (9. 5) where u in cm/s and D, the diameter of the sphere which just circumscribes the particle, in cm. n Snowflakes are found to fall at about 1 m/s as they are dry. When melting begins they become more compact and fall faster. Langleben (1954) approximated snowflake fall speed as u = k. Dn, (9. 6) where D is the melted diameter in cm and u the fall speed in cm/s. n
Further growth by accretion TABLE 9. 2. Values of a and b in (9. 7) for D in cm and m in g Crystal type n a b Graupel 6. 5× 10 -2 3 Tin hexagonal plate 1. 9× 10 -2 3 Stellar crystal 9. 4× 10 -4 2 Planar dendrite 3. 8× 10 -4 2 Needle 2. 9× 10 -5 1 The mass and size of different forms of ice crystals are usually related by empirical formulas of the form m = a D b, (9. 7) where D is the major linear dimension of the crystal. Values of a and b for several typical crystal forms are given in Table 9. 2, taken from data in Mason (1971) and Houghton (1985).
Further growth by accretion n In the process of growth by accretion the question of collection efficiency arises. First there is the aerodynamic problem of collision efficiency; then the question of whether sticking occurs, given a collision. Not much is known about either side of the question. In the process of crystal aggregation, the collection efficiency is less well understood. Significant aggregation is possible only at temperatures warmer than –l 0 o. C. For accretional growth, leading to graupel, an approximation analogous to (8. 15) may be employed, (9. 8) where m is mass of particle, M cloud liquid water content, R radius of particle, u(R) fall speed, and is mean collection efficiency.
Further growth by accretion n n Basically the same approach may be used in analyzing the aggregation process. Since snowflakes all fall at about l m/s and ice crystals all fall at about 0. 4~0. 5 m/s, the growth equation for a snowflake is (9. 9) where is the difference in fall speed of the snowflake and the ice crystals, essentially a constant. Sometimes the population of ice crystals is characterized by the number density N than by the density of frozen water M. They are related by M = Nvρ, where v is the (average) volume of the crystals andρis their density. If the snowflake is assumed to have the same density, then m =ρV where V denotes its volume.
Further growth by accretion The growth equation of snowflake in terms of volume then becomes (9. 10) where. Clearly these equations must be understood as rough approximations to the actual growth processes. According to Fletcher (1962), calculations based on (9. l 0) have been found to give results in reasonable accord with observations on graupel and snowflakes. n Fundamentally, snowflakes must develop because a few ice crystals become larger than their neighbors, either by enhanced diffusional growth or by chance collision with other crystals or supercooled droplets. These crystals or small aggregates are in a favorable position to grow by the sweepout process. A complete theory for the development of snowflake should therefore take
The ice crystal process versus coalescence n n For precipitation particles of appreciable size to develop in the time available, it is necessary that aggregation or accretion take place in growth of the ice phase, or that coalescence occur in the all-water process. Condensation-diffusion alone cannot explain the formation of raindrop as large as 0. 5 mm in radius in realistic times. However, this process is more effective for ice crystals than for water droplets, because the vapor in the cloud is often at equilibrium relative to water and hence supersaturated with respect to ice. Light precipitation can occur in the form of individual ice crystals, indicating that aggregation or accretion never occurred. Some of the precipitation reaching the surface in the form of
The ice crystal process versus coalescence n n In warm clouds diffusional growth is too slow to produce drizzle-size drops in reasonable times; coalescence process is thus required to produce rain from such clouds. Many cumulus clouds develop initially at temperature warmer than 0 o. C, and then grow vertically to altitudes higher than the 0 o. C level, where ice crystal formation is likely to occur. In such clouds, both precipitation mechanisms may occur— initially the coalescence process among droplets, later the ice crystal process as well. Which process dominates in a given situation depends on the temperature at cloud top, the cloud liquid water content, and to some extent the droplet concentration. The coalescence process will tend to predominate in clouds that are relatively warm with high liquid water contents and low droplet concentrations.
The ice crystal process versus coalescence FIG. 9. 8. Times required for an ice crystal and a water droplet (solid curves) to grow to the indicated mass. Top scale gives the corresponding drop radius. Dashed curves are for the rates of fractional increase of mass, referred to the scale on the right. n Figure 9. 8 illustrates the times required for an ice crystal growing by diffusion and a drop growing by coalescence to reach a certain mass. For this comparison, favorable growth conditions were assumed for both precipitation forms. The ice crystal is a stellar dendrite growing in a water-saturated environment at
The ice crystal process versus coalescence n n n In Fig. 9. 8, the capacitance of the ice crystal is taken to be 2 r/π with r the radius of the circumscribing disk. Mass and radius are related by the empirical formula, m = 3. 8× 10 -3 r 2, with m in g and r in cm. The water drop starts with a radius of 25μm and grows by continuous collection in a cloud consisting of droplets all l 0μm in radius, with the liquid water content M of l g m-3. Realistic collection efficiencies are assumed. The crystal grows rapidly by diffusion, surpassing in size the initially more massive drop at 75 s, and continuing for a while to outpace the drop, whose growth is impeded at first by the small collection efficiency. The dashed curves in Fig. 9. 8 show the fractional rate of increase of mass, m-l(dm/dt), for the drop and the ice crystal. This quantity is initially much higher for the crystal, but it decreases as the crystal grows, following nearly a straight line on the coordinates, implying a power-law dependence of
The ice crystal process versus coalescence n n For the droplet, the fractional mass increase starts low and increases monotonically to an asymptotic value of 5× l 0 -3 s. For times up to 7 min the ice crystal grows relatively faster than the drop. By this time the drop has finally experienced enough collisions to reach a size where the collection efficiency is no longer small. In favorable conditions precipitation may be initiated by the ice crystal process in about l 0 min or by continuous collection of water in a time about 20 min. Radar observations showed that the first radar detectable precipitation often appears at cloud levels warmer than 0 o. C, indicating that coalescence can initiate precipitation even in clouds that extend vertically to cold temperatures. Depending on temperature, liquid water concentration, and droplet sizes, precipitation may be initiated in reasonable times by either process. Subsequent development of precipitation to significant sizes requires coagulation—continued coalescence
The ice crystal process versus coalescence n n n In Fig. 9. 8, the capacitance of the ice crystal is taken to be 2 r/π with r the radius of the circumscribing disk. Mass and radius are related by the empirical formula, m = 3. 8× 10 -3 r 2, with m in g and r in cm. The water drop starts with a radius of 25μm and grows by continuous collection in a cloud consisting of droplets all l 0μm in radius, with the liquid water content M of l g m-3. Realistic collection efficiencies are assumed. The crystal grows rapidly by diffusion, surpassing in size the initially more massive drop at 75 s, and continuing for a while to outpace the drop, whose growth is impeded at first by the small collection efficiency. The dashed curves in Fig. 9. 8 show the fractional rate of increase of mass, m-l(dm/dt), for the drop and the ice crystal. This quantity is initially much higher for the crystal, but it decreases as the crystal grows, following nearly a straight line on the coordinates, implying a power-law dependence of