Chapter 9 Day 1 Parameter and Statistic Parameter


- Slides: 9
Chapter 9 Day 1
Parameter and Statistic §Parameter – a number that describes a population, usually impossible to find §Statistic – A number described in a sample, use to estimate an unknown parameter.
Sampling Distribution § Parameters - parameters are measures from the entire POPULATION § Measures of center – mean, mode, median § Measures of spread – range, variance, standard deviation, Q 1, Q 3, minimum, maximum § Measures of percentage – population proportion § Statistics – statistics are measures from one SAMPLE § Measures of center – mean, mode, median § Measures of spread - range, variance, standard deviation, Q 1, Q 3, minimum, maximum § Measures of percentage – sample proportion
Notation Review § N = number in population § μ = population mean § σ2 = population variance § σ = population standard deviation § ρ = population proportion §
Example § For each boldface number state whether it is a parameter or a statistic and use appropriate notation to describe each number, for example p = 0. 65 § The Tennessee STAR experiment randomly assigned children to regular or small classes during their first four years of school. 40. 2% of African Americans from small classes took the ACT or SAT college entrance exam. Only 31. 7% of African Americans from regular classes took one of these exams.
Example § For each boldface number state whether it is a parameter or a statistic and use appropriate notation to describe each number, for example p = 0. 65 § A random sample of female college students has a mean height of 64. 5 inches, which is greater than the 63 -inch mean height of all adult American women.
Sampling Distribution §
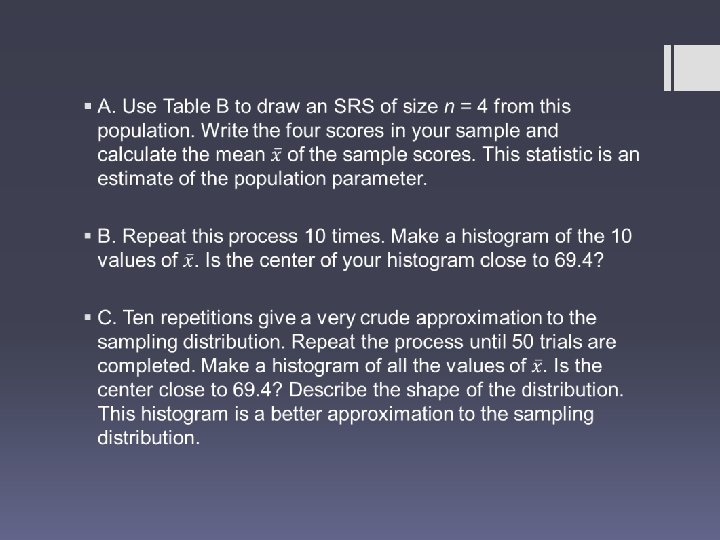
Example – Homework #6 § Student Score 0 1 2 3 4 5 6 7 8 9 82 62 80 58 72 73 65 66 74 62