Chapter 8 Sections 8 1 8 4 Bell

Chapter 8 Sections 8. 1 – 8. 4

Bell Ringer a. Find the conditional probability distribution of the opinions among seniors in the college. b. Find the marginal probability distribution of the opinions.

I CAN:

Daily Agenda • Bell Ringer • Review Bell Ringer • I CAN • Chapter 8

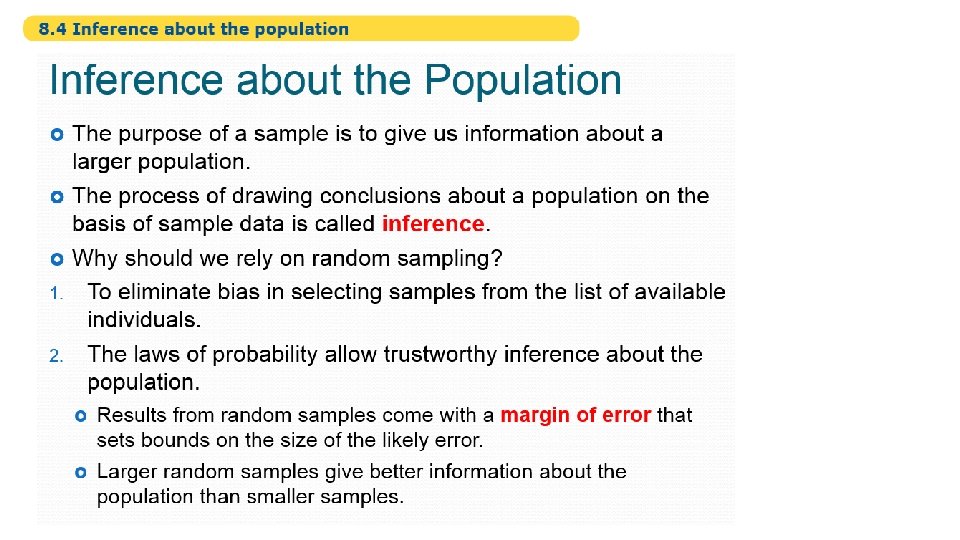
- A political scientist wants to know what percent of college-age adults consider themselves conservatives. - An automaker hires a market research firm to learn what percent of adults aged 18 to 35 recall seeing television advertisements for a new gas-electric hybrid car. - Government economists inquire about average household income. In all these cases, we want to gather information about a large group of individuals. Time, cost, and inconvenience preclude contacting every individual. So we gather information about only part of the group to draw conclusions about the whole.

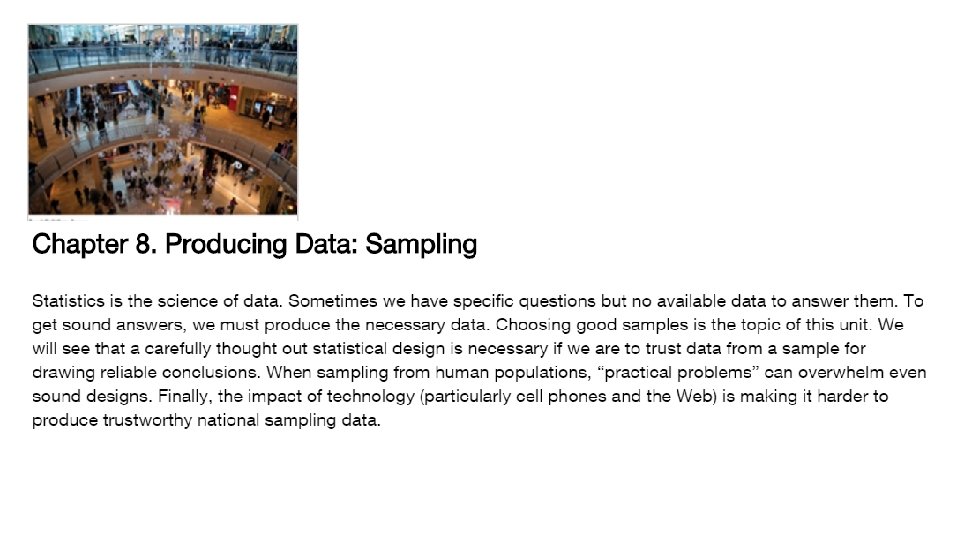
The distinction between population and sample is basic to statistics. To make sense of any sample result, you must know what population the sample represents. The first step in planning a sample survey is to say exactly what population we want to describe. The second step is to say exactly what we want to measure, that is, to give exact definitions of our variables.

-The most important government sample survey in the United States is the monthly Current Population Survey (CPS) conducted by the Bureau of the Census for the Bureau of Labor Statistics. -The CPS contacts about 60, 000 households each month. It produces the monthly unemployment rate and much other economic and social information. (See Figure 8. 1. ) -To measure unemployment, we must first specify the population we want to describe. Which age groups will we include? Will we include illegal immigrants or people in prisons? The CPS defines its population as all U. S. residents (legal or not) 16 years of age and over who are civilians and are not in an institution such as a prison. The unemployment rate announced in the news refers to this specific population.

The second question is harder: what does it mean to be “unemployed”? Someone who is not looking for work—for example, a full-time student—should not be called unemployed just because she is not working for pay. If you are chosen for the CPS sample, the interviewer first asks whether you are available to work and whether you actually looked for work in the past four weeks. If not, you are neither employed nor unemployed—you are not in the labor force. So discouraged workers who haven’t looked for a job in four weeks are excluded from the count.

If you are in the labor force, the interviewer goes on to ask about employment. -If you did any work for pay or in your own business during the week of the survey, you are employed. -If you worked at least 15 hours in a family business without pay, you are employed. -You are also employed if you have a job but didn’t work because of vacation, being on strike, or other good reason. An unemployment rate of 6. 7% means that 6. 7% of the sample was unemployed, using the exact CPS definitions of both “labor force” and “unemployed. ”

8. 1 Sampling Students. A political scientist wants to know how college students feel about the Social Security system. She obtains a list of the 3456 undergraduates at her college and mails a questionnaire to 250 students selected at random. Only 104 questionnaires are returned. (a)What is the population in this study? Be careful: about what group does she want information? (b)What is the sample? Be careful: from what group does she actually obtain information? The important message in this problem is that the sample can redefine the population about which information is obtained.

8. 2 Student Archaeologists. An archaeological dig turns up large numbers of pottery shards, broken stone implements, and other artifacts. Students working on the project classify each artifact and assign it a number. The counts in different categories are important for understanding the site, so the project director chooses 2% of the artifacts at random and checks the students’ work. What are the population and the sample here?

8. 3 Software Survey. A statistical software company is planning on updating Version 8. 1 of its software and wants to know what features are most important to users. The company’s managers have the email addresses of 1100 individuals, mostly faculty at universities, for whom they have supplied free courtesy copies of Version 8. 1. They email these 1100 individuals and ask them to complete a survey online. A total of 186 of these individuals complete the survey. (a)What is the population of interest to the software company? Do you think the 1100 individuals contacted are representative of the population? Explain your reasons. (b)What is the sample? From what group is information actually obtained?
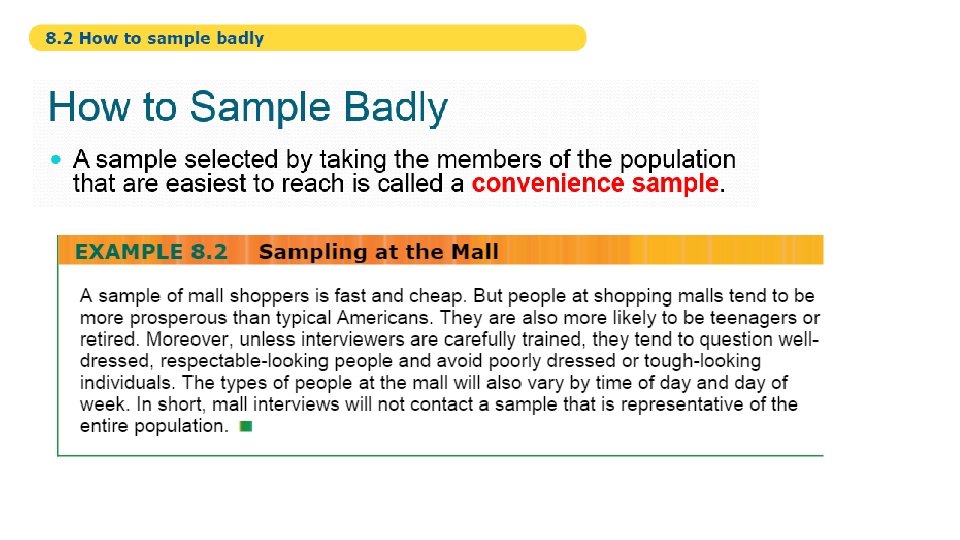

Interviews at shopping malls will almost surely overrepresent middle-class and retired people and underrepresent the poor. This will happen almost every time we take such a sample. That is, it is a systematic error caused by a bad sampling design, not just bad luck on one sample. This is bias: the outcomes of mall surveys will repeatedly miss the truth about the population in the same ways.

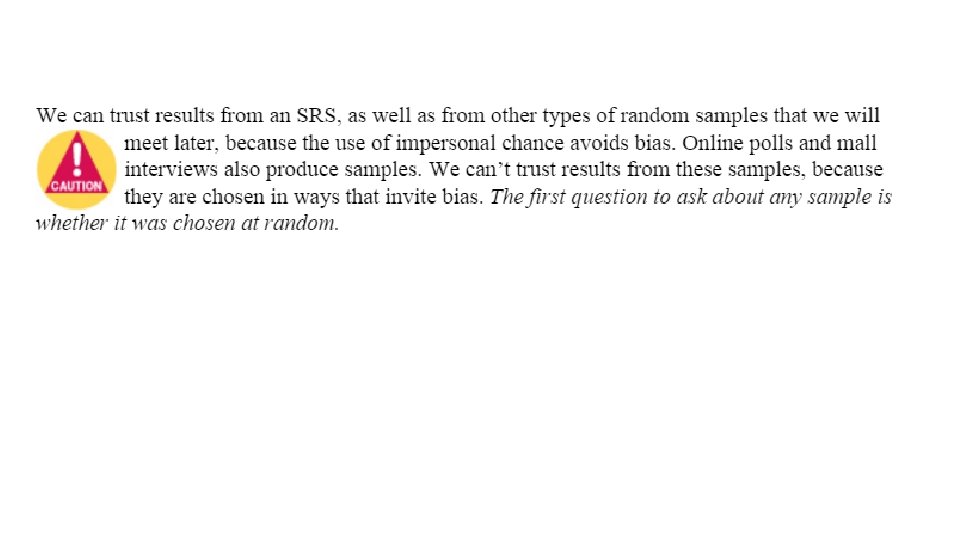
Caution: People who take the trouble to respond to an open invitation are usually not representative of any clearly defined population.

8. 4 Sampling on Campus. You see a student standing in front of the student center, now and then stopping other students to ask them questions. She says that she is collecting student opinions for a class assignment. Explain why this sampling method is almost certainly biased.

8. 5 More Sampling on Campus. You would like to start a club for psychology majors on campus, and you are interested in finding out what proportion of psychology majors would join. The dues would be $35 and used to pay for speakers to come to campus. You ask five psychology majors from your senior psychology honors seminar whether they would be interested in joining this club and find that four of the five students questioned are interested. Is this sampling method biased, and if so, what is the likely direction of bias?

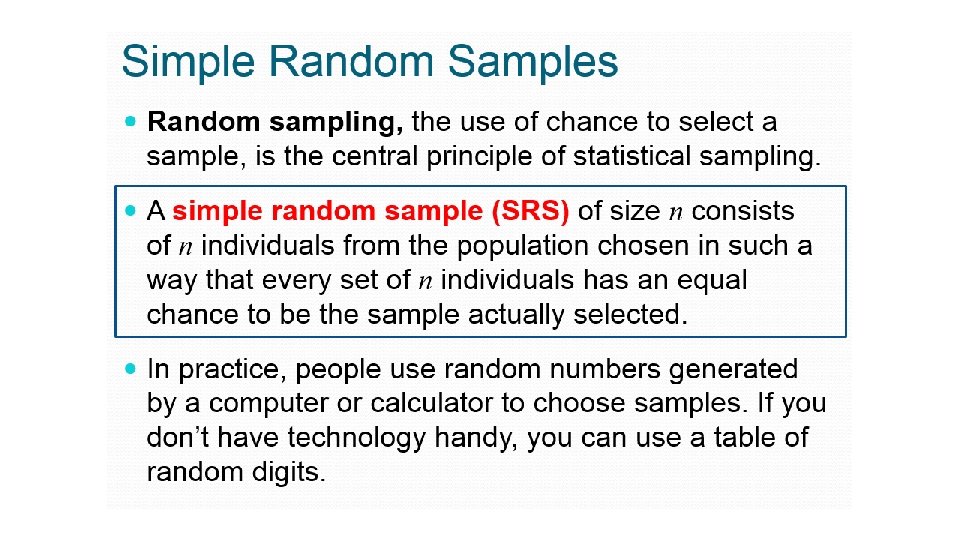
In a voluntary response sample, people choose whether to respond. In a convenience sample, the interviewer makes the choice. In both cases, personal choice produces bias. The statistician’s remedy is to allow impersonal chance to choose the sample. A sample chosen by chance rules out both favoritism by the sampler and self-selection by respondents. Choosing a sample by chance attacks bias by giving all individuals an equal chance to be chosen. Rich and poor, young and old, liberal and conservative, all have the same chance to be in the sample. The simplest way to use chance to select a sample is to place names in a hat (the population) and draw out a handful (the sample). This is the idea of simple random sampling.
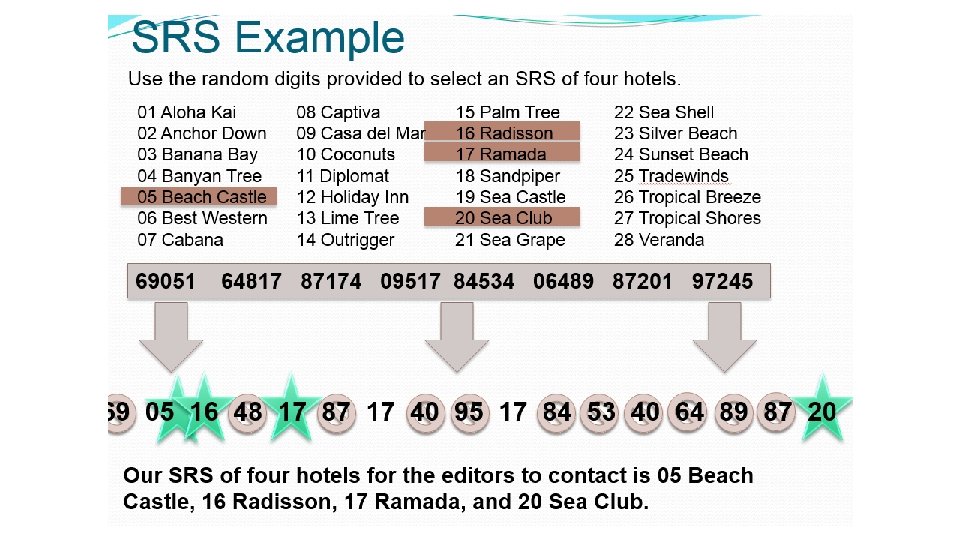

8. 6 Apartment Living. You are planning a report on apartment living in a college town. You decide to select three apartment complexes at random for in-depth interviews with residents. Use Table B (start at line 128. ) to select a simple random sample of four of the following apartment complexes. Ashley Oaks Bay Pointe Beau Jardin Bluffs Brandon. Place Briarwood Brownstone Burberry Place Cambridge Chauncey Village Country View Country Villa Crestview Del-Lynn Fairington Fairway Knolls Fowler Franklin Park Georgetown Greenacres Mayfair Village Nobb Hill Pemberly Courts Peppermill Pheasant Run River Walk Sagamore Ridge Salem Courthouse Village Square Waterford Court

8. 7 Minority Managers. A firm wants to understand the attitudes of its minority managers toward its system for assessing management performance. Following is a list of all the firm’s managers who are members of minority groups. Use Table B at line 141 to choose five managers to be interviewed in detail about the performance appraisal system Adelaja Ahmadiani Barnes Bonds Burke Deis Ding Draguljic Fernandez Fox Gao Gemayel Gupta Hernandez Huo Ippolito Jiang Jung Mani Mazzeo Modur Rettiganti Rodriguez Sanchez Sgambellone Yajima

8. 8 Sampling Gravestones. The local genealogical society in Coles County, Illinois, has compiled records on all 55, 914 gravestones in cemeteries in the county for the years 1825 to 1985. Historians plan to use these records to learn about African Americans in Coles County’s history. They first choose an SRS of 395 records to check their accuracy by visiting the actual gravestones. (a)How would you label the 55, 914 records? (b)Use Table B, starting at line 137, to choose the first five records for the SRS.

8. 9 Ask More People. In the 2012 presidential pre-election surveys, Pew Research sampled 1, 112 likely voters during October 4 -7, 2012, and asked if they were planning to vote for Obama, and then asked the same question of a sample of 1, 495 likely voters taken from October 24 -28, 2012. However, in their last survey taken October 31 -November 3, 2012, just before the election held on November 6, 2012, they asked this question of a sample of 2, 709 likely voters. Why do you think Pew did this?

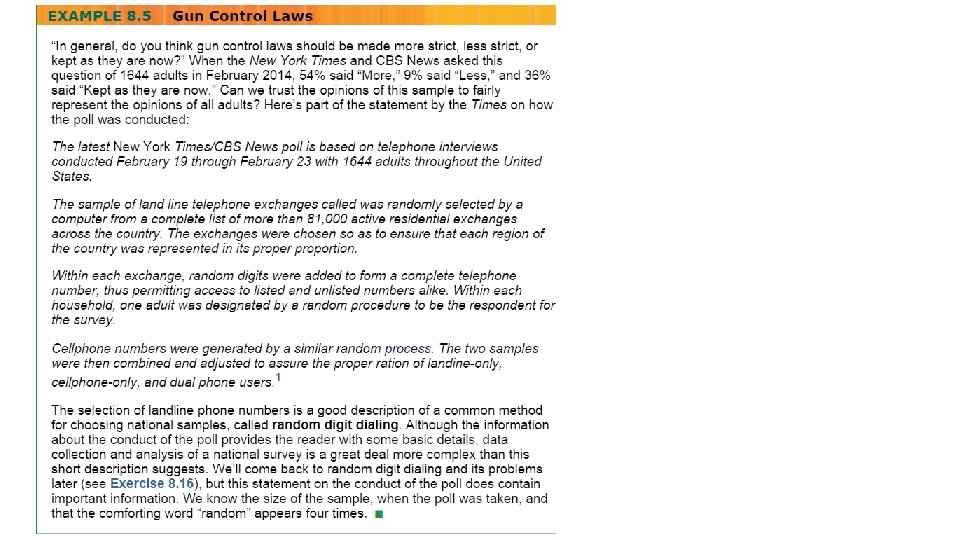
8. 10 How Accurate Is the Poll? The New York Times/CBS News poll conducted during February 19 -23, 2014, included 1644 adults, of which 519 were Republican, 515 were Democrats, 550 were Independent, and 60 didn’t know or didn’t respond. Each person sampled was asked their opinion on a variety of issues facing the nation, such as, “Do you feel that the distribution of money and wealth in this country is fair, or do you feel that the money and wealth in this country should be more evenly distributed among more people? ” The margin of error (we will give more detail in later chapters) was reported as ± 3% for the entire sample. When considering the opinions of only the Republicans in the sample, the margin of error was reported as ± 6%. What do you think explains the fact that estimates for Republicans were less precise than for the entire sample?
- Slides: 34