Chapter 8 Estimating With Confidence What is a


 Upper tail prob. 90% 0. 05 0.")
 Upper tail prob. 95% 0. 025 0.")
 Upper tail prob. 99% 0. 005 0.")


- Slides: 12
Chapter 8: Estimating With Confidence What is a confidence interval?
Statistical Inference: Using sample data to draw conclusions about a population Note: Each sample may vary, but the population parameter doesn’t! Point Estimator – a statistic that provides an estimate of a population parameter Example: Estimate the percent (proportion) of time a Hershey’s kiss will land on its base when dropped
Confidence Interval: • Uses the sample distribution to predict population parameter • It is an interval of numbers above and below the sample statistic • Example: “I am 95% confident that the interval 45% to 55% captures the true percentage of Harrison students that did all of their homework last night.
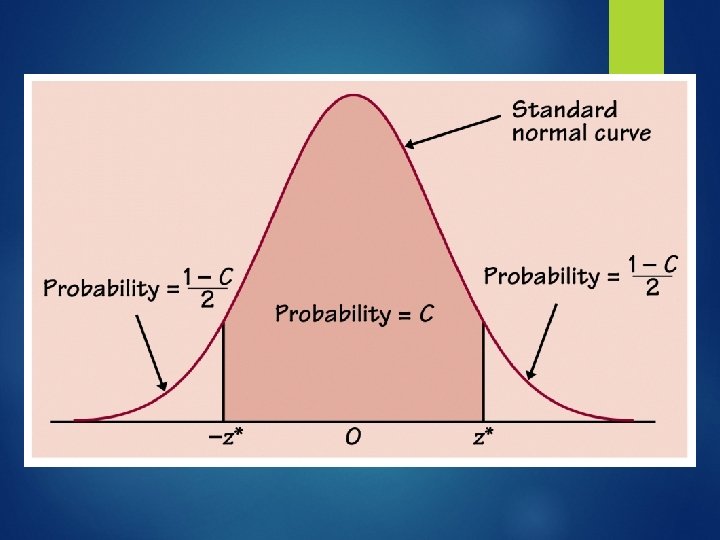
Confidence Level: The probability the interval will capture the true parameter value in repeated samples – 90% or higher Critical Value: The value that has the probability p lying to its right under the standard Normal curve. ( Z* )
Margin of Error: • How accurate our estimate is based on the variability of the sample distribution. We add and subtract this from our estimate margin of error Caution: Margin of error is only from random sampling errors. This does not include errors in collecting the data!
Most Common Critical Values Confidence Level (C) Upper tail prob. 90% 0. 05 0. 90 0. 05 Z=? Z* Value 1. 645
Most Common Critical Values Confidence Level (C) Upper tail prob. 95% 0. 025 0. 95 0. 0255 Z=? 0. 025 Z=? Z* Value 1. 96
Most Common Critical Values Confidence Level (C) Upper tail prob. 99% 0. 005 0. 99 0. 005 Z=? Z* Value 2. 576
Interpreting a Confidence Interval: What you will say: I am C% confident that interval _______ to ____ captures the true parameter. What it means: If we took many, many SRS from a population and calculated a confidence interval for each sample, C% of the confidence intervals will contain the true parameter.
CAUTION! Never Say: The interval will capture the true mean C% of the time. It either does or does not!
Steps to Construct ANY Confidence Interval: PANIC P: Parameter of Interest (what are you looking for? ) A: Assumptions (what are the conditions? ) N: Name the type of interval (what type of data do we have? ) I: Interval (Finally! You can calculate!) C: Conclusion in context (I am ___% confident the interval ______ to _______ captures the true parameter (in context).