CHAPTER 8 CADAVERIC ORGAN AND TISSUE DONATION Editors


 <1")

 in 2008 Number of donors (n) 6 4 2 0")

 30 25 20 15 10 5 0")

 30 25 20 15 10")

 30 25 20")
 Donor’s nationality")
 30 25 20 15 10 5 0")


 30 25 20 15 10 5 0")


,")


 Dopamine 2")
- Slides: 29
CHAPTER 8 CADAVERIC ORGAN AND TISSUE DONATION Editors: Datin Dr Lela Yasmin Mansor Expert Panel Datin Dr Lela Yasmin Mansor (chairperson) Dr Hooi Lai Seong Dr Omar Sulaiman Dr Muhammed Anis Abdul Wahab Matron Jamaliah Kario Staff Nurse Santi A/P Krishanan
Table 8. 1: Number of Donations by Year, 1997 -2008 Year Number of donors Rate of procurement (per million population) 1997 5 1998 7 Number of procurement by year N=213 1999 2000 2001 2002 2003 4 13 24 30 25 0. 23 0. 32 0. 18 0. 55 1. 00 1. 22 1. 00 2004 16 2005 13 2006 25 2007 25 2008 26 0. 63 0. 50 0. 94 0. 92 0. 94 Figure 8. 1: Number of Donations by Year, 1997 -2008 Number of donors (n) 30 20 10 0 1997 1998 1999 2000 2001 2002 2003 2004 2005 2006 2007 2008 Year
Table 8. 2: Number of organs procured, 1997 -2008 Organs procured Cornea Heart Liver Kidney Heart valve Bone Skin Lung Number of procurement by year N=213 1997 4 1 0 8 0 0 1998 10 3 0 10 1 1 0 0 1999 6 2 2 6 2 0 0 0 2000 18 3 2 22 8 3 2 0 2001 32 4 1 38 10 2 2 0 2002 48 0 2 26 10 6 2 0 2003 40 2 1 16 10 4 0 0 2004 20 0 3 18 10 5 1 0 2005 22 1 3 8 6 2 0 1 2006 38 1 6 26 15 5 3 1 2007 32 3 5 28 8 5 0 2 2008 40 0 4 26 13 4 0 0 Table 8. 3: Potential Donor Referrals and Actual Donations by month, 2008 No. of donors Month Jan Feb Mar Apr May Jun Jul Aug Sep Oct Nov Dec TOTAL Potential Donor Referrals 10 10 14 9 6 17 11 9 8 5 3 9 112 Actual Donors Brain Death Organ Donors (BD) 1 1 3 0 2 0 0 1 1 13 Cardiac Death Tissue Donors (CD) 0 3 0 1 0 3 2 0 1 2 13 Total 1 4 3 1 1 6 2 2 1 0 2 3 26
Figure 8. 3: Potential Donor Referrals and Actual Donations by month, 2008
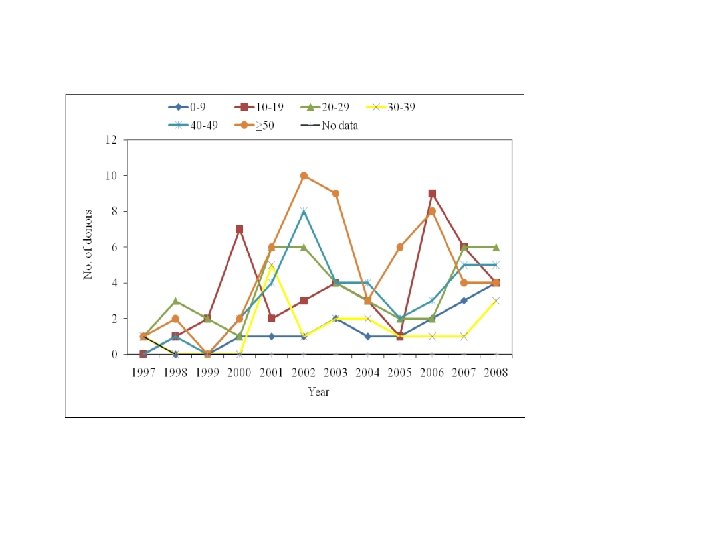
Table 8. 4: Distribution of Donors by Age, 1997 -2008 Donor’s age (years) <1 1 -9 10 -19 20 -29 30 -39 40 -49 50 -59 60 -69 70 -79 80 -89 No data 1997 N=5 0 1 (20) 0 0 0 1 (20) 1998 N=7 0 0 1 (14) 3 (43) 0 1 (14) 2 (29) 0 0 1999 N=4 0 0 2 (50) 0 0 0 0 2000 N=13 0 1 (8) 7 (54) 1 (8) 0 2 (15) 1 (8) 0 0 0 2001 N=24 0 1 (4) 2 (8) 6 (25) 5 (21) 4 (17) 2 (8) 0 0 0 2002 N=30 0 1 (3) 3 (10) 6 (20) 1 (3) 8 (27) 7 (23) 1 (3) 3 (10) 0 0 No. (%) 2003 N=25 1 (4) 4 (16) 2 (8) 4 (16) 3 (12) 0 0 2004 N=16 0 1 (6) 3 (19) 2 (13) 4 (25) 3 (19) 0 0 2005 N=13 0 1 (8) 2 (15) 1 (8) 3 (23) 1 (8) 0 2006 N=25 0 2 (8) 9 (36) 2 (8) 1 (4) 3 (12) 2 (8) 4 (16) 2 (8) 0 0 2007 N=25 0 3 (12) 6 (24) 1 (4) 5 (20) 2 (8) 0 0 0 2008 N=26 0 4 (15) 6 (23) 3 (12) 5 (19) 2 (8) 1 (4) 0 0 Total N=213 1 (0) 16 (8) 42 (20) 17 (8) 38 (18) 28 (13) 17 (8) 10 (5) 1 (0) Total Mean SD Median Minimum Maximum 5 27. 25 21. 06 28. 00 2 51 7 34. 43 17. 12 25. 00 16 57 4 20. 50 4. 43 21. 00 15 25 13 25. 23 18. 71 17. 00 5 60 24 36. 83 15. 71 37. 00 8 66 30 41. 87 18. 92 46. 00 4 79 25 39. 36 22. 26 40. 00 <1* 77 16 32. 50 15. 57 31. 50 8 55 13 46. 38 24. 78 48. 00 3 81*** 25 35. 72 23. 45 23. 00 3 77 25 29. 60 18. 75 23. 00 1** 68 26 30. 75 19. 06 27. 00 2 71 213 35. 09 19. 99 33. 00 <1* 81*** * The youngest tissue donor was 37 -days-old donated heart valves in 2003 ** The youngest organ donor was 14. 5 -month old donated kidneys 2007. *** The oldest tissue donor was 81 -years-old donated eyes in 2005; the oldest organ donor was 65 -years-old donated kidneys in 2001.
Figure 8. 4: Distribution of Donors by Age, 1997 -2008 Age 0 -<10 years Age 10 -<20 years Age 20 -<30 years Age 30 -<40 years Age 40 -<50 years Age ≥ 50 years 35 Number of donors (n) 30 25 20 15 10 5 0 1997 1998 1999 2000 2001 2002 2003 Year 2004 2005 2006 2007 2008
Donor's Age Group (year) in 2008 Number of donors (n) 6 4 2 0 0 -<10 10 -<20 20 -<30 30 -<40 Donor's Age Group (Years) 40 -<50 ≥ 50
Table 8. 5: Distribution of Donors by Gender, 1997 -2008 Donor’s gender Male Female 1997 N=5 3 (60) 2 (40) 1998 N=7 7 (100) 0 (0) 1999 N=4 3 (75) 1 (25) 2000 N=13 11 (85) 2 (15) 2001 N=24 20 (83) 4 (17) 2002 N=30 27 (90) 3 (10) No. (%) 2003 N=25 21 (84) 4 (16) Figure 8. 5: Distribution of Donors by Gender, 1997 -2008 2004 N=16 12 (75) 4 (25) 2005 N=13 8 (62) 5 (38) 2006 N=25 19 (76) 6 (24) 2007 N=25 20 (80) 5 (20) 2008 N=26 18 (69) 8 (31) Total N=213 169 (79) 44 (21)
Male Female 35 Number of donors (n) 30 25 20 15 10 5 0 1997 1998 1999 2000 2001 2002 2003 2004 2005 2006 2007 2008 Year
Table 8. 6: Distribution of Donors by Ethnic Group, 1997 -2008 Donor’s ethnic group Malay Chinese Indian Others 1997 N=5 1 (20) 3 (60) 1 (20) 0 (0) 1998 N=7 0 (0) 4 (57) 3 (43) 0 (0) 1999 N=4 0 (0) 4 (100) 0 (0) No. (%) 2000 N=13 2 (15) 7 (54) 3 (23) 1 (8) 2001 N=24 1 (4) 17 (71) 4 (17) 2 (8) 2002 N=30 0 (0) 13 (43) 15 (50) 2 (7) 2003 N=25 0 (0) 14 (56) 9 (36) 2 (8) No. (%) 2004 N=16 1 (6) 14 (88) 1 (6) 0 (0) 2005 N=13 1 (8) 5 (38) 7 (54) 0 (0) 2006 N=25 1 (4) 12 (48) 11 (44) 1 (4) 2007 N=25 5 (20) 14 (56) 3 (12) Figure 8. 6: Distribution of Donors by Ethnic Group, 1997 -2008 208 N=28 0 (0) 17 (65) 6 (23) 3 (12) Total N=213 12 (6) 124 (58) 63 (30) 14 (7)
Malay Chinese Indian Others 35 Number of donors (n) 30 25 20 15 10 5 0 1997 1998 1999 2000 2001 2002 2003 2004 2005 2006 2007 2008 Year
Table 8. 7: Distribution of Donors by Religion, 1997 -2008 Donor’s religion Islam Buddhism Hinduism Christianity Others Unknown 1997 N=5 1 (20) 3 (60) 1 (20) 0 (0) 1998 N=7 0 (0) 3 (43) 0 (0) 1 (14) 1999 N=4 0 (0) 0 (0) 4 (100) No. (%) 2000 N=13 2 (15) 0 (0) 3 (23) 1 (8) 0 (0) 7 (54) 2001 N=24 1 (4) 3 (13) 0 (0) 19 (79) 2002 N=30 0 (0) 5 (17) 13 (43) 1 (3) 0 (0) 11 (37) 2003 N=25 1 (4) 15 (60) 8 (32) 1 (4) 0 (0) No. (%) 2004 N=16 2 (13) 14 (88) 0 (0) 2005 N=13 1 (8) 5 (38) 0 (0) 2 (15) 0 (0) 2006 N=25 2 (8) 12 (48) 10 (40) 0 (0) 1 (4) 2007 N=25 5 (20) 13 (52) 2 (8) 4 (16) 1 (4) 0 (0) Figure 8. 7: Distribution of Donors by Religion, 1997 -2008 N=26 0 (0) 16 (62) 6 (23) 3 (12) 0 (0) 1 (4) Total N=213 15 (7) 87 (41) 54 (25) 10 (5) 3 (1) 44 (21)
Islam Buddhism Hinduism Christianity Others Unknown 35 Number of donors (n) 30 25 20 15 10 5 0 1997 1998 1999 2000 2001 2002 2003 Year 2004 2005 2006 2007 2008
Table 8. 8: Distribution of Donors by Nationality, 1997 -2008 No. (%) Donor’s nationality Malaysian Non-Malaysian 1997 N=5 1998 N=7 1999 N=4 2000 N=13 2001 N=24 2002 N=30 2003 N=25 2004 N=16 2005 N=13 2006 N=25 2007 N=25 2008 N=26 Total N=213 5 (100) 7 (100) 4 (100) 13 (100) 21 (88) 29 (97) 24 (96) 16 (100) 13 (100) 24 (96) 24 (92) 204 (96) 0 (0) 3 (13) 1 (4) 0 (0) 1 (4) 2 (8) 9 (4) Figure 8. 8: Distribution of Donors by Nationality, 1997 -2008
Malaysian Non-Malaysian 35 Number of donors (n) 30 25 20 15 10 5 0 1997 1998 1999 2000 2001 2002 2003 2004 2005 2006 2007 2008
Table 8. 9: Distribution of Donors by State, 1997 -2008 Donor’s state of residence* Johor Malacca Negeri Sembilan Selangor WP Kuala Lumpur WP Putrajaya Perak Kedah Perlis Pulau Pinang Pahang Terengganu Kelantan Sabah Sarawak Others** Unknown 1997 N=5 0 0 0 2 (40) 1 (20) 0 0 0 0 0 1 (20) 1998 N=7 0 1 (14) 0 2 (29) 0 0 0 1 (14) 0 0 0 No. (%) 2000 N=13 3 (23) 0 1 (8) 0 0 0 3 (23) 2 (15) 0 1 (8) 0 0 1 (8) 2 (15) 0 0 0 1999 N=4 0 1 (25) 0 0 2 (50) 0 1 (25) 0 0 0 0 0 2001 N=24 0 0 0 3 (13) 1 (4) 0 0 10 (42) 2002 N=30 2 (7) 1 (3) 9 (30) 5 (17) 1 (3) 4 (13) 1 (3) 0 1 (3) 2 (7) 0 0 0 3 (10) 2003 N=25 3 (12) 2 (8) 4 (16) 6 (24) 2 (8) 0 0 3 (12) 2 (8) 0 0 1 (4) No. (%) Donor’s state of residence* Johor Malacca Negeri Sembilan Selangor WP Kuala Lumpur WP Putrajaya Perak Kedah Perlis Pulau Pinang Pahang Terengganu Kelantan Sabah Sarawak Others** Unknown 2004 N=16 1 (6) 0 0 6 (38) 3 (19) 0 2 (13) 1 (6) 0 2 (13) 0 0 0 1 (6) 0 0 0 2005 N=13 1 (8) 7 (54) 2 (15) 0 1 (8) 0 0 0 0 0 2006 N=25 1 (4) 2 (8) 6 (24) 0 4 (16) 1 (4) 0 2007 N=25 5 (20) 1 (4) 6 (24) 3 (12) 0 2 (8) 1 (4) 0 0 0 1 (4) 0 2008 N=26 3 (12) 0 2 (8) 3 (12) 8 (31) 0 3 (12) 1 (4) 0 2 (8) 0 0 0 Total N=213 19 (9) 9 (4) 13 (6) 45 (21) 33 (15) 1 (0) 23 (11) 11 (5) 0 18 (8) 12 (6) 2 (1) 7 (3) 0 3 (1) 15 (7)
Table 8. 10: Donor’s Pledged Status, 1997 -2008 Donor’s pledged status Pledged donors Nonpledged donors 1997 N=5 0 (0) 1998 N=7 0 (0) 1999 N=4 0 (0) 2000 N=13 0 (0) 2001 N=24 0 (0) 2002 N=30 5 (17) 5 (100) 7 (100) 4 (100) 13 (100) 24 (100) 25 (83) Figure 8. 10: Donor’s Pledged Status, 1997 -2008 No. (%) 2004 2003 N=16 N=25 6 2 (24) (13) 19 (76) 14 (88) 2005 N=13 3 (23) 2006 N=25 1 (4) 2007 N=25 6 (24) 2008 N=26 2 (8) Total N=213 25 (12) 10 (77) 24 (96) 19 (76) 24 (92) 188 (88)
Pledged Non-Pledged 35 Number of donors (n) 30 25 20 15 10 5 0 1997 1998 1999 2000 2001 2002 2003 2004 2005 2006 2007 2008
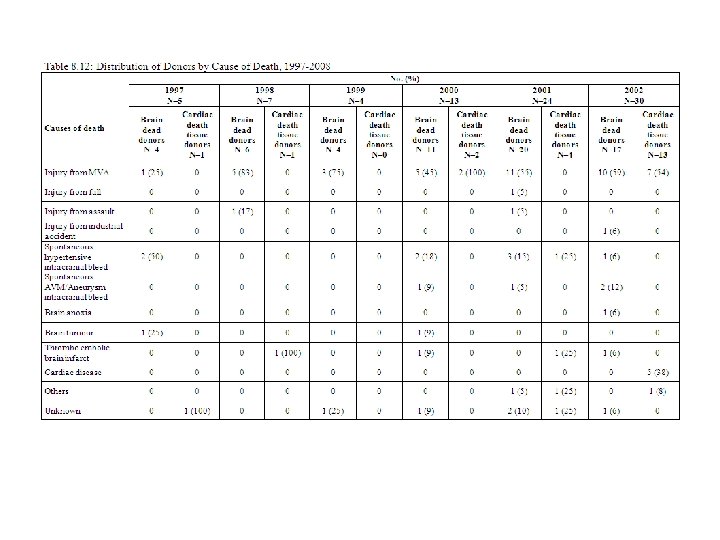
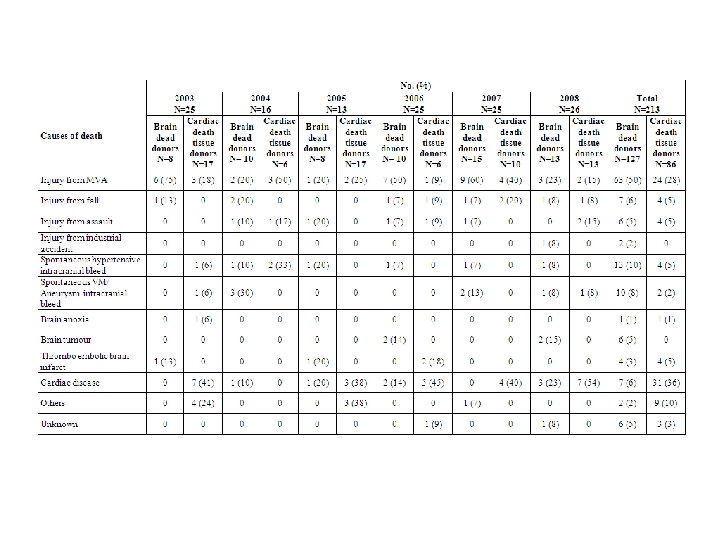
Table 8. 11: Distribution of Donors by Type, 1997 -2008 Type of donors 1997 N=5 BD (Brain 4 (80) Death donor) CD (tissue donors after 1 (20) Cardiac Death)* No. (%) 2003 2004 N=25 N=16 2005 N=13 8 (32) 10 (63) 5 (38) 13 (43) 17 (68) 6 (38) 8 (62) 1998 N=7 1999 N=4 2000 N=13 2001 N=24 2002 N=30 6 (86) 4 (100) 11 (85) 20 (83) 17 (57) 1 (14) 0 (0) 2 (15) 4 (17) Figure 8. 11: Distribution of Donors by Type, 1997 -2008 BD CD 35 Number of donors (n) 30 25 20 15 10 5 0 1997 1998 1999 2000 2001 2002 2003 2004 2005 2006 2007 2008 2006 N=25 2007 N=25 2008 N=26 Total N=213 14 (56) 15 (60) 13 (50) 127 (60) 11 (44) 10 (40) 13 (50) 86 (40)
Table 8. 13: Distribution of Organ Donors by Blood Group, 1997 -2008 Blood group A positive B positive AB positive O positive A negative 1997 N=4 1 (25) 0 (0) 1 (25) 2 (50) 0 (0) 1998 N=6 2 (33) 1 (17) 2 (33) 0 (0) No. (%) 2000 N=11 1 (9) 5 (45) 0 (0) 1999 N=4 0 (0) 1 (25) 0 (0) 3 (75) 0 (0) 2001 N=20 5 (25) 4 (20) 1 (5) 10 (50) 0 (0) 2002 N=15 4 (27) 0 (0) 7 (47) 0 (0) 2003 N=7 4 (57) 2 (29) 0 (0) 1 (14) 0 (0) No. (%) Blood group 2004 N=10 2005 N=5 2006 N=14 2007 N=15 2008 N=13 Total N=124 A positive B positive AB positive O positive A negative 2 (20) 4 (40) 0 (0) 1 (20) 2 (40) 0 (0) 4 (29) 5 (36) 2 (14) 3 (21) 0 (0) 6 (40) 3 (20) 0 (0) 5 (33) 1 (7) 4 (31) 2 (15) 0 (0) 6 (46) 1 (8) 34 (27) 33 (27) 5 (4) 50 (40) 2 (2)
Figure 8. 13 a: Distribution of Organ Donors by Blood Group, 1997 -2008 A+ B+ O+ A- AB+ 20 Number of donors (n) 18 16 14 12 10 8 6 4 2 0 1997 1998 1999 2000 2001 2002 2003 2004 2005 2006 2007 2008
Figure 8. 13 b: Distribution of Organ Donor by Blood Group Type (pie chart), 1997 -2008 Figure 8. 13 c: Distribution of Organ Donor by Blood Group Type (pie chart), 2008
Table 8. 14 a: Distribution of Donors by Institution of Origin, 1997 -2008 Donors’ Institution of Origin MOH state/general hospitals MOH district hospitals University hospitals Private hospitals Home 1997 N=5 2 (40) 0 (0) 1 (20) 1998 N=7 5 (71) 0 (0) 1 (14) 0 (0) 2004 N=16 12 (75) 2 (13) 1 (6) 0 (0) 2005 N=13 8 (62) 0 (0) 1 (8) 4 (31) 0 (0) 1999 N=4 1 (25) 0 (0) 3 (75) 0 (0) No. (%) 2000 N=13 10 (77) 2 (15) 0 (0) 1 (8) 0 (0) 2001 N=24 16 (67) 0 (0) 6 (25) 2 (8) 0 (0) No. (%) 2006 2007 N=25 20 (80) 18 (72) 0 (0) 3 (12) 2 (8) 0 (0) 2002 N=30 19 (63) 3 (10) 4 (13) 1 (3) 2008 N=26 15 (58) 0 (0) 3 (12) 6 (23) 2 (8) Figure 8. 14 a: Distribution of Donors by Institution of Origin, 1997 -2008 MOH state/G. Hospitals University hospitals Home (eye donors only) MOH district hospitals Private hospitals Number of donors (n) 35 30 25 20 15 10 5 0 1997 1998 1999 2000 2001 2002 2003 2004 2005 2006 2007 2008 2003 N=25 15 (60) 4 (16) 3 (12) 0 (0) Total N=213 141 (66) 14 (7) 24 (11) 30 (14) 4 (2)
Table 8. 14 b: Distribution of Donors by Referral Site, 1997 -2008 Donor Referral Site ICU Ward Emergency department Mortuary Home Data not available 1997 N=5 1 (20) 0 (0) 4 (80) 2004 N=16 12 (75) 1 (6) 0 (0) 3 (19) 0 (0) 1998 N=7 0 (0) 0 (0) 7 (100) 2005 N=13 8 (62) 3 (23) 0 (0) 1 (8) 1999 N=4 0 (0) 0 (0) 4 (100) No. (%) 2000 N=13 1 (8) 0 (0) 12 (92) 2001 N=24 14 (58) 0 (0) 3 (13) 0 (0) 7 (29) No. (%) 2006 2007 N=25 16 (64) 17 (68) 3 (12) 1 (4) 3 (12) 5 (20) 0 (0) 1 (4) 2002 N=30 16 (53) 1 (3) 4 (13) 3 (10) 1 (3) 5 (17) 2008 N=26 17 (65) 3 (12) 1 (4) 4 (15) 1 (4) 0 (0) Figure 8. 14 b: Distribution of Donors by Referral Site, 1997 -2008 Number of donors (n) ICU Mortuary Ward Home Emergency department Not available 35 30 25 20 15 10 5 0 1997 1998 1999 2000 2001 2002 2003 2004 2005 2006 2007 2008 2003 N=25 13 (52) 3 (12) 1 (4) 6 (24) 0 (0) 2 (8) Total N=213 115 (54) 15 (7) 13 (6) 25 (12) 2 (1) 43 (20)
Table 8. 14 c: Distribution of Donors by Procurement Site, 1997 -2008 Donor Procurement Site Operation theatre Mortuary Ward Home Data not available 1997 N=5 4 (80) 0 (0) 1 (20) 0 (0) 2004 N=16 9 (56) 7 (44) 0 (0) 1998 N=7 6 (86) 1 (14) 0 (0) 2005 N=13 5 (38) 2 (15) 0 (0) 1 (8) 1999 N=4 4 (100) 0 (0) No. (%) 2000 N=13 11 (85) 2 (15) 0 (0) 2001 N=24 20 (83) 3 (13) 1 (4) 0 (0) No. (%) 2006 2007 N=25 14 (56) 16 (64) 10 (40) 7 (28) 1 (4) 2 (8) 0 (0) 2002 N=30 14 (47) 1 (3) 0 (0) 2008 N=26 13 (50) 12 (46) 0 (0) 1 (4) 0 (0) Figure 8. 14 c: Distribution of Donors by Procurement Site, 1997 -2008 Operation theater Home Mortuary Not available Ward Number of donors (n) 35 30 25 20 15 10 5 0 1997 1998 1999 2000 2001 2002 2003 2004 2005 2006 2007 2008 2003 N=25 8 (32) 14 (56) 3 (12) 0 (0) Total N=213 124 (58) 75 (35) 10 (5) 3 (1) 1 (0)
Table 8. 15: Distribution of Donors by Inotrope, 2008 Inotrope No. (%) Dopamine 2 (15) Dopamine/Noradrenaline 6 (46) Dopamine/Adrenaline 2 (15) Dopamine/Dobutamine/Adrenaline 1 (8) Dopamine/Dobutamine/Adrenaline/Noradrenaline 1 (8) Missing 1 (8) Total 13 (100)