Chapter 8 An Introduction to Optical Atomic Spectrometry


 Energy level diagrams for Na and Mg+")
 Energy level diagram for")


 Processes leading to atoms, molecules and ions with continuous")
 A glow-discharge")
- Slides: 14
Chapter 8 An Introduction to Optical Atomic Spectrometry 1 Atomic Spectra
1. 1 Energy level diagrams Every element has an unique set of atomic orbitals p, d, f. . split by spin-orbit coupling Spin (s) and orbital (l) motion create magnetic fields that perturb each other (couple) if fields parallel – higher energy if fields antiparallel – lower energy. Define spin-orbit coupling by J (total angular momentum) J = L + S (L= l S= s ) (positive values only) Examples: s electron ( l = 0, s = +1/2 or -1/2) J = 0+ ½ = ½ p electron ( l = 1, s = +1/2 or -1/2) J = 1+1/2 = 3/2 (higher energy ) or J = 1 -1/2 = 1/2 (lower energy ) Electronic term symbol 2 S+1 L L written as letter (S, P, D ) instead of number J Na = 1 s 22 p 63 s 1, L = 0, S= 1/2, 2 S 1/2 Na* = 1 s 22 s 12 p 63 p 1, L = 1, S= 1/2, 2 P 3/2, 1/2
Fig. 8 -1 (p. 216) Energy level diagrams for Na and Mg+
Fig. 8 -1 a and 8 -2 (p. 216 -217) Energy level diagram for Mg+, and atomic magnesium
l Similar pattern between atoms but different spacing l Spectrum of an ion different to that of the corresponding atom l Energy levels measured in electron volts (e. V) 1 e. V = 1. 602 x 10 -19 Cx 1 V(J/C) = 1. 602 x 10 -19 J = 96. 484 k. J. mol-1 l As # of electron increases, # of levels increases, emission spectra become more complex
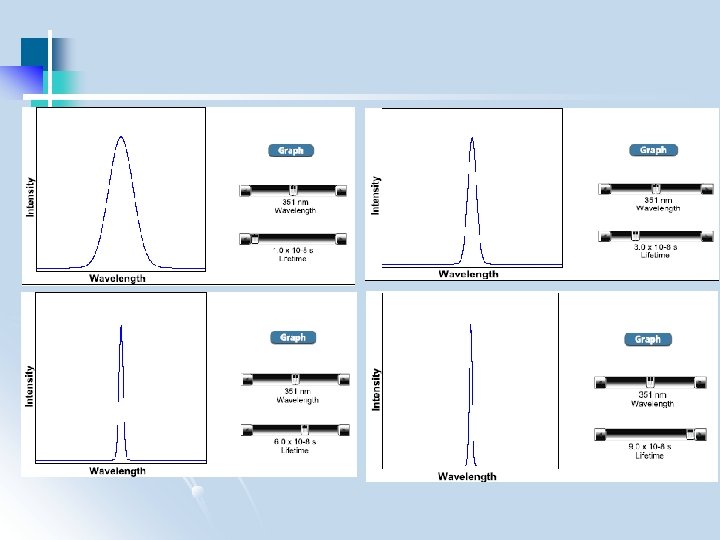
1. 2 Atomic line widths 1. 2. 1 Line broadening from the uncertainty principle Uncertainty principle: must measure for some minimum time to tell two frequencies apart t E h t 1 t: minimum time for measurement : minimum detectable difference in frequencies Shows up in lifetime of excited state - if lifetime infinitely long, E infinitely narrow - if lifetime short, E is broadened = c/ Differentiating wrt to d =-c 2 d , d and d = 2/c natural line widths
1. 2. 2 Doppler broadening Change in frequency produced by motion relative to detector In gas, broadens line symmetrically because of Maxwell-Boltzman velocity distribution Average velocity of atoms increases as (T)1/2 At room T, line widths 10 -2 -10 -3 A Total line width typically 1 -10 A
1. 2. 3 Pressure broadening Collisions with other atoms transfer small quantities of energy (heat) – ill-defined ground state energy Effects worse at high pressures - for low pressure hollow cathode lamp (1 -10 torr) 10 -1 -10 -2 A - for high pressure Xeon lamps (>10, 000 torr) 100 -1000 A (continuum radiation!)
1. 3 Other effects of temperature Temperature changes # of atoms in ground and excited states changes Emission measurements rely on number of excited atoms, requiring close control of temperature (e. g. , at 2500 K Na only has 0. 02% atoms in first excited state, a rise of 10 K in temperature results in 4% increase of excited atoms) Less important in absorption measurement, 99. 8% atoms in ground state!
2 Atomization Methods Sample must be converted to gaseous atoms or ions first
2. 1 Introduction of solution samples Must transfer sample to atomizer Fig. 8 -11 (p. 226) Pneumatic nebulizers
Fig. 8 -10 (p. 225) Processes leading to atoms, molecules and ions with continuous sample introduction into a flame.
2. 2 Introduction of solid sample sputtering Fig. 8 -12 (p. 227) A glow-discharge atomizer