Chapter 8 AIR PRESSURE AND WINDS Atmospheric Pressure


 to the")


- Slides: 23
Chapter 8 AIR PRESSURE AND WINDS
Atmospheric Pressure What causes air pressure to change in the horizontal? Why does the air pressure change at the surface?
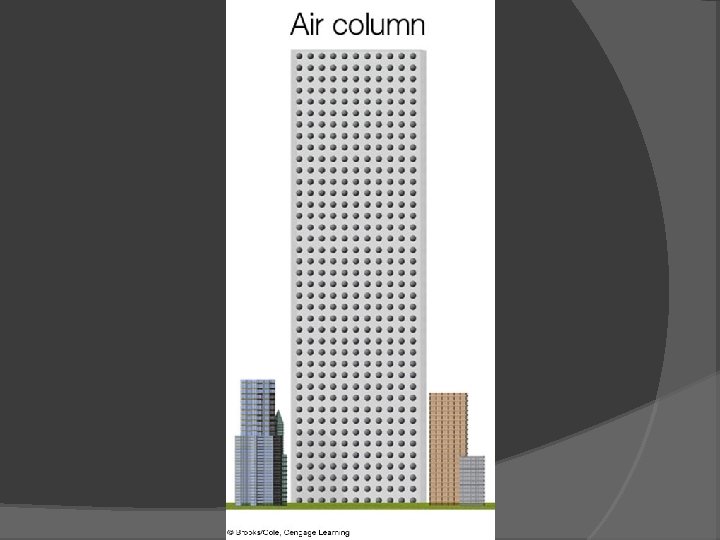
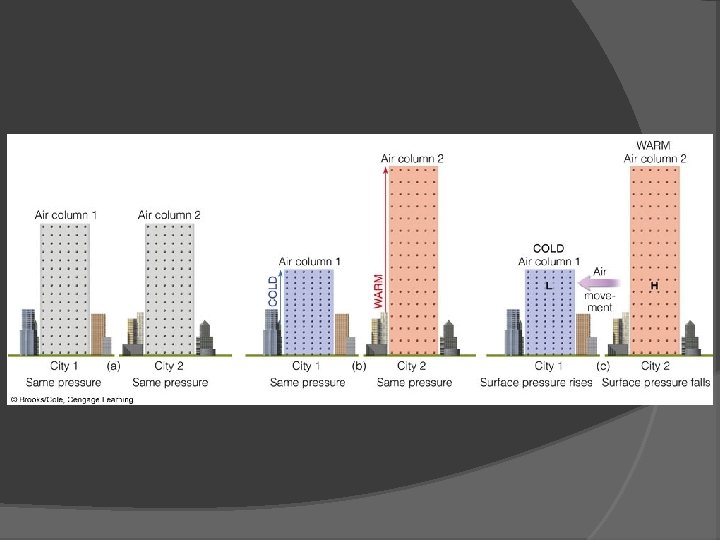
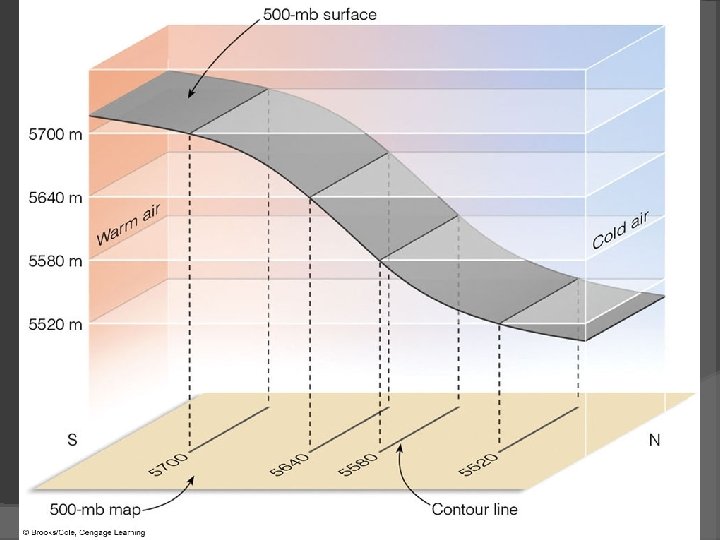
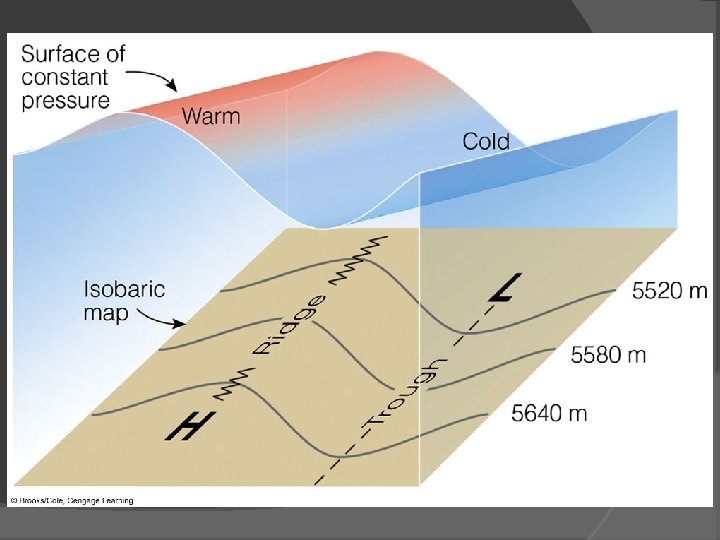
Atmospheric Pressure Horizontal Pressure Variations It takes a shorter column of dense, cold air to exert the same pressure as a taller column of less dense, warm air A Warm air column is normally associated with a low surface pressure A Cold air column is normally associated with a High surface pressure At surface, horizontal difference in temperature = horizontal pressure in pressure = wind
Atmospheric Pressure Special Topic: Gas Law P is proportional to T x ρ P = pressure T = temperature ρ = density http: //www. youtube. com/watch? v=17 w. GId. Mv. Jf. M (youtube video of gas law)
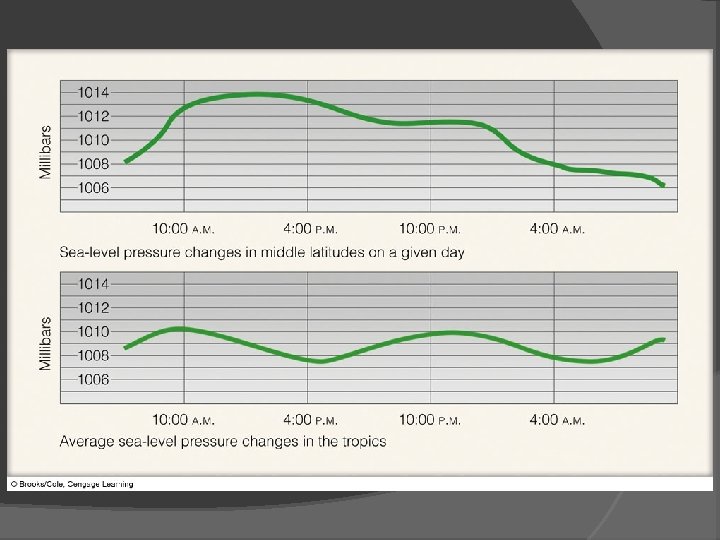
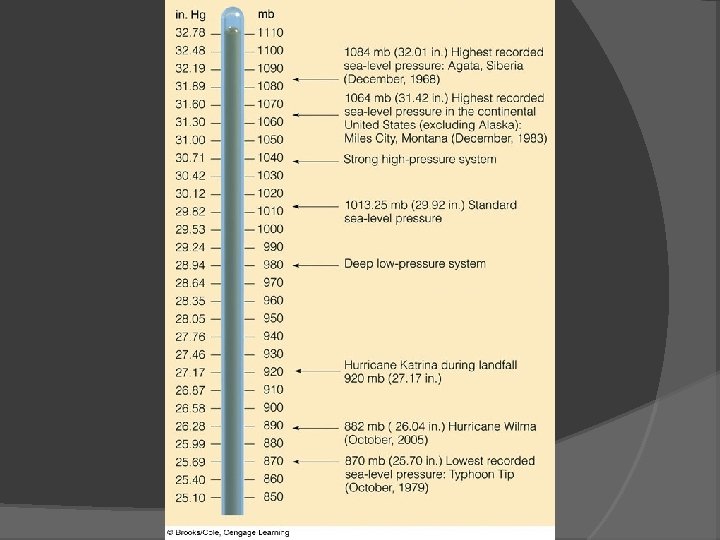
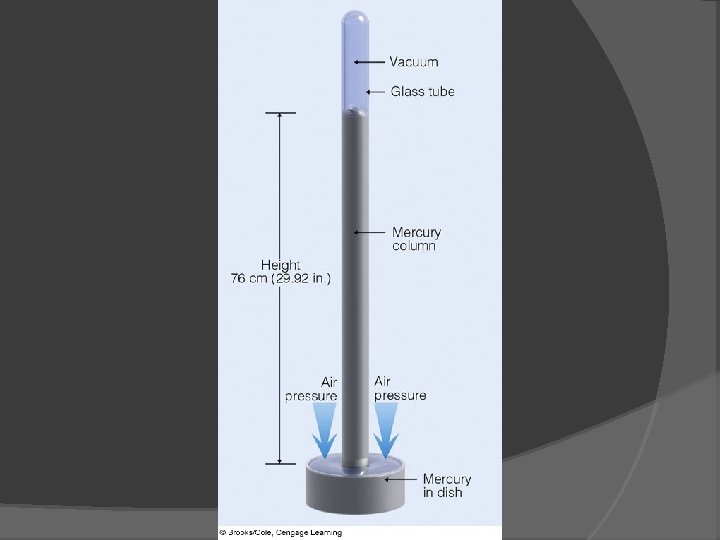
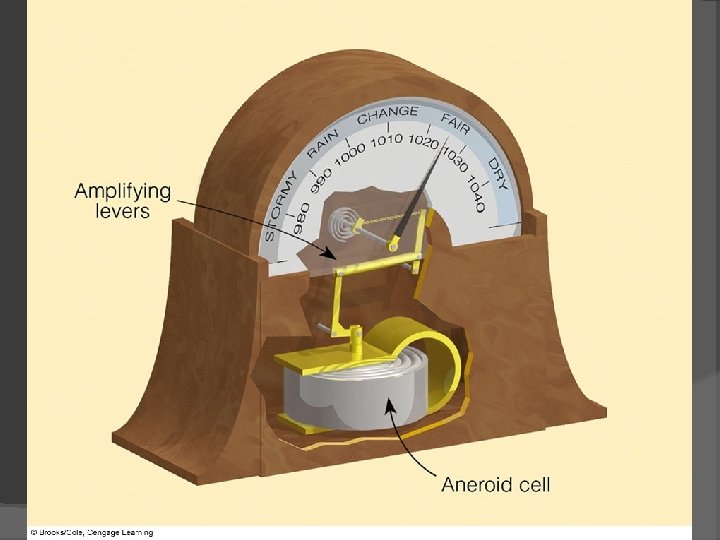
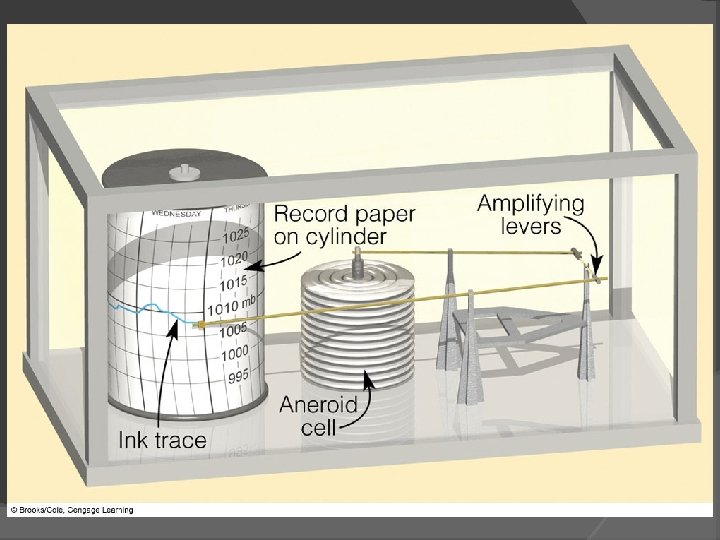
Atmospheric Pressure Daily Pressure Variations Thermal tides in the tropics Mid-latitude pressure variation driven by transitory pressure cells Pressure Measurements Barometer, barometric pressure ○ Standard atmospheric pressure 1013. 25 mb Aneroid barometers ○ Altimeter, barograph
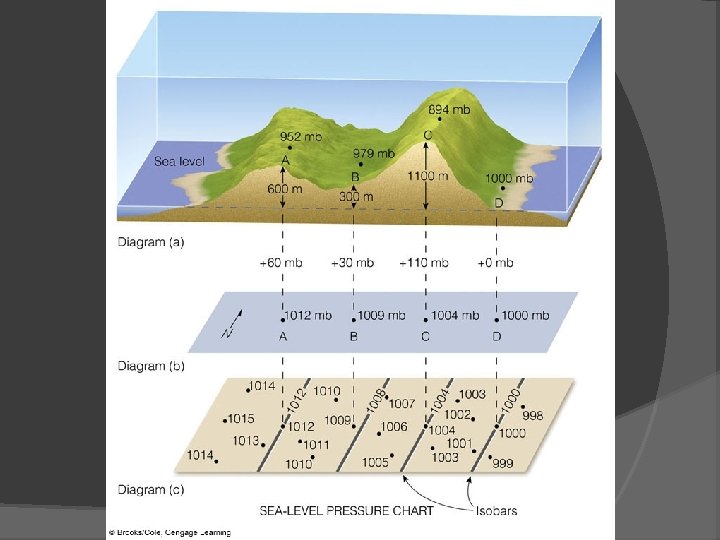
Atmospheric Pressure Readings Instrument error: temperature, surface tension Altitude corrections: high altitude add pressure, 10 mb/100 m above sea level
To get sea level pressure Add 10 mb * (elevation/ 100 m) to the station pressure measurement. Example: A station at 700 meters elevation records a pressure of 940 mb. The sea level pressure for this station would be 940 mb + 70 mb = 1010 mb
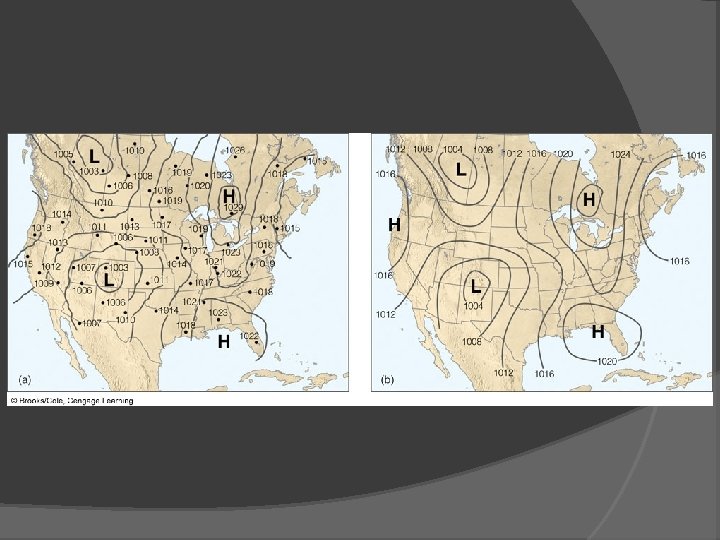
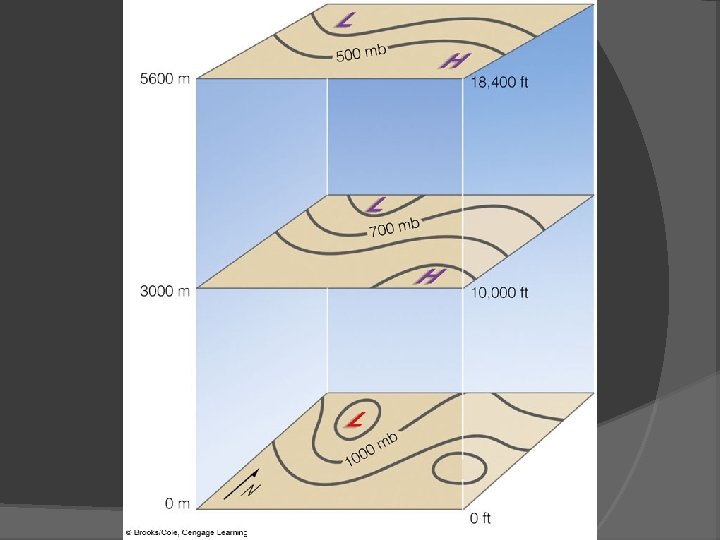
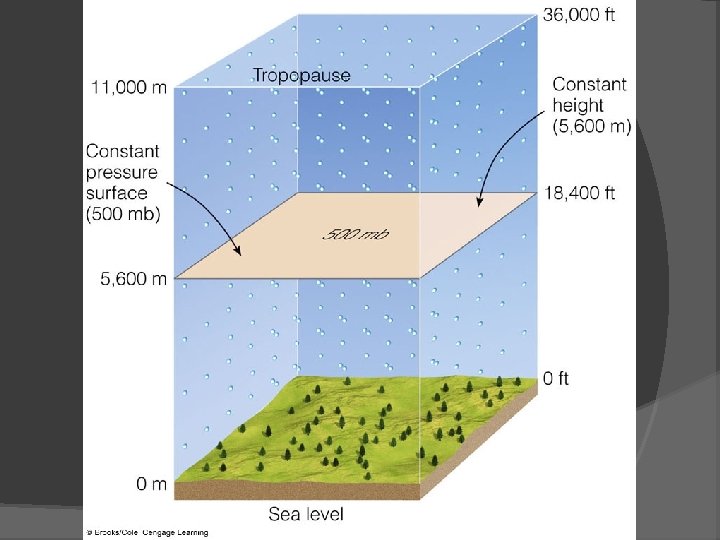
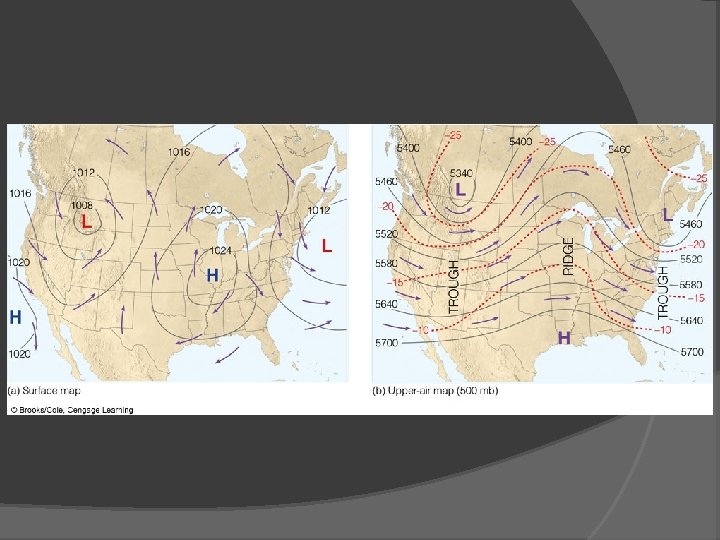
Surface and Upper Level Charts Sea-level pressure chart: constant height Upper level or isobaric chart: constant pressure surface (i. e. 500 mb) High heights correspond to higher than normal pressures at a given latitude and vice versa