Chapter 7 The Human Population How the information


= the number of births per")


visual representations of age structure within")


- the value of")

- Slides: 28
Chapter 7 The Human Population
How the information provided in the video can affect resource use, policy decisions and the like? www. miniature-earth. com/
Scientists Disagree on Earth’s Carrying Capacity • Every 5 days the human population increases roughly by a million lives: 1. 8 million infants are born and 800, 000 people die. • The population has not always grown at this rate. Figure 7. 1
Scientists Disagree on Earth’s Carrying Capacity • The following graphs show theoretical models of food supply and population size.
Checkpoint 1. What determines the carrying capactiy of a habitat? 2. How might humans differ from other organisms in terms of carrying capacity 3. Will humans exceed Earth’s carrying capacity? What evidence can you use to justify your argument?
Factors that Drive Human Population Growth • Demography- the study of human populations and population trends. • • • Changes in Population Size Fertility Life Expectancy Age Structure Migration
Changes in Population Size • Immigration- the movement of people into a country • Emigration- the movement of people out of a country. • Net migration rate- the difference between immigration and emigration in a give year per 1, 000 people in the country.
Changes in Population Size • Crude birth rate (CBR)= the number of births per 1, 000 individuals per year. • Crude death rate (CDR)= the number of deaths per 1, 000 individuals per year. • Global population growth rate = (CBR- CDR)/ 10 • National population growth rate = • (CBR+ immigration) - (CDR + emigration)/ 10 • Doubling time (in years)- 70/growth rate
Fertility • Total fertility rate- an estimate of the average number of children that each woman in a population will bear. • Replacement level fertility- the total fertility rate required to offset the average number of deaths in a population and for the current population size to remain stable.
Fertility • • Developed countries- countries with relatively high levels of industrialization and income. Developing countries- countries with relatively low levels of industrialization and income of less that $3 person per day.
Life Expectancy • Life expectancy- the average number of years that an infant born in a particular year in a particular country can be expected to live, given the current average life span and death rate of that country.
Life Expectancy • • Infant mortality rate- the number of deaths of children under 1 year of age per 1, 000 live births. Child mortality rate- the number of deaths of children under age 5 per 1, 000 live births.
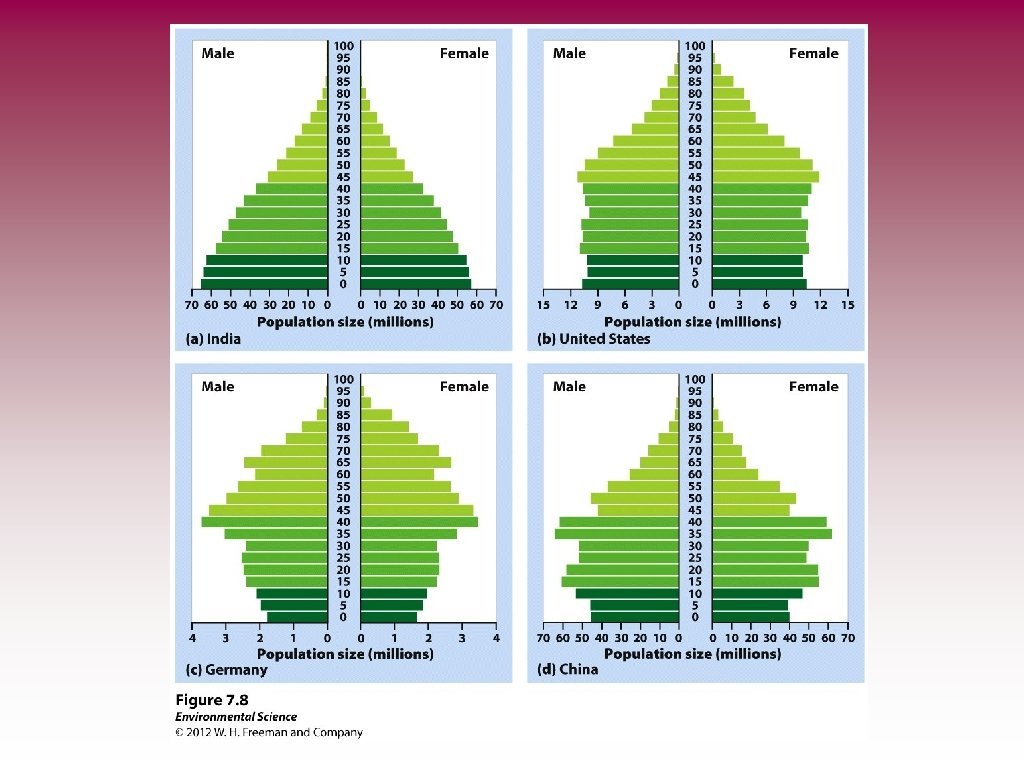
Age Structure • • Age structure diagrams (population pyramids)visual representations of age structure within a country for males and females. As shown in figure 7. 8
Checkpoint 1. What are the main factors that influence human population growth? 2. How does age structure influence the population growth rate? 3. How do a country’s total fertility rate and net migration rate determine population growth?
The Demographic Transition • The theory of the demographic transition is theory that as a country moves from a subsistence economy to industrialization and increased affluence, it undergoes a predictable shift in population growth.
The Stages of the Demographic Transition • • Phase 1: Slow population growth because there are high birth rates and high death rates which offset each other. Phase 2: Rapid population growth because birth rates remain high but death rates decline due to better sanitation, clean drinking water, increased access to food and goods, and access to health care. Phase 3: Stable population growth as the economy and educational system improves and people have fewer children. Phase 4: Declining population growth because the relatively high level of affluence and economic develop encourage women to delay having children.
Family Planning • Family planning- the regulation of the number or spacing of offspring through the use of birth control.
CHECKPOINT 1. What is theory of demographic transition? 2. How do education and demographic transitions relate to one another? 3. In what ways are phase 1 and phase 3 in a demographic transition similar?
The 12 Most Populous Countries in the World
The relationship between economic development and population growth rate for developing nations.
Ecological Footprints • Affluence - having a lot of wealth such as money, goods, or property.
The IPAT Equation • To estimate the impact of human lifestyles on Earth we can use the IPAT equation: • Impact= Population X Affluence X Technology
CHECKPOINT Read Pg. 191 -196 1. What is the IPAT equation? What does it describe? 2. How do local and global environmental impacts differ? Where do we tend to see one versus the other? 3. How does a country’s degree of development influence its environmental impact?
The Impact of Affluence • • • Gross domestic product (GDP)- the value of all products and services produced in a year in that country. GDP is made up of consumer spending, investments, government spending, and exports minus imports. A countries GDP often correlates with its pollution levels.
CHECKPOINT Read Pgs. 196 -197 1. What is the difference between economic development and sustainable development? 2. How is the Millennium Ecosystem Assessment project a blueprint for sustainable development? 3. What factors have we discussed that make sustainable development difficult to achieve?