chapter 7 Descriptive Statistics Frequency Contingency Tables Instructor

chapter 7 Descriptive Statistics Frequency & Contingency Tables Instructor: Huang, Jia-Ping

Contents Descriptive statistics p Tables p
 function")
Descriptive statistics p The summary() function
 does not provide enough information to understand a sample of")
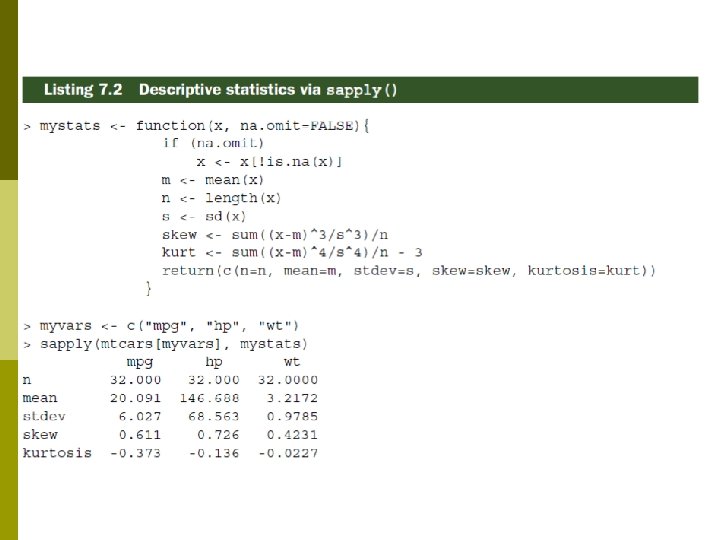
Descriptive statistics The summary() does not provide enough information to understand a sample of data. p Use a combination of sapply() and functions like mean(), sd(), var(), min(), max(), median(), length(), range(), quantile(), etc. , to produce the statistics you need. p
 p apply() applies a function over the margins of an array p sapply()")
sapply() p apply() applies a function over the margins of an array p sapply() applies a function over a list or vector. p
, y = rnorm(20, 3, 2))")
> mydata <- data. frame(x = rnorm(20, 2, 1), y = rnorm(20, 3, 2)) > apply(mydata, 2, sd) x y 0. 9729847 1. 6987539 > sapply(mydata, sd) x y 0. 9729847 1. 6987539
 in the Hmics package p stat. desc() in the")
Other useful functions p describe() in the Hmics package p stat. desc() in the pastecs package p describe() in the psych package
 function We can divide our data set into groups and produce descriptive")
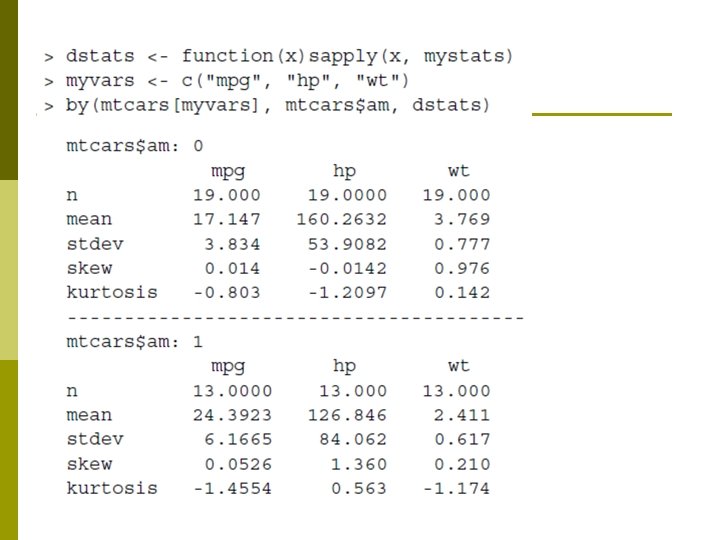
The aggregate() function We can divide our data set into groups and produce descriptive statistics for each group. p This can be done by using the aggregate() function. p
 function p aggregate() only allows you to use singlevalue functions such as")
The by() function p aggregate() only allows you to use singlevalue functions such as mean(). p With by(), you can return several statistics at once.

Tables p R provides several methods for creating frequency and contingency tables.
 p prop. table()")
One-way tables p table() p prop. table()

Two-way tables
")
Take row/column sums The index 1 refers to the first variable in the table() statement.

Proportions of the overall sum

Add marginal sums

Summary Descriptive statistics is the first step of statistical analysis. p Creating frequency/contingency tables is a useful way of data visualization. p Important functions: summary(), sapply(), aggregate(), by(), table(), prop. table() p
- Slides: 18