Chapter 6 Structures and energetics of metallic and


 ABA and (b) ABC close-packed arrangements, the")


")


 semiconductors The semiconducting properties of Si and Ge can be")


 structure type In salts of")
 structure type Fig. 6. 16 (a) The unit cell")
 structure type In salts of formula MX 2, the")
 structure type: a diamond-type network Fig. 6. 18 (b)")
 A typical representation of the diamond structure. (b) Reorientation of")
 structure type Fig. 6. 20 Three unit cells of wurtzite")

 structure type: a double oxide Fig. 6. 23")


- Slides: 59
Chapter 6 Structures and energetics of metallic and ionic solids TOPICS § Packing of spheres § Applications of the packing-of-spheres model § Polymorphism § Alloys and intermetallic compounds § Band theory § Semiconductors § Sizes of ions § Ionic lattices § Lattice energy § Born--Haber cycle § Applications of lattice energies § Defects in solid state lattices
6. 1 Introduction Solids Chemistry is traditionally described as the study of molecules. • Except for helium, all substances form a solid if sufficiently cooled. • Solid State Chemistry, a sub discipline of Chemistry, primarily involves the study of extended solids. -The vast majority of solids form one or more crystalline phases – where the atoms, molecules, or ions form a regular repeating array ( unit cell ). -The primary focus will be on the structures of metals, ionic solids, and extended covalent structures, where extended bonding arrangements dominate. -The properties of solids are related to its structure and bonding. -In order to modify the properties of a solid, we need to know the structure of the material. -Crystal structures are usually determined by a technique of X-ray crystallography. -Structures of many inorganic compounds may be initially described in terms of simple packing of spheres.
6. 2 Packing of spheres Considering the packing of spheres in only 2 -dimensions, how efficiently do the spheres pack for the square array compared to the close packed array?
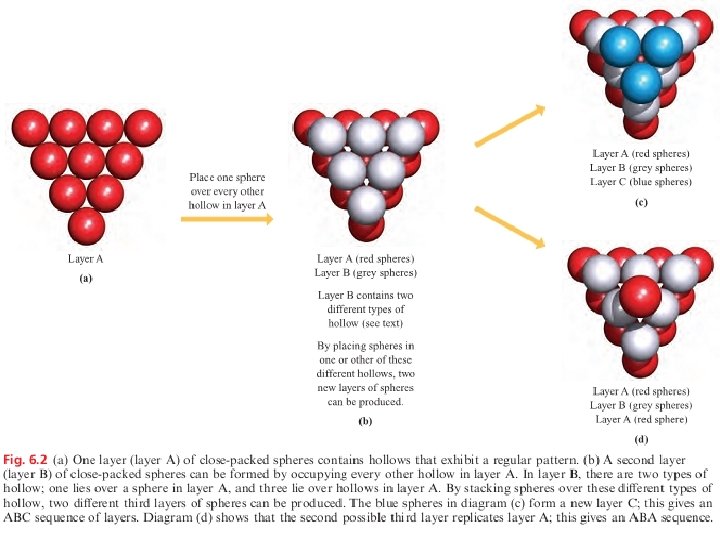
Fig. 6. 1 Part of one layer of a close-packed arrangement of equal-sized spheres. It contains hexagonal motifs.
Close-packing of spheres results in the most efficient use of the space available; 74% of the space is occupied by the spheres. The ABABAB. . . and ABCABC. . . packing arrangements are called hexagonal close-packing (hcp) and cubic close-packing (ccp), respectively. In each structure, anyngiven sphere is surrounded by (and touches) 12 other spheres and is said to have 12 nearest neighbours , to have a coordination number of 12, or to be 12 -coordinate.
Fig. 6. 3 In both the (a) ABA and (b) ABC close-packed arrangements, the coordination number of each atom is 12. Fig. 6. 4 Unit cells of (a) a cubic close-packed (face-centred cubic) lattice and (b) a hexagonal closepacked lattice.
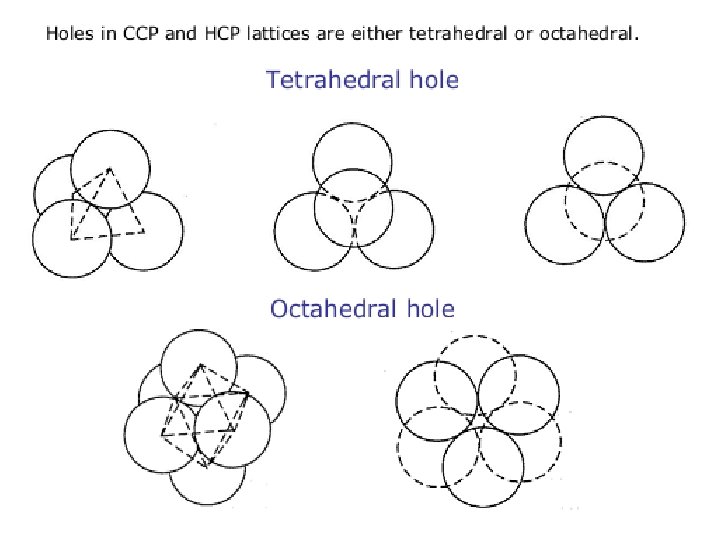
Interstitial holes: hexagonal and cubic close-packing Fig. 6. 5 Two layers of close-packed atoms shown (a) with the spheres touching, and (b) with the sizes of the spheres reduced so that connectivity lines are visible. In (b), the tetrahedral and octahedral holes are indicated.
Non-close-packing: simple cubic and body centred cubic arrays Fig. 6. 6 Unit cells of (a) a simple cubic lattice and (b) a body-centred cubic lattice Body Centered Cubic (bcc) The fraction of space occupied by spheres is 0. 68 Coordination Number = 8
Worked example 6. 1 Packing efficiency Show that in a simple cubic lattice, (a) there is one sphere per unit cell, and (b) approximately 52% of the volume of the unit cell is occupied. (a) The diagram on the left-hand side below is a space-filling representation of the unit cell of a simple cubic lattice, while the right-hand side diagram shows a ball-and-stick representation. In the complete lattice, unit cells are packed side by side in three dimensions. Therefore, each sphere is shared between eight unit cells.
6. 3 The packing of spheres model applied to the structures of elements Group 18 elements in the solid state §Each element (with the exception of He) solidifies only at low temperatures. §The enthalpy changes accompanying the fusion processes are very small, consistent with the fact that only weak van der Waals forces operate between the atoms in the solid state. § In the crystalline solid, ccp structures are adopted by each of solid Ne, Ar, Kr and Xe.
H 2 and F 2 in the solid state §The liquefaction of gaseous H 2 occurs at 20. 4 K and solidification at 14. 0 K. §In the solid state, these spheres adopt an hcp arrangement. § Difluorine solidifies at 53 K, and on cooling to 45 K, a phase change occurs to give a distorted close-packed structure. §The application of the packing-of-spheres model to the crystalline structures of H 2 and F 2 is only valid because they contain freely rotating molecules. §Other diatomics such as the heavier halogens do not behave in this manner
Metallic elements in the solid state
6. 4 Polymorphism in metals Polymorphism: phase changes in the solid state If a substance exists in more than one crystalline form, it is polymorphic. Fig. 6. 7 A pressure–temperature phase diagram for iron.
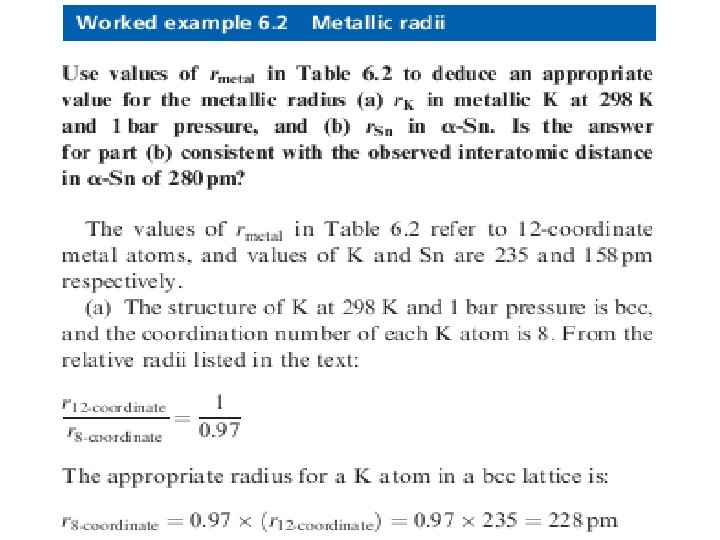
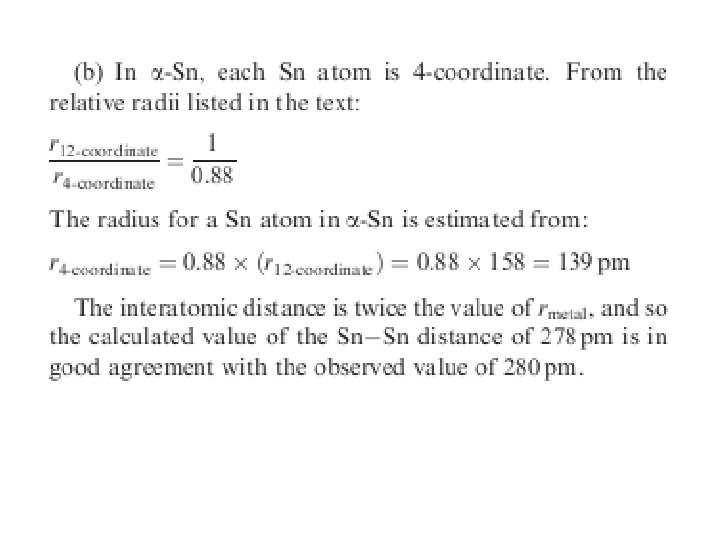
6. 5 Metallic radii The metallic radius is half of the distance between the nearestneighbour atoms in a solid state metal lattice, and is dependent upon coordination number. Structural data for different polymorphs of the same metal indicate that rmetal varies with the coordination number. Coordination number Relative radius 12 1. 00 8 6 0. 97 0. 96 4 0. 88 The values of rmetal listed in Table 6. 2 refer to 12 -coordinate metal centres; since not all metals actually adopt structures with 12 -coordinate atoms, some values of rmetal have been estimated. Values of rmetal (Table 6. 2) increase down each of groups 1, 2, 13 and 14. In each of the triads of the d -block elements, rmetal generally increases on going from the first to second row element, but there is little change on going from the second to third row metal. This latter observation is due to the presence of a filled 4 f level, and the so-called lanthanoid contraction
6. 6 Melting points and standard enthalpies of atomization of metals The metals with the lowest melting points are in groups 1, 12, 13 (with the exception of Al), 14 and 15. These metals are, in general, those that do not adopt close-packed structures in the solid state. when a piece of potassium is dropped on to water, exothermic reaction occurs, providing enough heat energy to melt the unreacted metal; the molten potassium continues to react vigorously.
6. 7 Alloys and intermetallic compounds An alloy is an intimate mixture or, in some cases, a compound of two or more metals, or metals and non-metals; alloying changes the physical properties and resistance to corrosion, heat etc. of the material. Alloys are manufactured by combining the component elements in the molten state followed by cooling. If the melt is quenched (cooled rapidly), the distribution of the two types of metal atoms in the solid solution will be random. Slow cooling may result in a more ordered distribution of the solute atoms. The subject of alloys is not simple, and we shall introduce it only by considering the classes of substitutional and interstitial alloys, and intermetallic compounds.
Substitutional alloys In a substitutional alloy, atoms of the solute occupy sites in the lattice of the solvent metal (Figure 6. 8). An example of a substitutional alloy is sterling silver (used for silver cutlery and jewellery) which contains 92. 5% Ag and 7. 5% Cu; elemental Ag and Cu both adopt ccp lattices and rmetal (Ag) rmetal (Cu) Fig. 6. 8 In a substitutional alloy, some of the atom sites in the host lattice (shown in grey) are occupied by solute atoms (shown in red).
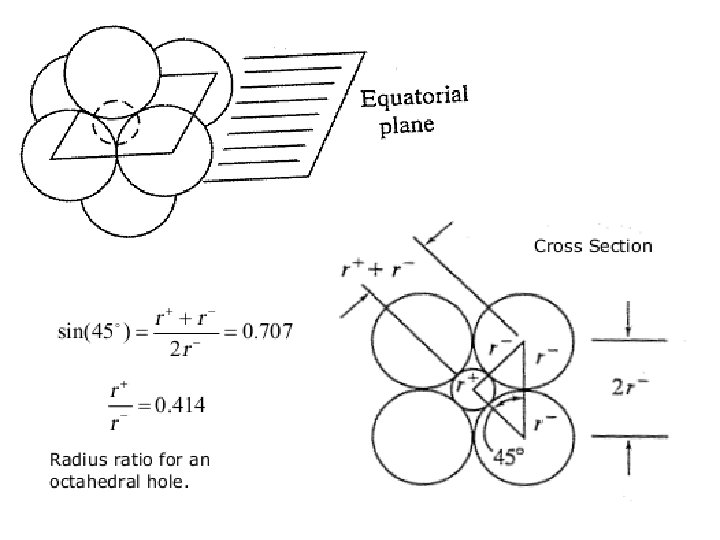
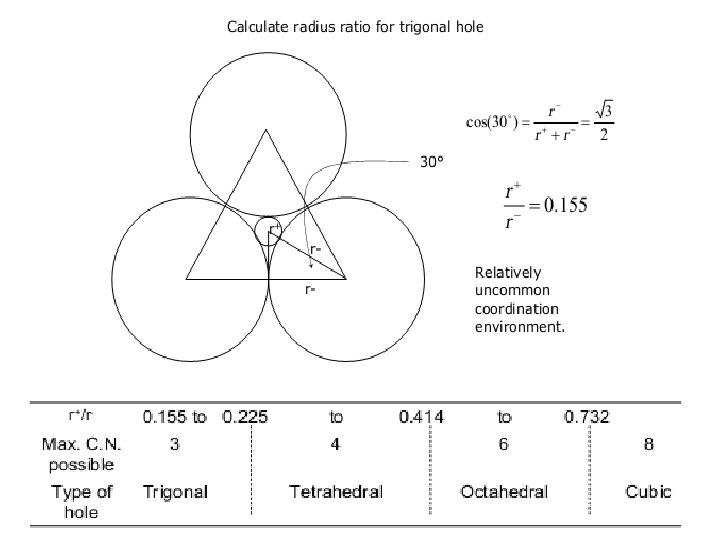
Interstitial alloys A close-packed lattice contains tetrahedral and octahedral interstitial holes (see Figure 6. 5). Assuming a hard-sphere model for the atomic lattice, one can calculate that an atom of radius 0. 41 times that of the atoms in the close-packed array can occupy an octahedral hole, while significantly smaller atoms may be accommodated in tetrahedral holes.
Intermetallic compounds When melts of some metal mixtures solidify, the alloy formed may possess a definite structure type that is different from those of the pure metals. Such systems are classified as intermetallic compounds, e. g. β-brass, Cu. Zn.
6. 8 Bonding in metals and semiconductors Electrical conductivity and resistivity An electrical conductor offers a low resistance (measured in ohms, ) to the flow of an electrical current (measured in amperes, A) Fig. 6. 9 A metal is characterized by the fact that its electrical resistivity increases as the temperature increases, i. e. its electrical conductivity decreases as the temperature increases.
The electrical resistivity of a substance measures its resistance to an electrical current. For a wire of uniform cross-section, the resistivity ( ) is given in units of ohm metre ( m). The electrical conductivity of a metal decreases with temperature; that of a semiconductor increases with temperature. This property distinguishes a metal from a semiconductor , which is a material in which the electrical conductivity increases as the temperature increases
Band theory of metals and insulators An MO diagram describing the bonding in a metallic solid is characterized by having groups of MOs (i. e. bands) which are very close in energy. We can readily see how bands arise by constructing an approximate MO diagram for lithium metal, Lin. If two Li atoms combine, the overlap of the two 2 s atomic orbitals leads to the formation of two MOs. If three Li atoms combine, three MOs are formed, and so on. For n Li atoms, there are n MOs, but because the 2 s atomic orbitals possess the same energy, the energies of the resultant MOs are very close together and so are termed a band of orbitals.
A band is a group of MOs, the energy differences between which are so small that the system behaves as if a continuous, non-quantized variation of energy within the band is possible. The Fermi level is the energy level of the highest occupied orbital in the metal at absolute zero. A band gap occurs when there is a significant energy difference between the bands. 1 e. V = 96. 485 k. J mol-1
Figure 6. 12 a–c illustrates that: . a fully occupied band separated from the next (empty)band by a large energy separation (the band gap ) leads to the material being an insulator; . a partially occupied band leads to the material being metallic; . metallic character is also consistent with the overlap of an occupied and a vacant band. Band theory of semiconductors Figure 6. 12 d illustrates a situation in which a fully occupied band is separated from an unoccupied band by a small bandgap. This property characterizes a semiconductor. electrical conductivity depends upon there being suffi-cient energy available for thermal population of the upper band, and it follows that the conductivity increases as the temperature is raised.
6. 9 Semiconductors Intrinsic semiconductors ﺃﺸﺒﺎﻩ ﺍﻟﻤﻮﺻﻼﺕ ﺍﻟﺬﺍﺗﻴﺔ Conductivity of intrinsic semiconductors (e. g. Si or Ge) increases with temperature. • Conduction can only occur if electrons are promoted to a higher s/p band known as the conduction band, because only then will there be a partially full band. • The current in semiconductors will depend on n , which is the number of electrons free to transport charge. • The number of electrons able to transport charge is given by the number of e-promoted to the conduction band plus the number of e-in the valence band that were freed to move. Additionally, the removal of electrons from the lower valence band creates positive holes into which electrons can move, again leading to the ability to conduct charge. A charge carrier in a semiconductor is either a positive hole or an electron that is able to conduct electricity.
Extrinsic (n- and p-type) semiconductors The semiconducting properties of Si and Ge can be enhanced by doping these elements with atoms of a group 13 or group 15 element. Doping involves the introduction of only a minutely small proportion of dopant atoms, less than 1 in 106, and extremely pure Si or Ge must first be produced. Extrinsic semiconductors contain dopants; a dopant is an impurity introduced into a semiconductor in minute amounts to enhance its electrical conductivity. p-type Fig. 6. 13 (a) In a p-type semiconductor (e. g. Gadoped Si), electrical conductivity arises from thermal population of an acceptor level which leaves vacancies (positive holes) in the lower band. (b) In an n-type semiconductor (e. g. As-doped Si), a donor level is close in energy to the conduction band. n-type
Deliberate introduction of a very low concentration of certain impurities alters the properties in a beneficial way. • These semiconductors are known as doped or extrinsic semiconductors. • Consider introduction of boron (B) to Si. For every B, there is an electron missing from the valence band this enables electrons near the top of the band to conduct better than pure Si. • A semiconductor doped with fewer valence electrons than the bulk is known as a p-type semiconductor. • Consider introduction of phosphorous (P) to Si. For every P, there is an extra electron and this forms energy levels that lie in the band gap between the valence and conduction band. Electrons are therefore close to the bottom of the conduction band are easily promoted, enabling better conduction than pure Si. • A semiconductor doped with more valence electrons than the bulk is known as an n-type semiconductor. The n stands for negative charge carries or electrons.
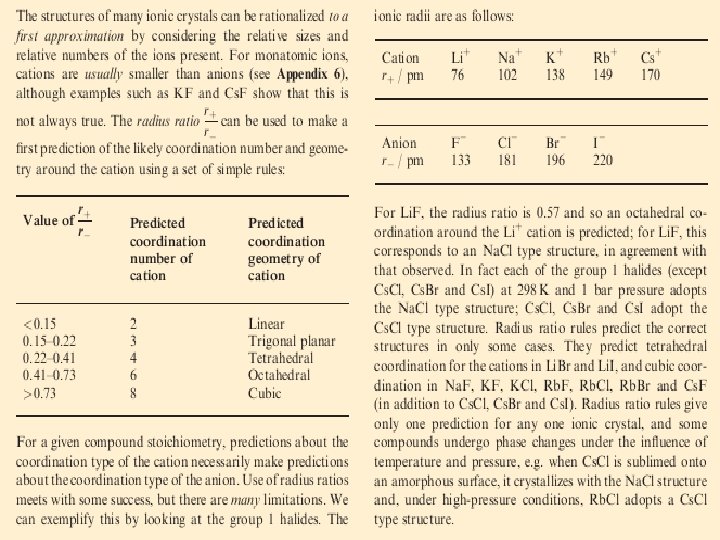
6. 10 Sizes of ions Ionic radii High Resolution X-ray diffraction contour map of electron density. -the minimum of electron density along the interionic distances enables accurate determination of the values of the radius for the cation and anion. Internuclear distance between a cation and the closest anion in a lattice = rcation + ranion
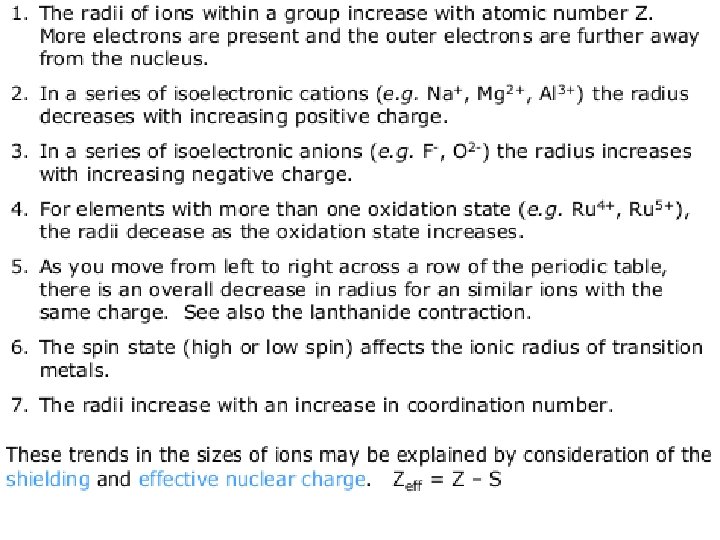
Periodic trends in ionic radii Fig. 6. 14 Trends in ionic radii, rion, within the metal ions of groups 1 and 2, the anions of group 17, and metal ions from the first row of the d- block
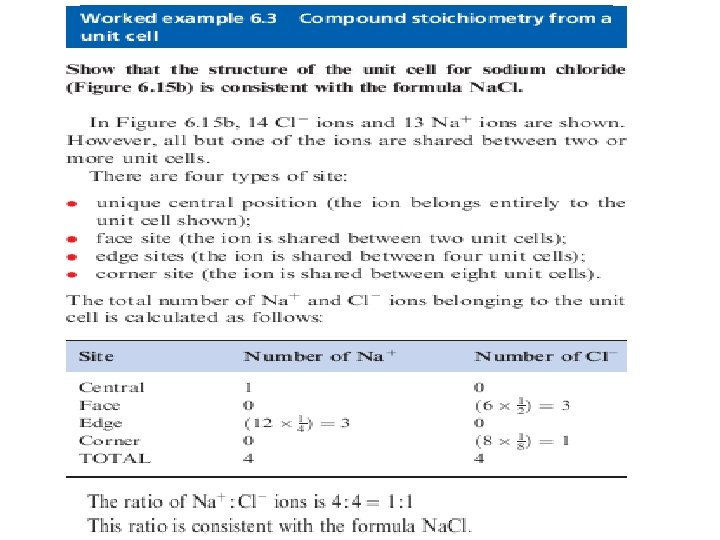
6. 11 Ionic lattices The rock salt (Na. Cl) structure type In salts of formula MX, the coordination numbers of M and X must be equal. Fig. 6. 15 Two representations of the unit cell of Na. Cl: (a) shows a space-filling representation, and (b) shows a ‘ball-and-stick’ representation which reveals the coordination environments of the ions. The Cl- ions are shown in green and the Na+ ions in purple; since both types of ion are in equivalent environments, a unit cell with Na+ ions in the corner sites is also valid. There are four types of site in the unit cell: central (not labelled), face, edge and corner positions.
The caesium chloride (Cs. Cl) structure type Fig. 6. 16 (a) The unit cell of Cs. Cl; Cs+ ions are shown in yellow and Cl- in green, but the unit cell could also be drawn with the Cs ion in the central site. The unit cell is defined by the yellow lines. (b) One way to describe the Cs. Cl structure is in terms of interpenetrating cubic units of Cs+ and Cl- ions.
The fluorite (Ca. F 2) structure type In salts of formula MX 2, the coordination number of X must be half that of M. Fig. 6. 18 (a) The unit cell of Ca. F 2; the Ca 2+ ions are shown in red and the F- ions in green.
The zinc blende (Zn. S) structure type: a diamond-type network Fig. 6. 18 (b) The unit cell of zinc blende (Zn. S); the zinc centres are shown in grey and the sulfur centres in yellow. Both sites are equivalent, and the unit cell could be drawn with the S 2 - ions in the grey sites.
Fig. 6. 19 (a) A typical representation of the diamond structure. (b) Reorientation of the network shown in (a) provides a representation that can be compared with the unit cell of zinc blende (Figure 6. 18 b); the atom labels correspond to those in diagram (a). This structure type is also adopted by Si, Ge and α-Sn. (c) The unit cell of β-cristobalite, Si. O 2 ; colour code: Si, purple; O, red.
The wurtzite (Zn. S) structure type Fig. 6. 20 Three unit cells of wurtzite (a second polymorph of Zn. S) define a hexagonal prism; the Zn 2+ions are shown in grey and the S 2 -ions in yellow. Both ions are tetrahedrally sited an alternative unit cell could be drawn by interchanging the ion positions. The rutile (Ti. O 2) structure type Fig. 6. 21 The unit cell of rutile (one polymorph of Ti. O 2); the titanium centres are shown in grey and the oxygen centres in red
Cd. I 2 and Cd. Cl 2 : layer structures Many compounds of formula MX 2 crystallize in so-called layer structures , a typical one being Cd. I 2 which has hexagonal symmetry. This structure can be described in terms of I- ions arranged in an hcp array with Cd 2+ ions occupying the octahedral holes in every other layer Fig. 6. 22 Parts of two layers of the Cd. I 2 lattice; Cd 2+ ions are shown in pale grey and I- ions in gold. The I- ions are arranged in an hcp array
The perovskite (Ca. Ti. O 3) structure type: a double oxide Fig. 6. 23 (a) One representation of a unit cell of perovskite (Ca. Ti. O 3); (b) the Ca 2+ion is 12 -coordinate with respect to the O 2 - ions. Colour code: Ca, purple; O, red; Ti, pale grey.
6. 13 Lattice energy: estimates from an electrostatic model The lattice energy , DU (0 K), of an ionic compound is the change in internal energy that accompanies the formation of one mole of the solid from its constituent gas-phase ions at 0 K. For a salt MXn, equation 6. 7 defines the reaction, the energy change for which corresponds to the lattice energy. The energy due to the coulombic interactions in a crystal is calculated for a particular structure by summing all the ion-pair interactions, thus producing an infinite series.
Coulombic interactions in an ionic lattice Now consider a salt MX which has an Na. Cl structure. A study of the coordination Geometry shows that each Mz+ion is surrounded by:
The lattice energy is estimated in joules per mole of compound
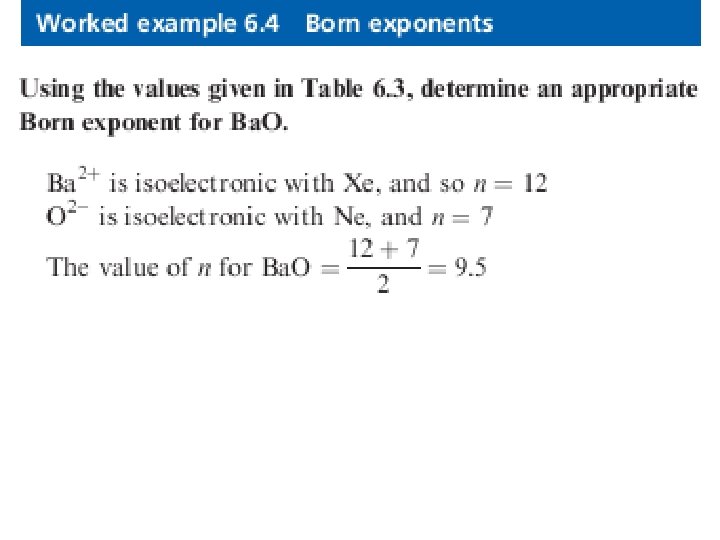
Born forces Coulombic interactions are not the only forces operating in a real ionic lattice. The ions have finite size, and electron–electron and nucleus– nucleus repulsions also arise; these are Born forces. B = repulsion coefficient n = Born exponent
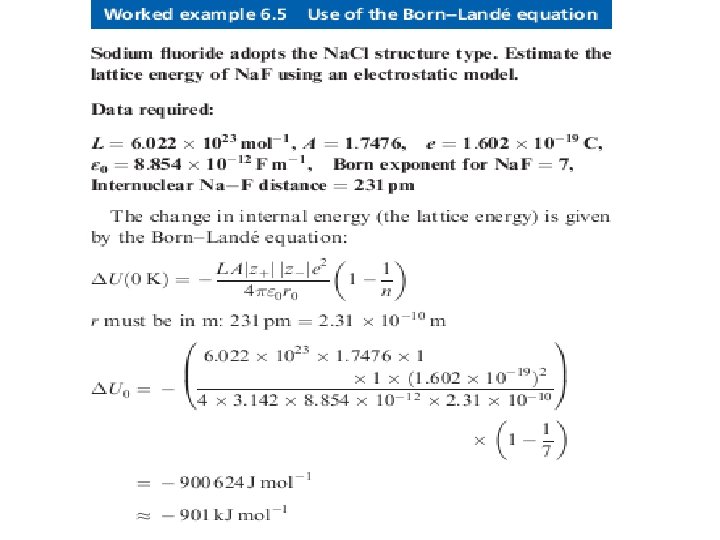
The Born--Lande´ equation We evaluate B in terms of the other components of the equation by making use of the fact that at the equilibrium separation where r = r 0, the differential Differentiating with respect to r gives equation 6. 14, and rearrangement gives an expression for B (equation 6. 15). Combining equations 6. 13 and 6. 15 gives equation 6. 16 which is the Born–Lande´ equation.
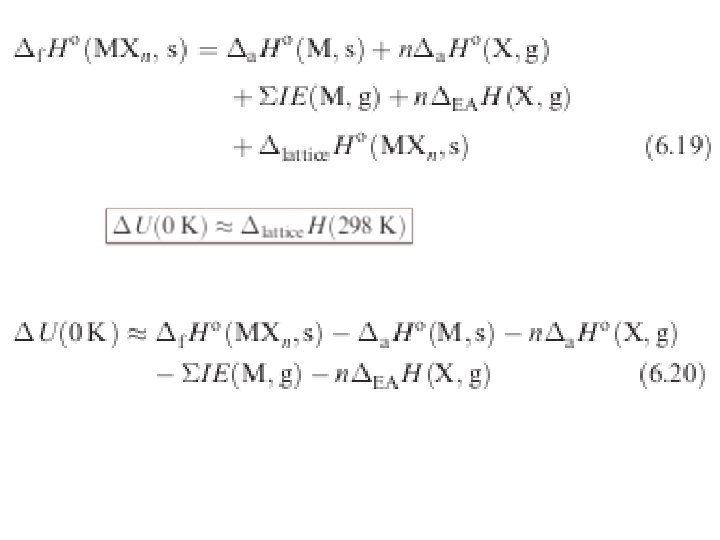
6. 14 Lattice energy: the Born-Haber cycle By accounting for three energies (ionization energy, electron affinity, and lattice energy), we can get a good idea of the energetics of the enthalpy of formation of an ionic solid. Fig. 6. 24 A Born–Haber thermochemical cycle for the formation of a salt MXn. This gives an enthalpy change associated with the formation of the ionic lattice MXn.
Worked example 6. 6 Application of the Born-Haber cycle Given that the standard enthalpy of formation at 298 K of Ca. F 2 is -1228 k. J mol-1, determine the lattice energy for Ca. F 2 using appropriate data from the Appendices.
6. 17 Defects in solid state lattices: an introduction Schottky defect A Schottky defect consists of an atom or ion vacancy in a crystal lattice, but the stoichiometry of a compound (and thus electrical neutrality) must be retained. Examples of Schottky defects in ionic lattices are a vacant cation and a vacant anion site in an MX salt, or a vacant cation and two vacant anion sites in an MX 2 salt. Fig. 6. 26 (a) Part of one face of an ideal Na. Cl compare this with Figure 6. 15. (b) A Schottky defect involves vacant cation and anion sites; equal numbers of cations and anions must be absent to maintain electrical neutrality. Colour code: Na, purple; Cl, green.
Frenkel defect In a Frenkel defect, an atom or ion occupies a normally vacant site, leaving its ‘own’ lattice site vacant. Fig. 6. 27 Silver bromide adopts an Na. Cl structure. (a) An ideal lattice can be described in terms of Ag+ ions occupying octahedral holes in a cubic close-packed array of bromide ions. (b) A Frenkel defect in Ag. Br involves the migration of Ag+ ions into tetrahedral holes; in the diagram, one Ag+ ion occupies a tetrahedral hole which was originally vacant in (a), leaving the central octahedral hole empty. Colour code: Ag, pale grey; Br, gold. Schottky defects lead to the observed density of a crystal being lower than that calculated from X-ray diffraction and data based on the size and structure of the unit cell. Frenkel defect does not involve a change in the number of atoms or ions present, no such density differences will be observed.