Chapter 6 Random Variables 6 1 Discrete and

Chapter 6 Random Variables 6. 1 Discrete and Continuous Random Variables Outcome: I will compute probabilities using the probability distribution of discrete and continuous random variables and calculate and interpret the mean and standard deviation of a discrete random variable.

Video! http: //www. learner. org/courses/againstallodds/u nitpages/unit 20. html

Say we flip a coin 3 times – Sample Space: {HHH, HHT, HTH, THH, HTT, THT, TTH, TTT} – 8 equally likely outcomes, so the probability is 1/8 for each possible outcome. – Define X = the number of heads obtained – Will vary from one set of tosses to the next, but will always be either 0, 1, 2, or 3 – How likely is X to take each of those values? X = 0: TTT X = 1: HTT THT TTH X = 2: HHT HTH THH X = 3: HHH

We can summarize the probability distribution of X: Value: Probability: 0 1 2 3 1/8 3/8 1/8 – We can use the probability distribution to answer questions about the variable X.

Value: Probability: – 0 1 2 3 1/8 3/8 1/8

– Random Variable: takes numerical values that describe the outcomes of some chance process – Probability Distribution: gives a random variable’s possible value and their probabilities

Discrete Random Variable – Value: … Probability: …

Example – Imagine selecting a U. S. high school student at random. Define the random variable X = number of languages spoken by the randomly selected student. The table below givens the probability distribution of X, based on a sample of students from the U. S. Census at School database. Languages: Probabilities: 1 2 3 4 5 . 630 . 295 . 065 . 008 . 002 a. ) Show that the probability distribution for X is legitimate b. ) Make a histogram of the probability distribution. Describe what you see. c. ) What is the probability that a randomly selected student speaks at least 3 languages?
 of a Discrete Random Variable –")
Mean (Expected Value) of a Discrete Random Variable –
 of a Discrete Random Variable – Value: … Probability: …")
Mean (Expected Value) of a Discrete Random Variable – Value: … Probability: …
 – In the last example, we defined X = number of languages")
Example (continued) – In the last example, we defined X = number of languages spoken for a randomly selected U. S. high school student. The table below gives the probability distribution for X again. Languages: Probabilities: 1 2 3 4 5 . 630 . 295 . 065 . 008 . 002 Compute and interpret the mean of the random variable X.
 of a Discrete Random Variable – Remember for quantitative data,")
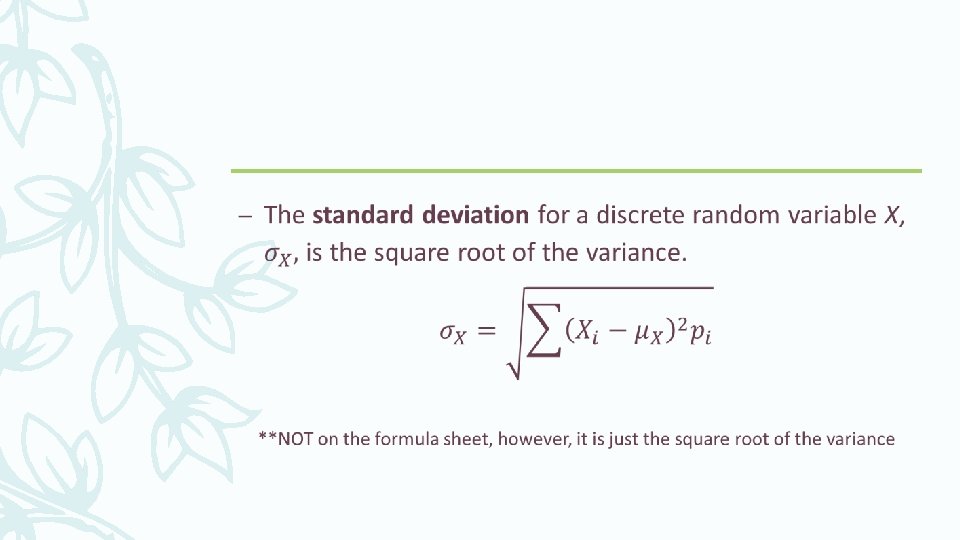
Standard Deviation (And Variance) of a Discrete Random Variable – Remember for quantitative data, the variance was the “typical” squared deviation from the mean. Then we’d take the square root of it to get the standard deviation. – The definition is very similar for random variables
 of a Discrete Random Variable – Value: … Probability: …")
Standard Deviation (And Variance) of a Discrete Random Variable – Value: … Probability: …
 – Languages: Probabilities: 1 2 3 4 5 . 630 . 295")
Example (continued) – Languages: Probabilities: 1 2 3 4 5 . 630 . 295 . 065 . 008 . 002

Continuous Random Variable – A continuous variable X takes all values in an interval of numbers. The probability distribution of X is described by a density curve. – The probability of any event is the area under the density curve and above the values of X that make up the event.
- Slides: 16