Chapter 6 Part 4 Process Capability Meaning of

Chapter 6 – Part 4 Process Capability

Meaning of Process Capability · The capability of a process is the ability of the process to meet the specifications. · A process is capability of meeting the specification limits if at least 99. 73% of the product falls within the specification limits. · This means that the fraction of product that falls outside the specification limits is no greater than 0. 0027, or that no more that 3 out of 1, 000 units is “out of spec. ” · Our method of computing process capability assumes that the process is normally distributed.

Control Limits vs. Spec. Limits · Control limits apply to sample means, not individual values. · · Mean diameter of sample of 5 parts, X-bar Spec limits apply to individual values · Diameter of an individual part, X

Control Limits vs. Spec. Limits Sampling distribution, X-bar Process distribution, X Mean= Target LSL Lower control limit Upper control limit USL

Requirements for Assessing Process Capability · To assess capability of a process, the process must be in statistical control. · That is, all special causes of variation must be removed prior to assessing capability. · Also, process performance characteristic (e. g. , diameter, bake time) must be normally distributed.

Cp Index USL = upper specification limit LSL = Lower specification limit
 of the process to be as")
Cp Index • We want the spread (variability) of the process to be as ? ? ? • If the spread of the process is very ? ? , the capability of the process will be very ? ?

Cp Index Process distribution, X USL LSL Width of spec limits = USL - LSL Spread of Process = USL - LSL

Process is Barely Capable if Cp = 1. 9973 . 00135 LSL USL X Spread of process matches the width of specs. 99. 73% of output is within the spec. limits.

Process Barely Capable if Cp = 1 · If Cp=1, what does this imply regarding the spec. limits? LSL = USL =

Process Barely Capable if Cp = 1

Process is Capable if Cp > 1 >. 9973 <. 00135 LSL USL X Spread of process is less than the width of specs. More than 99. 73% of output is within the spec. limits.

Process is Not Capable if Cp < 1 <. 9973 >. 00135 LSL USL X Spread of process is greater than the width of specs. Less than 99. 73% of output is within the spec. limits.

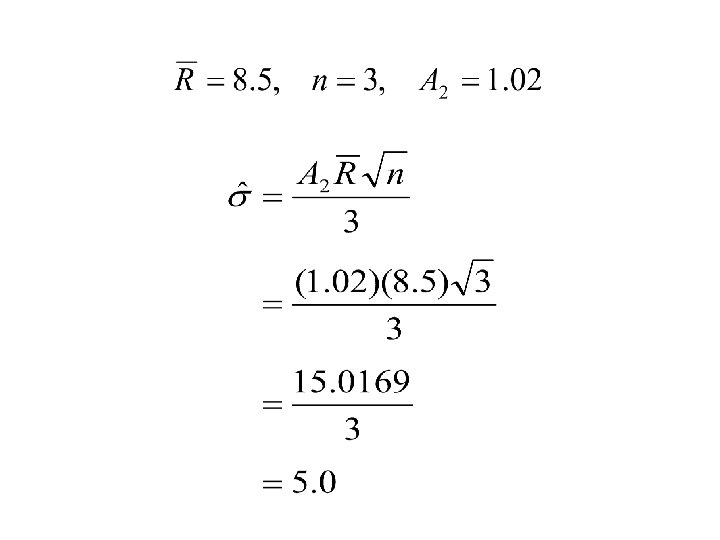
Estimating the Standard Deviation

Estimating the Standard Deviation

Sugar Example Ch. 6 - 3 Day Hour 1 10 am 2 X 1 17 X 2 13 X X 3 6 36/3 =12 R 11 1 pm 15 12 24 51/3 =17 12 4 pm 12 21 15 48/3 =16 9 10 am 13 12 17 42/3 =14 5 1 pm 18 21 15 54/3 =18 6 4 pm 10 18 17 45/3 =15 = 92/6 = 15. 33 8 = 51/6 = 8. 5

Capability of Sugar Process USL = 20 grams LSL = 10 grams

Capability of Sugar Process Since Cp <1, the process is not capability of meeting the spec limits. · The fraction of defective drinks (drinks with either too much or not enough sugar) will exceed. 0027. · That is, more than 3 out of every 1000 drinks produced can be expected to be too sweet or not sweet enough. · We now estimate the process fraction defective, p-bar. ·

Estimated Process Fraction Defective · What is the estimated process fraction defective -the percentage of product out of spec? p-bar = F 1 + F 2 LSL USL F 1 F 2 Mean

Estimated Process Fraction Defective · We can then use Cp to determine the p-bar because there is a simple relationship between Cp and z: z = 3 Cp (See last side for deviation of this result. ) • Suppose, Cp =0. 627 z = 3(0. 627) =1. 88

Estimated Process Fraction Defective The z value tells us how many standard deviations the specification limits are away from the mean. · A z value of 1. 88 indicates that the USL is 1. 88 standard deviations above the mean. · The negative of z, -1. 88, indicates that the LSL is 1. 88 standard deviations below the mean. · We let Area(z) be the area under the standard normal curve between 0 and z. ·
 = Area(1. 88) = 0. 4699 LSL USL F 2")
Process Fraction Defective Area(z) = Area(1. 88) = 0. 4699 LSL USL F 2 0 z =1. 88 F 2 = % above USL =. 5000 - 0. 4699 =. 0301
 z . 00 . 01 . 02 . .")
z Table (Text, p. 652) z . 00 . 01 . 02 . . 08 0. 0 0. 1 0. 2. . . 09 1. 8 . 4699 . 09
![Process Fallout p-bar = 2[. 5 – Area(z)] = F 1 + F 2](http://slidetodoc.com/presentation_image_h/d1477fbf273499269e01cce34249c880/image-25.jpg "Process Fallout p-bar = 2[. 5 – Area(z)] = F 1 + F 2")
Process Fallout p-bar = 2[. 5 – Area(z)] = F 1 + F 2 0. 4699 LSL USL F 1 F 2 0 z =1. 88 p-bar = 2(. 5 –. 4699) = 2(. 0301)=. 0602

Process Fallout – Two Sided Spec. Cp z = 3 Cp Fallout = 2[. 5 – Area(z)] 0. 25 0. 75 Defect Rate in PPM (parts per million) 2[. 5 -. 2734] =. 4532 453, 200 PPM 0. 80 2. 40 2[. 5 -. 4918] =. 0164 16, 400 PPM 1. 0 3 2[. 5 -. 4987] =. 0026 2, 600 PPM 1. 5 -4. 5 From Excel 2[Area(-z)]= 2[. 0000034] =. 0000068 7 PPM

Recommended Minimum Cp Process Cp z = 3 Cp Existing process 1. 25 3. 75 New process 1. 45 4. 35 Fallout 2[Area(-z)]= 2[. 000088] =. 0001769 2[Area(-z)]= 2[. 000006812] =. 0000136 PPM 176. 9 13. 6

Recommended Minimum Cp Process Cp z = 3 Cp Safety, existing process 1. 45 4. 35 Safety, new process 1. 60 4. 80 Fallout 2[Area(-z)]= 2[. 000006812] =. 0000136 2[Area(-z)]= 2[. 000000794] =0. 0000016 PPM 13. 6 1. 6
 =")
Soft Drink Example Cp =0. 33 z = 3 Cp = 3(0. 33) = 0. 99 Area(z) = Area(0. 99) = 0. 3389 p-bar = 2[. 5 - Area(0. 99)] = 2[. 5 - 0. 3389] = 0. 3222

Capability Index Based on Target • Limitation of Cp is that it assumes that the process is mean is on target. Process Mean = Target Value = (LSL + USL)/2

CT Capability Index With Cp, capability value is the same whether the process is centered on target or is way off. · Cp is not affected by location of mean relative to target. · We need capability index that accounts for location of the mean relative to the target as well as the variance. · CT is an index that accounts for the location of mean relative to target. ·

CT Capability Index

CT Capability Index If process is centered on target, If process is off target,

Example of CT LSL = 10, USL = 20, estimated standard deviation = 5. 0 and estimate process mean = 15. 33. Compute CT.

CT Capability Index If process mean is adjusted to target,

CT Capability Index Cp is the largest value that CT can equal. · Since Cp = 2. 2 and CT =. 44, the difference · is the maximum amount by which we can increase CT by adjusting the mean to the target value.

Conclusion?

Derivation of z = 3 Cp
- Slides: 38