Chapter 6 Control Chart for Attributes 1 Control
Sign up to view full document!
SIGN UP

Chapter 6 Control Chart for Attributes 1

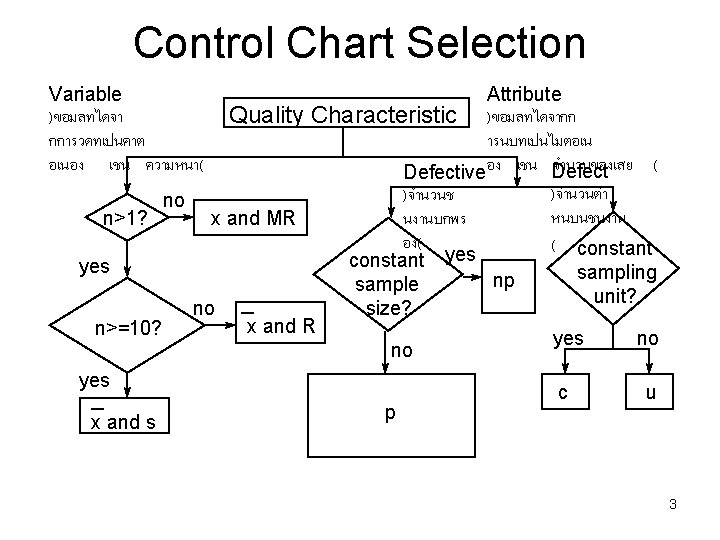
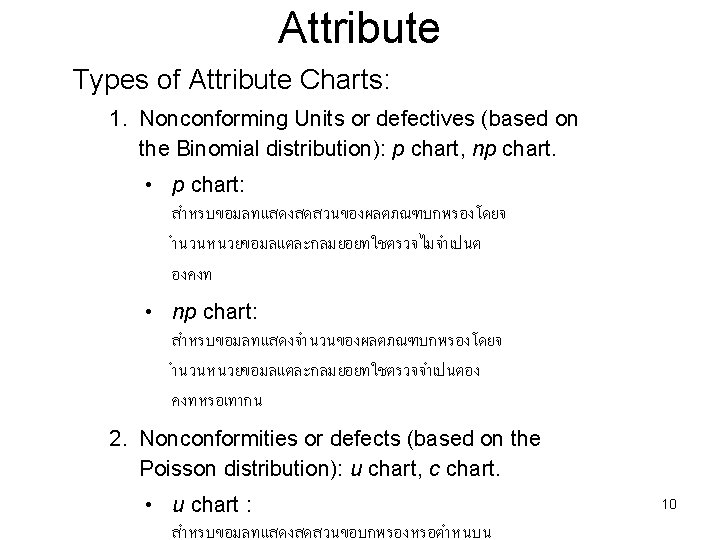
Control Charts Continuous Numerical Data Discrete Numerical Data Variables Charts R Chart X Chart Attributes Charts P Chart C Chart

Good and Bad part GOOD BAD PART
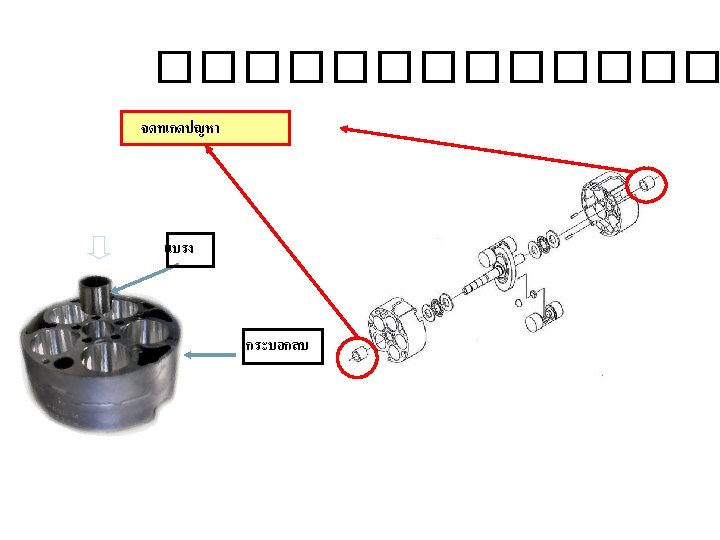
 Fraction defective for electric machine part")
Control chart (example 1) Fraction defective for electric machine part
 The data of electroplating part defectives, the sample size =")
Control chart (example 2) The data of electroplating part defectives, the sample size = 100 UCL = 10. 39 LCL = 0
 Number of pin holes in enamel wire, the length (m)")
Control chart (example 3) Number of pin holes in enamel wire, the length (m) of samples varies
 The defects per square meter of fabric UCL = 10.")
Control chart (example 4) The defects per square meter of fabric UCL = 10. 2 LCL = 0
- Slides: 16