Chapter 6 b Hypothesis Test for proportion and

Chapter 6 b Hypothesis Test for proportion and variance

Opening Example The Hershey Company claims that the color distribution for Reese’s Pieces candy is 50% orange, 25% brown & 25% yellow. An employee thinks the company is under producing yellow reese’s pieces, so he takes a random sample of 100 reese’s pieces and finds 16 are yellow. Does it seem unusual (“news worthy”) to get of 16 yellows (when n=100) if the true proportion is 25%?

Recall the sampling distribution of the sample proportion …. http: //www. rossmanchance. com/applets/Reeses 3/Reeses. Pieces. html What is the z-score of the sample proportion 0. 16? Recall the Empirical Rule … • 95% of sample proportions should have a z-score between -2 and 2 • We are more than 2 standard deviations below the mean • Therefore the chances of 100 Reese’s pieces containing only 16 or less yellow pieces is less than. 025. Is that too unlikely? • If there is a less than 2. 5% chance of rain – would you be surprised if it rained? • If there is a less than 2. 5% chance of you winning the lottery would you be surprised if you won? • What if that 2. 5% became 1% or. 5% or. 4% would your answers change?
 value [usually about status")
Elements of Hypothesis Test Hypotheses a. Null Hypothesis: parameter (=) value [usually about status quo] b. Alternative Hypothesis: parameter (<, >, ≠) value [opposite of null hypothesis] Assumptions a. Random sample b. Sample statistic follows distribution used for test statistic [for mean – n >30] Test a. Calculate test statistic b. Find rejection region – specify alpha c. Does your test statistic fall in rejection region? OR a. Calculate test statistic b. Find p-value c. Is p-value < or > alpha Summary a. Write outcome of part (c) from Step 3. Be sure to state alpha. b. Write conclusion statement about parameter (population mean, population proportion, etc. ) in context of the problem (give context of parameter – height of 5 th graders, calories in hotdogs, SAT score of Clemson students, etc)

HYPOTHESIS A statistical hypothesis is a statement about the numerical value of a population parameter. Null Hypothesis: The null hypothesis is that which represents the status quo to the party performing the sampling experiment – the hypothesis that will be maintained unless the data provide convincing evidence that it is false. Examples: H 0: μ = 17 H 0: p=. 17 Alternative Hypothesis: The alternative hypothesis is that which will be considered true only if the data provide convincing evidence of its truth. Examples: HA: μ ≠ 17 HA: μ > 223 HA: p ≠. 17 HA: p <. 67

Steps for Selecting the Null and Alternative Hypotheses There are two types of statistical tests - One-tailed (or one-sided) - Two-tailed (or two-sided) 1. Select the alternative hypothesis for which the sampling experiment is intended to establish. The alternative hypothesis will assume one of three forms: One-tailed, upper tailed ex. (Ha: µ > 5) One-tailed, lower tailed ex. (Ha: µ < 5) Two-tailed ex. (Ha: µ ≠ 5) 2. Select the null hypothesis as the status quo, that which will be presumed true unless the sampling experiment conclusively establishes the alternative hypothesis. The null hypothesis will be specified as that parameter value closest to the alternative in one-tailed tests and as the complementary value in the two-tailed tests (ie, the null hypothesis is always an = hypothesis) [see page 326 of text for explanation on why null is always =]
![Example - [6. 9] The Sloan Survey of Online Learning, “Making the Grade Online](http://slidetodoc.com/presentation_image/2f86cb75dec2d0984640cce42c3d47f4/image-7.jpg "Example - [6. 9] The Sloan Survey of Online Learning, “Making the Grade Online")
Example - [6. 9] The Sloan Survey of Online Learning, “Making the Grade Online Education in the United States, ” reported that 60% of college presidents believe that their online education course are as good as or superior to courses that use traditional face-to-face instruction. Give the null and two-tailed alternative hypotheses for testing the claim made by the Sloan Survey. Is this test about mean or proportion? Proportion 60% H 0: p = 0. 60 HA: p ≠ 0. 60 Where p represents the population proportion of college presidents that believe their online education courses are as good as or superior to courses that use traditional face-to-face instruction
![Example - [6. 12] American Express Consulting reported in USA Today that 80% of](http://slidetodoc.com/presentation_image/2f86cb75dec2d0984640cce42c3d47f4/image-8.jpg "Example - [6. 12] American Express Consulting reported in USA Today that 80% of")
Example - [6. 12] American Express Consulting reported in USA Today that 80% of US companies have formal, written travel and entertainment policies for their employees. Give the null and one-tailed (upper-tail) alternative hypothesis for testing the claim made by American Express Consulting Is this test about mean or proportion? Proportion 80% H 0: p = 0. 80 HA: p > 0. 80 Where p represents the population proportion of US companies that have formal travel and entertainment policies for their employees
![Example - [6. 13] A University of Florida economist conducted a study of Virginia](http://slidetodoc.com/presentation_image/2f86cb75dec2d0984640cce42c3d47f4/image-9.jpg "Example - [6. 13] A University of Florida economist conducted a study of Virginia")
Example - [6. 13] A University of Florida economist conducted a study of Virginia elementary school lunch menus. During the state-mandated testing period, school lunches averaged 863 calories. The economist claims that after the testing period ends, the average caloric content of Virginia school lunches drops significantly. Set up the null and alternative hypotheses to test the economist’s claim Is this test about mean or proportion? Mean “average caloric content” H 0: µ = 863 HA: µ < 863 Where µ represents the population mean number of calories for an elementary school lunch in Virginia

TEST STATISTIC Test Statistic: The test statistic is a sample statistic, computed from information provided in the sample that the researcher uses to decide between the null and alternative hypotheses. Usually a z-score or t-score or Chi-square (too come)

Rejection Region: The rejection region of a statistical test is the set of possible values of the test statistic for which the researcher with reject H 0 in favor of Ha. The Rejection Region has an area of α. If your test statistic falls in the region then reject H 0 if it does not then do not reject H 0.

TYPES OF ERRORS Type I error: A Type I error occurs if the researcher rejects the null hypothesis in favor of the alternative hypothesis when, in fact, H 0 is true. The probability of committing a Type I error is denoted by α. Type II error: A Type II error occurs the researcher maintains the null hypothesis when, in fact, H 0 is false. The probability of committing a Type II error is denoted by β.
![Example - [6. 15] According to Chemical Marketing Reporter, pharmaceutical companies spend $15 billion](http://slidetodoc.com/presentation_image/2f86cb75dec2d0984640cce42c3d47f4/image-13.jpg "Example - [6. 15] According to Chemical Marketing Reporter, pharmaceutical companies spend $15 billion")
Example - [6. 15] According to Chemical Marketing Reporter, pharmaceutical companies spend $15 billion per year on research and development of new drugs. The pharmaceutical company must subject each new drug to lengthy and involved testing before receiving the necessary permission from the Food and Drug Administration (FDA) to market the drug. The FDA’s policy is that the pharmaceutical company must provide substantial evidence that a new drug is safe prior to receiving FDA approval, so that the FDA can confidently certify the safety of the drug to potential customers. a. If the new drug testing were to be placed in a test of hypothesis framework, would the null hypothesis be that the drug is safe or unsafe? The alternative hypothesis? H 0: drug unsafe HA: drug safe

b. Given the choice of null and alternative hypothesis in part a describe Type I and Type II errors in terms of this application. α = Type I error : Reject H 0 (say drug is safe) when in fact H 0 is true (drug is unsafe β = Type II error : Do Not Reject H 0 (say drug is unsafe) when in fact HA is true (drug is safe)

c. If the FDA wants to be very confident that the drug is safe before permitting it to be marketed, is it more important that α or β be small? Explain. It is more important that α is small.
![Example - [6. 17] Sometimes the outcome of a jury trial defies the “common](http://slidetodoc.com/presentation_image/2f86cb75dec2d0984640cce42c3d47f4/image-16.jpg "Example - [6. 17] Sometimes the outcome of a jury trial defies the “common")
Example - [6. 17] Sometimes the outcome of a jury trial defies the “common sense” expectations of the general public (e. g. the OJ Simpson verdict in the “Trial of the Century”). Such a verdict is more acceptable if we understand that the jury trial of an accused murderer is analogous to the statistical hypothesis process. The null hypothesis in a jury trial is that the accused is innocent. (The status-quo hypothesis in the US system of justice is innocence, which is assumed to be true until proven beyond a reasonable doubt. ) The alternative hypothesis is guilt, which is accepted only when sufficient evidence exists to establish its truth. If the vote of the jury is unanimous in favor of guilt, the null hypothesis of innocence is rejected, and the court concludes that the accused murderer is guilty. Any vote other than a unanimous one for guilt results in a “not guilty” verdict. The court never accepts the null hypothesis; that is, the court never declares the accused “innocent. ” A “not guilty” verdict (as in the OJ Simpson case) implies that the court could not find the defendant guilty beyond a reasonable doubt.

a. Define Type I and Type II errors in a murder trial Type I – conclude guilty when actually innocent Type II – conclude not guilty when actually guilty b. Which of the two errors is the more serious? Explain.

c. The court does not, in general, know the values of α and β; but ideally, both should be small. One of these probabilities is assumed to be smaller than the other in a jury trial. Which one, and why? α – by needing a unanimous decision d. For a jury prejudiced against a guilty verdict as the trial begins, will the value of α increase or decrease? Explain. α will decrease

e. For a jury prejudiced against a guilty verdict as the trial begins, will the value of β increase or decrease? Explain. β will increase

Setting Up Rejection Region Now that you know how to set up your hypotheses – if you are given α OR you determine a value for α. Then you should be able to determine the rejection regions. [For now we will concentrate on rejection regions for z-values (Large Sample Hypothesis Test for Mean and Proportion)]
![Example - [6. 9] The Sloan Survey of Online Learning, “Making the Grade Online](http://slidetodoc.com/presentation_image/2f86cb75dec2d0984640cce42c3d47f4/image-21.jpg "Example - [6. 9] The Sloan Survey of Online Learning, “Making the Grade Online")
Example - [6. 9] The Sloan Survey of Online Learning, “Making the Grade Online Education in the United States, ” reported that 60% of college presidents believe that their online education course are as good as or superior to courses that use traditional face-to-face instruction. Give the rejection region for a two-tailed test conducted at α = 0. 01. How do we find this z-value?

Example - American Express Consulting reported in USA Today that 80% of US companies have formal, written travel and entertainment policies for their employees. Give the null and one-tailed (upper-tail) alternative hypothesis for testing the claim made by American Express Consulting. (done above) Now give the rejection region at α = 0. 05 Recall: H 0: p = 0. 80 HA: p > 0. 80 Therefore … Upper Tailed Test
![Examples [6. 13] A University of Florida economist conducted a study of Virginia elementary](http://slidetodoc.com/presentation_image/2f86cb75dec2d0984640cce42c3d47f4/image-23.jpg "Examples [6. 13] A University of Florida economist conducted a study of Virginia elementary")
Examples [6. 13] A University of Florida economist conducted a study of Virginia elementary school lunch menus. During the state-mandated testing period, school lunches averaged 863 calories. The economist claims that after the testing period ends, the average caloric content of Virginia school lunches drops significantly. Set up the null and alternative hypotheses to test the economist’s claim. (done above) Now give the rejection region at α =. 1. Recall: H 0: µ = 863 HA: µ < 863 Therefore … Lower Tailed Test

Section 6. 6 LARGE-SAMPLE TEST OF HYPOTHESIS ABOUT POPULATION PROPOTION
 value [usually about status")
Elements of Hypothesis Test Hypotheses a. Null Hypothesis: parameter (=) value [usually about status quo] b. Alternative Hypothesis: parameter (<, >, ≠) value [opposite of null hypothesis] Assumptions a. Random sample b. Sample statistic follows distribution used for test statistic [for mean – n >30] Test a. Calculate test statistic b. Find rejection region – specify alpha c. Does your test statistic fall in rejection region? OR a. Calculate test statistic b. Find p-value c. Is p-value < or > alpha Summary a. Write outcome of part (c) from Step 3. Be sure to state alpha. b. Write conclusion statement about parameter (population mean, population proportion, etc. ) in context of the problem (give context of parameter – height of 5 th graders, calories in hotdogs, SAT score of Clemson students, etc)
 For a LARGE Sample Hypotheses One Tailed Test")
Hypothesis Test for p (Population Proportion) For a LARGE Sample Hypotheses One Tailed Test Two-Tailed Test Where p 0 represents the value of the population proportion for the null hypothesis
 For a Large Sample Assumptions")
Hypothesis Test for p (Population Proportion) For a Large Sample Assumptions
 For a Large Sample Test Statistic Find Rejection")
Hypothesis Test for p (Population Proportion) For a Large Sample Test Statistic Find Rejection Region Non-rejection Region (1 -α) Rejection Region (α) p 0 z
 For a Large Sample Summary If test statistic")
Hypothesis Test for p (Population Proportion) For a Large Sample Summary If test statistic falls in rejection region At the ___% significance level, my test statistic (zobs = ___) falls in the rejection region (or p-value (______) is greater than alpha – whichever you did) therefore, I reject my null hypothesis. The data provides sufficient evidence that the population proportion of <context> is (greater than, less than or different from) <plug in actual value of p 0>. If test statistic does not fall in rejection region At the ___% significance level, my test statistic (zobs = ___) does not fall in the rejection region (or p-value (_____) is less than alpha – whichever you did) therefore, I do not reject my null hypothesis. The data provides insufficient evidence that the population proportion of <context> is (greater than, less than or different from) <plug in actual value of p 0>.

Example - In a sample of 286 adults selected randomly from one town, it is found that 24 of them have been exposed to a particular strain of the flu. At the 0. 01 significance level, test whether the proportion of all adults in the town that have been exposed to this strain of the flu differs from the nationwide percentage of 8%. Hypotheses: H 0: p =. 08 HA: p ≠. 08 Where p represents the Testing: Rejection Region: population proportion of people with this strain of flu Hypothesis For Proportion – Large Sample Summary: At the 1% significance level, my test statistic (zobs = 0. 249) does not fall in the rejection region therefore, I do not reject my null hypothesis. The data provides insufficient evidence that the population proportion of people with this strain of flu from this town is different from 8%. Test Statistic: Compare: Since 0. 249 does not fall in the rejection region do not reject H 0

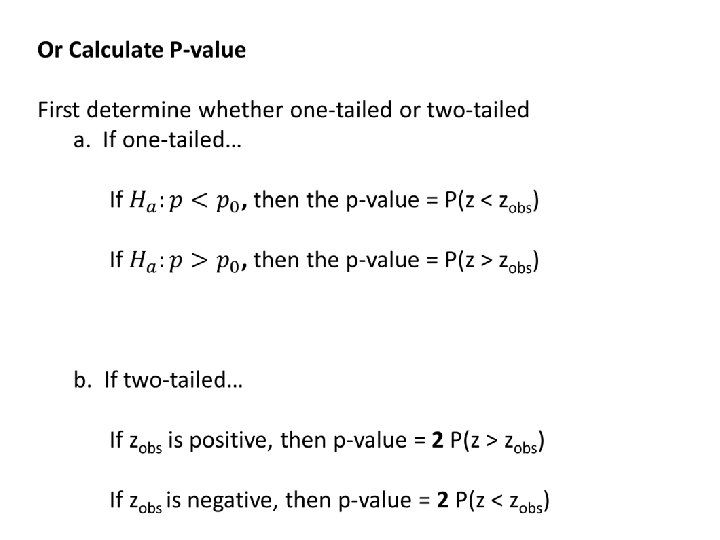
Example - A research group claims that less than 28% of students at one medical school plan to go into general practice. It is found that among a random sample of 120 of the school's students, 20% of them plan to go into general practice. At the 0. 10 significance level, do the data provide sufficient evidence to conclude that the percentage of all students at this school who plan to go into general practice is less than 28%? Hypotheses: H 0: p =. 28 HA: p <. 28 Where p represents the Testing: population proportion students at this school who plan to go into gen. practice Test Statistic: P-value: Hypothesis For Proportion – Large Sample Summary: At the 10% significance level, my p-value (. 0256) is less than α therefore, I reject my null hypothesis. The data provides sufficient evidence that the population proportion of students at this school who plan to go into general practice is less than 28%. Compare: Since p-value (. 0256) is < α (. 10) reject H 0
 Hypotheses One Tailed Test Two-Tailed Test Where μ")
Hypothesis Test for µ (Population Mean) Hypotheses One Tailed Test Two-Tailed Test Where μ 0 represents the value of the population mean for the null hypothesis
 Assumptions")
Hypothesis Test for µ (Population Mean) Assumptions
 Test Statistic Find Rejection Region (For example -")
Hypothesis Test for µ (Population Mean) Test Statistic Find Rejection Region (For example - for Nonupper-tailed test rejection Region (1 -α) Rejection Region (α) μ 0 X t
 Summary If test statistic falls in rejection region")
Hypothesis Test for µ (Population Mean) Summary If test statistic falls in rejection region At the ___% significance level, my test statistic (tobs = ___) falls in the rejection region (or p-value less than α – whichever you did) therefore, I reject my null hypothesis. The data provides sufficient evidence that the population mean <context> is (greater than, less than or different from) <plug in actual value of µ 0>. If test statistic does not fall in rejection region At the ___% significance level, my test statistic (tobs = ___) does not fall in the rejection region (or p-value greater than α – whichever you did) therefore, I do not reject my null hypothesis. The data provides insufficient evidence that the population mean <context> is (greater than, less than or different from) <plug in actual value of µ 0>.

Example - A manufacturer claims that the mean lifetime of its lithium batteries is 1200 hours. A homeowner randomly selects 25 of these batteries and finds the mean lifetime to be 1180 hours with a standard deviation of 80 hours. Assume the lifetime of lithium batteries is normally distributed. Test the manufacturer's claim. Use α = 0. 05. Where µ represents the Testing: Hypotheses: H 0: µ = 1200 population mean lifetime of Rejection Region: lithium batteries (from this HA: µ ≠ 1200 manufacturer) Hypothesis For Mean Summary: At the 5% significance level, my test statistic (tobs = = -1. 25) does not falls in the rejection region therefore, I do not reject my null hypothesis. The data provides insufficient evidence that the population mean lifetime of lithium batteries (from this manufacturer) is different from 1200 hours. Test Statistic: Compare: Since -1. 25 does not fall in the rejection region we do not Reject H 0

On DDXL • One Sample test for p – > 1 Var Prop test • One Sample test for µ -> 1 Var t test
")
Section 6. 8 TEST OF HYPOTHESIS ABOUT POPULATION VARIANCE (ST. DEV. )
 • Most inferences are about")
Test of Hypothesis about Population Variance (OR Standard Deviation) • Most inferences are about population mean or population proportion however, it is sometimes of interest to perform a test about the population variance σ2. • For example, in quality control (making sure production does not vary by a lot), prescription drugs (making sure the effect of the drug does not vary by a lot)
 In any hypothesis test we")
Test of Hypothesis about Population Variance (OR Standard Deviation) In any hypothesis test we calculate a test statistic (a value based on your sample that we use as evidence for or against the alternative hypothesis) and we have known the distribution of the test statistics from previous tests. Tests for mean: z -> standard normal t -> student’s t distribution Tests for proportion: z -> standard normal
 The test statistic for a")
Test of Hypothesis about Population Variance (OR Standard Deviation) The test statistic for a hypothesis test for population variance has a distribution known as chi-squared (χ2). Chi-square distribution is shaped like……

The upper-tail probability of this distribution is given in TABLE VI in the back of your book. This distribution depends on the number of degrees of freedom of your test statistic.
 For a LARGE Sample Hypotheses One Tailed Test")
Hypothesis Test for σ2 (Population Variance) For a LARGE Sample Hypotheses One Tailed Test Two-Tailed Test
 For a LARGE Sample Assumptions 1. A random")
Hypothesis Test for σ2 (Population Variance) For a LARGE Sample Assumptions 1. A random sample is selected from the target population 2. The population from which the sample is selected has a distribution that is approximately normal.
 For a LARGE Sample Test Statistic Where σ02")
Hypothesis Test for σ2 (Population Variance) For a LARGE Sample Test Statistic Where σ02 is the hypothesized variance, s 2 is the sample variance and the distribution of χ2 is based on (n-1)degrees of freedom

Find Rejection Region One -tailed Two -tailed AND

Examples: If HA: σ2 > # , n = 22, and α =. 05. Find the rejection region

Examples: If HA: σ2 < # , n = 25, and α =. 05. Find the rejection region

Examples: If HA: σ2 ≠ # , n = 18, and α =. 05. Find the rejection region

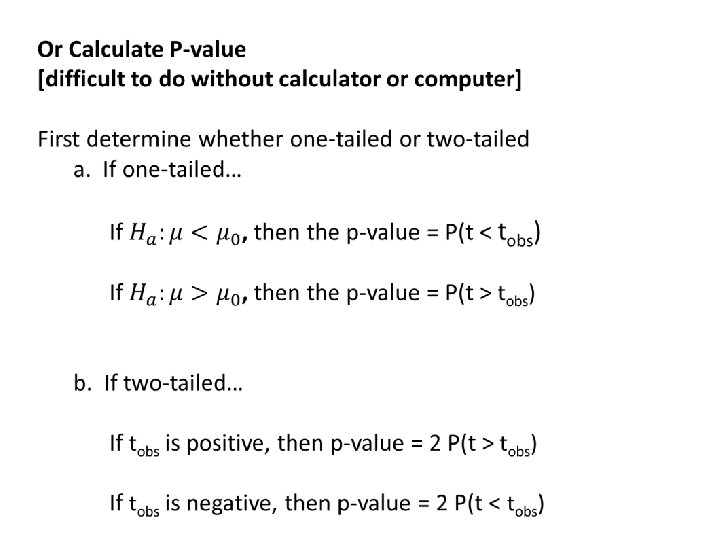
Or Calculate P-value Using Technology – DDXL
 For a LARGE Sample Summary If test statistic")
Hypothesis Test for σ2 (Population Variance) For a LARGE Sample Summary If test statistic falls in rejection region At the ___% significance level, my test statistic (χ2 = ___) falls in the rejection region (or my p-value (_____) < α) therefore, I reject my null hypothesis. The data provides sufficient evidence to support that the variance of all <context> is (greater than, less than or different from <plug in value for σ02 > If test statistic does not fall in rejection region At the ___% significance level, my test statistic (χ2 = ___) does not fall in the rejection region (or my p-value (______) > α) therefore, I do not reject my null hypothesis. The data provides insufficient evidence to support that the variance of all <context> is (greater than, less than or different from) <plug in value for σ02>.

Example - In one town, monthly incomes for men with college degrees are found to have a standard deviation of $650. A random sample of 22 men without college degrees resulted in incomes with a standard deviation of $933. Assume the monthly income for men is normally distributed. At the 1% level of significance, do the data provide sufficient evidence to conclude that the standard deviation, σ, of incomes of men in that town without college degrees is greater than $650? Use the critical-value approach. Hypotheses: H 0: σ2 = 422500 HA: σ2 > 422500 Where σ2 represents the population variance of incomes of men in that town without college degrees Assumptions: 1. Random Sample – stated in problem 2. Population is normally distributed – stated in problem Testing: Rejection Region: Test Statistic: Hypothesis For Variance – Large Sample Compare: Since 43. 267 falls in the rejection region we reject H 0

Example - With individual lines at the checkouts, a store manager finds that the standard deviation for the waiting times on Monday mornings is 5. 2 minutes. After switching to a single waiting line, he finds that for a random sample of 29 customers, the waiting times have a standard deviation of 4. 3 minutes. Assume that line waiting times on Monday are normally distribution. Use a 0. 05 significance level to test whether the standard deviation of the waiting times using a single line differs from 5. 2 minutes. Use the critical-value approach. Hypotheses: H 0: σ2 = 27. 04 HA: σ2 ≠ 27. 04 Where σ2 represents the population variance of waiting times on Monday mornings Assumptions: 1. Random Sample – stated in problem 2. Population is normally distributed – stated in problem Testing: Rejection Region: Test Statistic: Hypothesis For Variance – Large Sample Compare: Since 19. 146 does not fall in the rejection region do not reject H 0

Type of Data Target Parameter Conditions Test Statistic Qualitative p = Population proportion of Sucesses 1. Random Sample from Population 2. nq ≥ 15 & nq ≥ 15 Quantitative µ = Population mean 1. Random Sample from Population 2. Population Normally distributed or n ≥ 30 σ2 =Population Variance 1. Random Sample from the Population 2. Population Normally Distributed
- Slides: 56