
Chapter 5 Uncertainty and Consumer Behavior Topics to
Chapter 5 Uncertainty and Consumer Behavior
Topics to be Discussed l Describing Risk l Preferences Toward Risk l Reducing Risk © 2005 Pearson Education, Inc. Chapter 5 2
Introduction l Choice with certainty is reasonably straightforward. l How do we make choices when certain variables such as income and prices are uncertain (making choices with risk)? © 2005 Pearson Education, Inc. Chapter 5 3

Describing Risk l To measure risk we must know: 1. All of the possible outcomes. 2. The probability or likelihood that each outcome will occur (its probability). © 2005 Pearson Education, Inc. Chapter 5 4
Describing Risk l With an interpretation of probability must determine 2 measures to help describe and compare risky choices 1. 2. Expected value Variability © 2005 Pearson Education, Inc. Chapter 5 5
Describing Risk l Expected Value m The weighted average of the payoffs or values resulting from all possible outcomes. © 2005 Pearson Education, Inc. Chapter 5 6

Expected Value – An Example l Investment in offshore drilling exploration: l Two outcomes are possible m Success – the stock price increases from $30 to $40/share m Failure – the stock price falls from $30 to $20/share © 2005 Pearson Education, Inc. Chapter 5 7
Expected Value – An Example l Objective Probability m 100 explorations, 25 successes and 75 failures m Probability (Pr) of success = 1/4 and the probability of failure = 3/4 © 2005 Pearson Education, Inc. Chapter 5 8
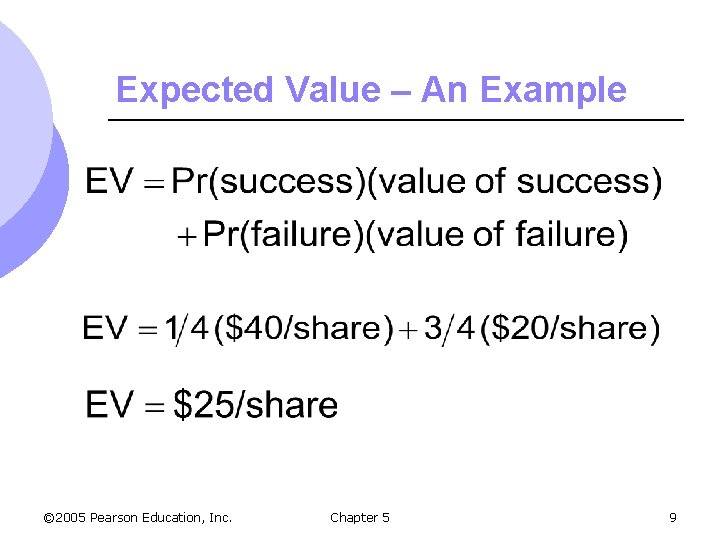
Expected Value – An Example © 2005 Pearson Education, Inc. Chapter 5 9
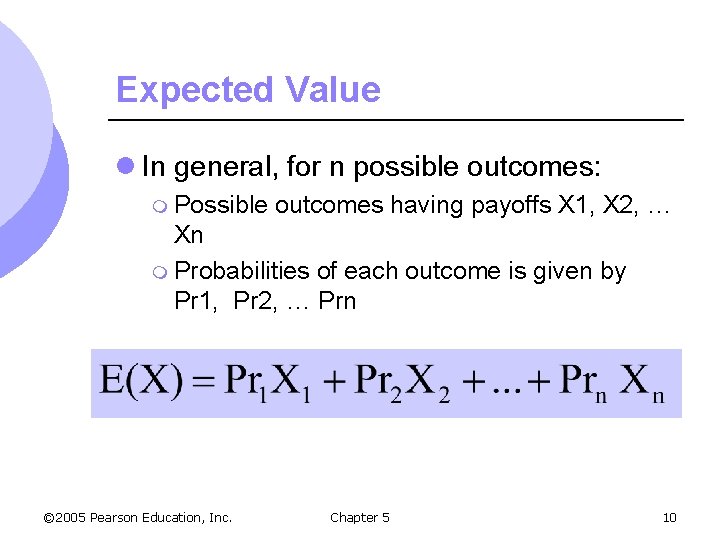
Expected Value l In general, for n possible outcomes: m Possible outcomes having payoffs X 1, X 2, … Xn m Probabilities of each outcome is given by Pr 1, Pr 2, … Prn © 2005 Pearson Education, Inc. Chapter 5 10
Describing Risk l Variability m The extent to which possible outcomes of an uncertain even may differ m How much variation exists in the possible choice © 2005 Pearson Education, Inc. Chapter 5 11
Variability – An Example l Suppose you are choosing between two part-time sales jobs that have the same expected income ($1, 500) l The first job is based entirely on commission. l The second is a salaried position. © 2005 Pearson Education, Inc. Chapter 5 12
Variability – An Example l There are two equally likely outcomes in the first job--$2, 000 for a good sales job and $1, 000 for a modestly successful one. l The second pays $1, 510 most of the time (. 99 probability), but you will earn $510 if the company goes out of business (. 01 probability). © 2005 Pearson Education, Inc. Chapter 5 13
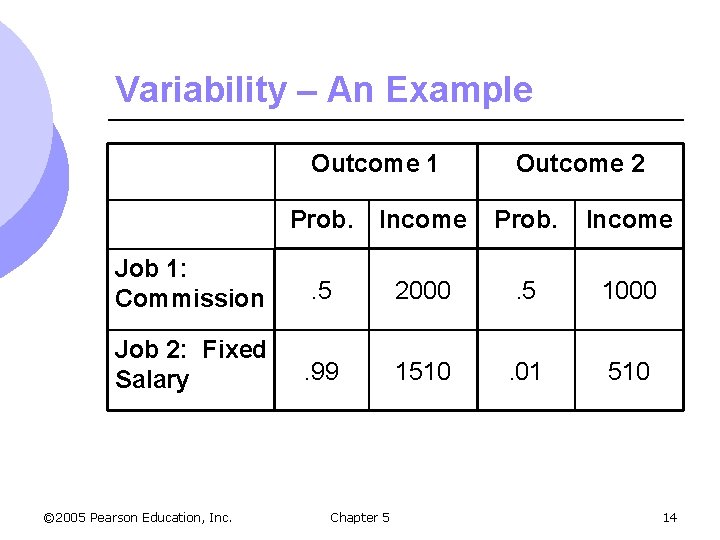
Variability – An Example Outcome 1 Outcome 2 Prob. Income Job 1: Commission . 5 2000 . 5 1000 Job 2: Fixed Salary . 99 1510 . 01 510 © 2005 Pearson Education, Inc. Chapter 5 14
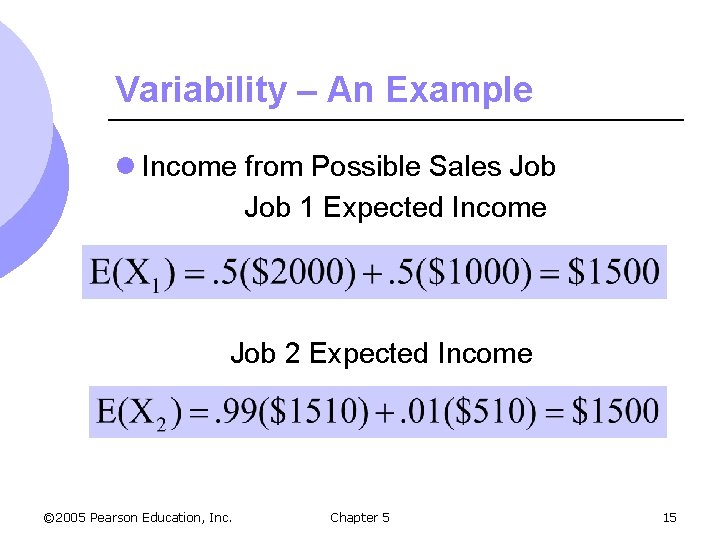
Variability – An Example l Income from Possible Sales Job 1 Expected Income Job 2 Expected Income © 2005 Pearson Education, Inc. Chapter 5 15
Variability l While the expected values are the same, the variability is not. l Greater variability from expected values signals greater risk. l Variability comes from deviations in payoffs m Difference between expected payoff and actual payoff © 2005 Pearson Education, Inc. Chapter 5 16
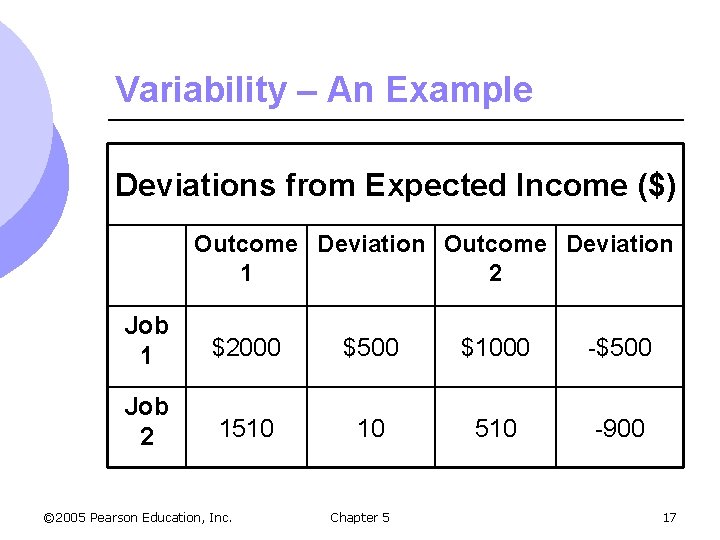
Variability – An Example Deviations from Expected Income ($) Outcome Deviation 1 2 Job 1 $2000 $500 $1000 -$500 Job 2 1510 10 510 -900 © 2005 Pearson Education, Inc. Chapter 5 17
Variability l Average deviations are always zero so we must adjust for negative numbers l We can measure variability with standard deviation m The square root of the average of the squares of the deviations of the payoffs associated with each outcome from their expected value. © 2005 Pearson Education, Inc. Chapter 5 18
Variability l Standard deviation is a measure of risk m Measures how variable your payoff will be m More variability means more risk m Individuals generally prefer less variability – less risk © 2005 Pearson Education, Inc. Chapter 5 19
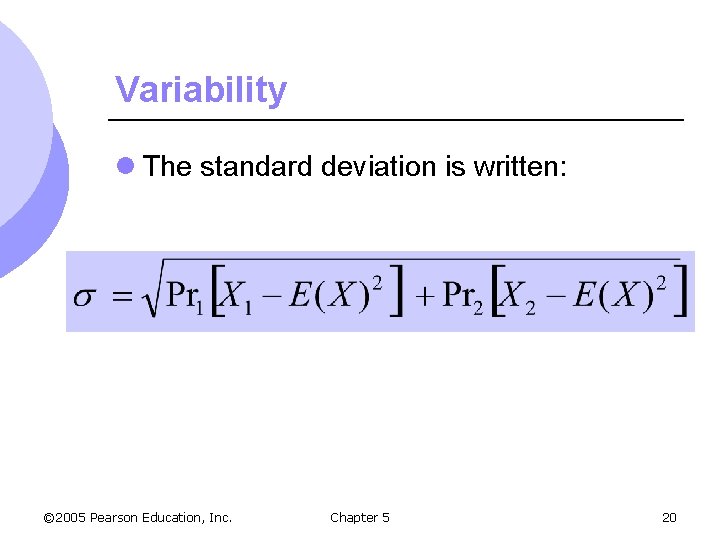
Variability l The standard deviation is written: © 2005 Pearson Education, Inc. Chapter 5 20
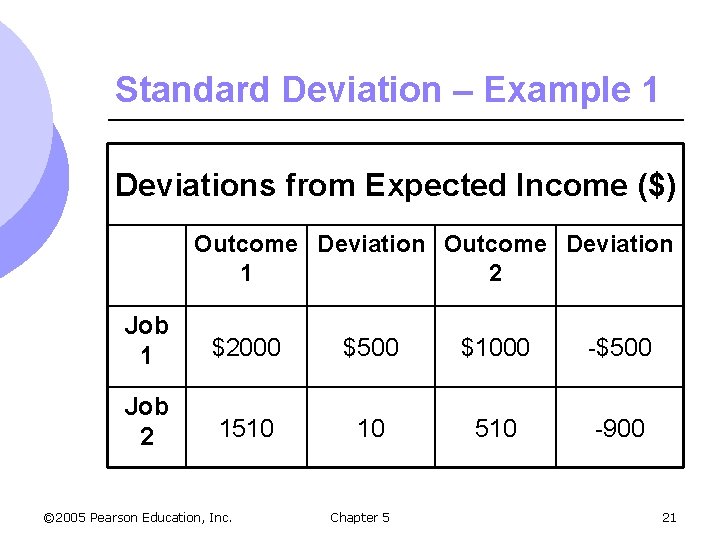
Standard Deviation – Example 1 Deviations from Expected Income ($) Outcome Deviation 1 2 Job 1 $2000 $500 $1000 -$500 Job 2 1510 10 510 -900 © 2005 Pearson Education, Inc. Chapter 5 21
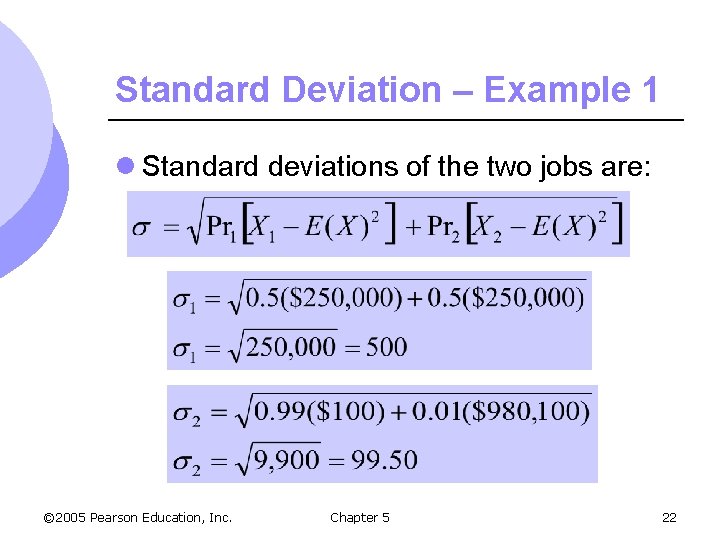
Standard Deviation – Example 1 l Standard deviations of the two jobs are: © 2005 Pearson Education, Inc. Chapter 5 22
Standard Deviation – Example 1 l Job 1 has a larger standard deviation and therefore it is the riskier alternative l The standard deviation also can be used when there are many outcomes instead of only two. © 2005 Pearson Education, Inc. Chapter 5 23
Standard Deviation – Example 2 l Job 1 is a job in which the income ranges from $1000 to $2000 in increments of $100 that are all equally likely. l Job 2 is a job in which the income ranges from $1300 to $1700 in increments of $100 that, also, are all equally likely. © 2005 Pearson Education, Inc. Chapter 5 24
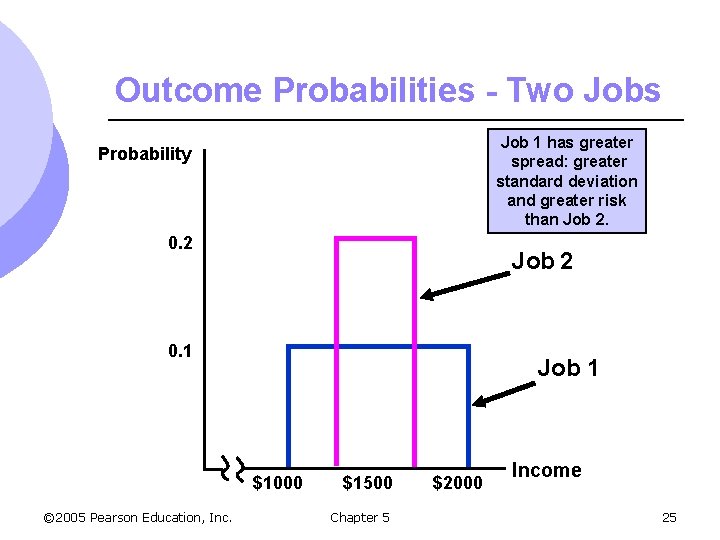
Outcome Probabilities - Two Jobs Job 1 has greater spread: greater standard deviation and greater risk than Job 2. Probability 0. 2 Job 2 0. 1 Job 1 $1000 © 2005 Pearson Education, Inc. $1500 Chapter 5 $2000 Income 25
Decision Making – Example 1 l What if the outcome probabilities of two jobs have unequal probability of outcomes m Job 1: greater spread & standard deviation m Peaked distribution: extreme payoffs are less likely that those in the middle of the distribution m You will choose job 2 again © 2005 Pearson Education, Inc. Chapter 5 26
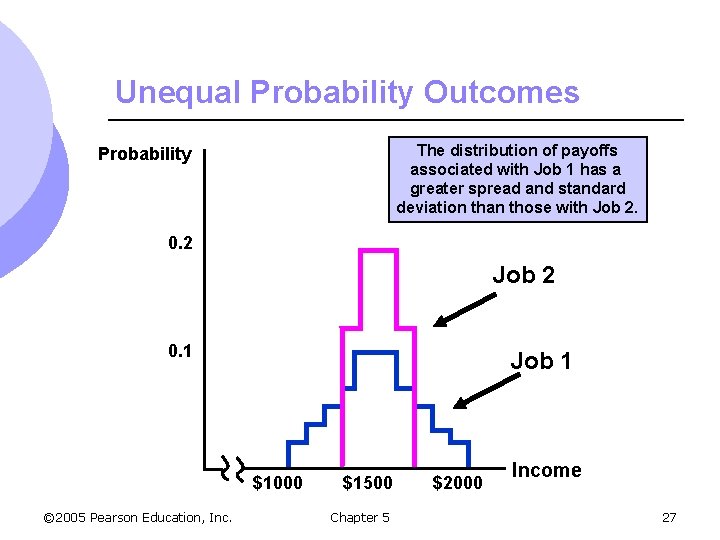
Unequal Probability Outcomes The distribution of payoffs associated with Job 1 has a greater spread and standard deviation than those with Job 2. Probability 0. 2 Job 2 0. 1 Job 1 $1000 © 2005 Pearson Education, Inc. $1500 Chapter 5 $2000 Income 27
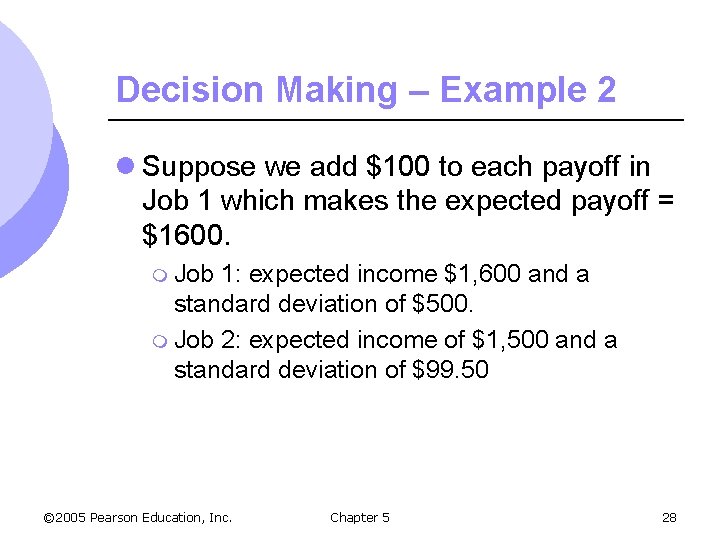
Decision Making – Example 2 l Suppose we add $100 to each payoff in Job 1 which makes the expected payoff = $1600. m Job 1: expected income $1, 600 and a standard deviation of $500. m Job 2: expected income of $1, 500 and a standard deviation of $99. 50 © 2005 Pearson Education, Inc. Chapter 5 28
Decision Making – Example 2 l Which job should be chosen? m Depends on the individual m Some may be willing to take risk with higher expected income m Some will prefer less risk even with lower expected income © 2005 Pearson Education, Inc. Chapter 5 29
Preferences Toward Risk l Can expand evaluation of risky alternative by considering utility that is obtained by risk m. A consumer gets utility from income m Payoff measured in terms of utility © 2005 Pearson Education, Inc. Chapter 5 30
Preferences Toward Risk Example l A person is earning $15, 000 and receiving 13. 5 units of utility from the job. l She is considering a new, but risky job. m 0. 50 chance of $30, 000 m 0. 50 chance of $10, 000 © 2005 Pearson Education, Inc. Chapter 5 31
Preferences Toward Risk Example l Utility at $30, 000 is 18 l Utility at $10, 000 is 10 l Must compare utility from the risky job with current utility of 13. 5 l To evaluate the new job, we must calculate the expected utility of the risky job © 2005 Pearson Education, Inc. Chapter 5 32
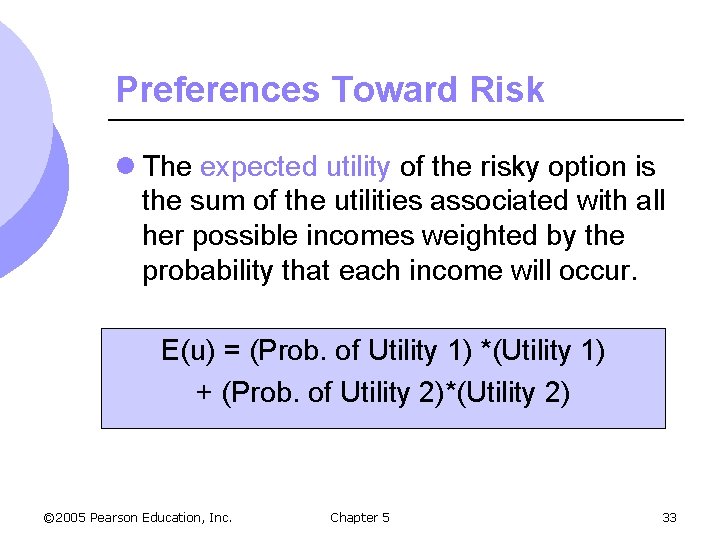
Preferences Toward Risk l The expected utility of the risky option is the sum of the utilities associated with all her possible incomes weighted by the probability that each income will occur. E(u) = (Prob. of Utility 1) *(Utility 1) + (Prob. of Utility 2)*(Utility 2) © 2005 Pearson Education, Inc. Chapter 5 33
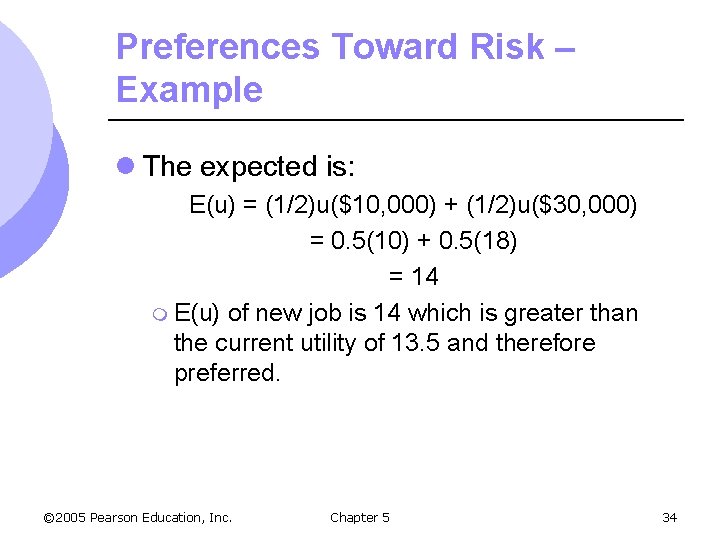
Preferences Toward Risk – Example l The expected is: E(u) = (1/2)u($10, 000) + (1/2)u($30, 000) = 0. 5(10) + 0. 5(18) = 14 m E(u) of new job is 14 which is greater than the current utility of 13. 5 and therefore preferred. © 2005 Pearson Education, Inc. Chapter 5 34
Preferences Toward Risk l People differ in their preference toward risk l People can be risk averse, risk neutral, or risk loving. © 2005 Pearson Education, Inc. Chapter 5 35
Preferences Toward Risk l Risk Averse m. A person who prefers a certain given income to a risky income with the same expected value. m The person has a diminishing marginal utility of income m Most common attitude towards risk l Ex: © 2005 Pearson Education, Inc. Market for insurance Chapter 5 36
Risk Averse - Example l A person can have a $20, 000 job with 100% probability and receive a utility level of 16. l The person could have a job with a 0. 5 chance of earning $30, 000 and a 0. 5 chance of earning $10, 000. © 2005 Pearson Education, Inc. Chapter 5 37
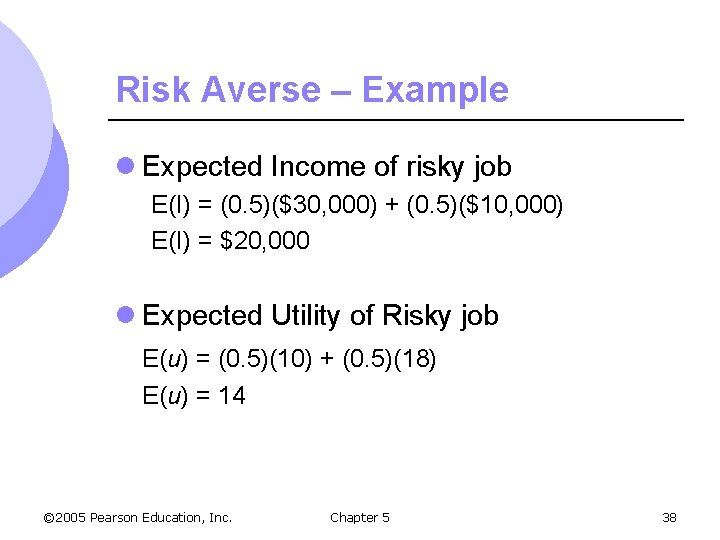
Risk Averse – Example l Expected Income of risky job E(I) = (0. 5)($30, 000) + (0. 5)($10, 000) E(I) = $20, 000 l Expected Utility of Risky job E(u) = (0. 5)(10) + (0. 5)(18) E(u) = 14 © 2005 Pearson Education, Inc. Chapter 5 38
Risk Averse – Example l Expected income from both jobs is the same – risk averse may choose current job l Expected utility is greater for certain job m Would keep certain job l Risk averse person’s losses (decreased utility) are more important than risky gains © 2005 Pearson Education, Inc. Chapter 5 39
Risk Averse l Can see risk averse choices graphically l Risky job has expected income = $20, 000 with expected utility = 14 m Point F l Certain job has expected income = $20, 000 with utility = 16 m Point © 2005 Pearson Education, Inc. D Chapter 5 40
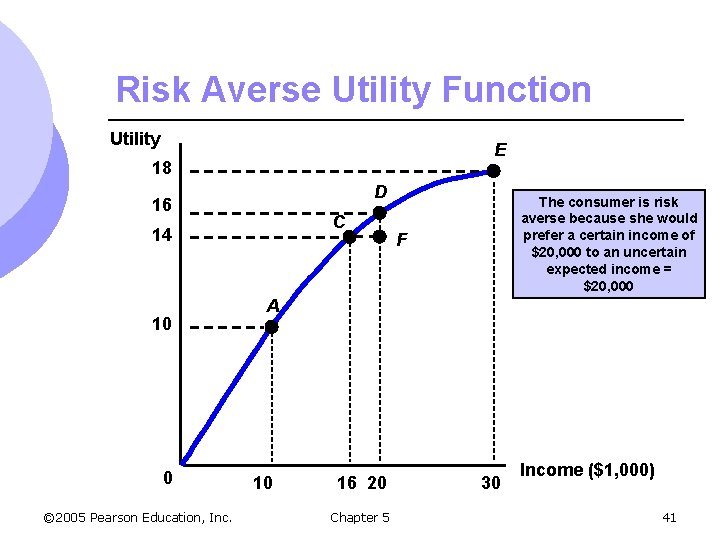
Risk Averse Utility Function Utility E 18 D 16 C 14 10 0 © 2005 Pearson Education, Inc. The consumer is risk averse because she would prefer a certain income of $20, 000 to an uncertain expected income = $20, 000 F A 10 16 20 Chapter 5 30 Income ($1, 000) 41
Preferences Toward Risk l A person is said to be risk neutral if they show no preference between a certain income, and an uncertain income with the same expected value. l Constant marginal utility of income © 2005 Pearson Education, Inc. Chapter 5 42
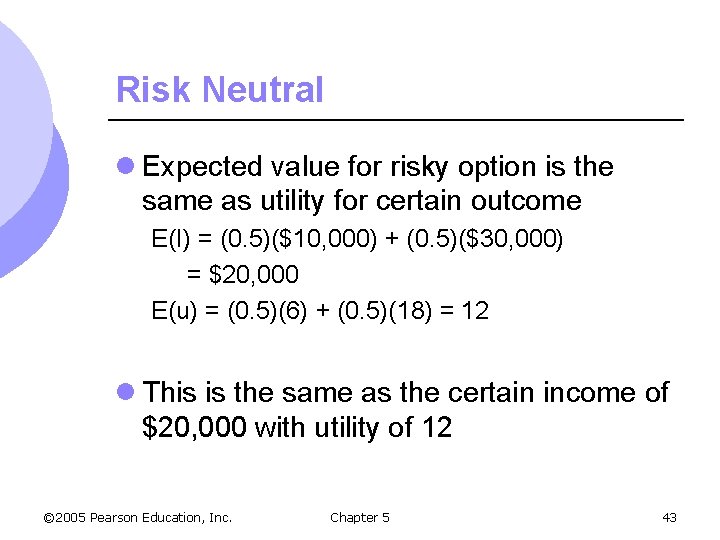
Risk Neutral l Expected value for risky option is the same as utility for certain outcome E(I) = (0. 5)($10, 000) + (0. 5)($30, 000) = $20, 000 E(u) = (0. 5)(6) + (0. 5)(18) = 12 l This is the same as the certain income of $20, 000 with utility of 12 © 2005 Pearson Education, Inc. Chapter 5 43
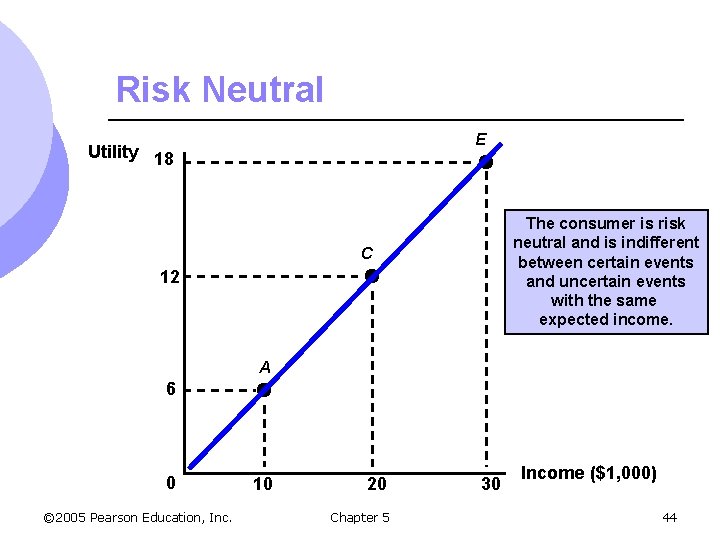
Risk Neutral E Utility 18 The consumer is risk neutral and is indifferent between certain events and uncertain events with the same expected income. C 12 A 6 0 © 2005 Pearson Education, Inc. 10 20 Chapter 5 30 Income ($1, 000) 44
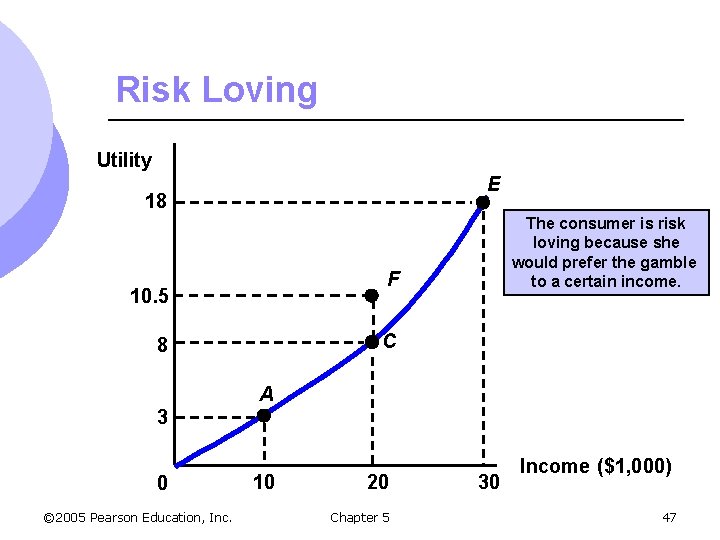
Preferences Toward Risk l A person is said to be risk loving if they show a preference toward an uncertain income over a certain income with the same expected value. m Examples: Gambling, some criminal activity l Increasing marginal utility of income © 2005 Pearson Education, Inc. Chapter 5 45
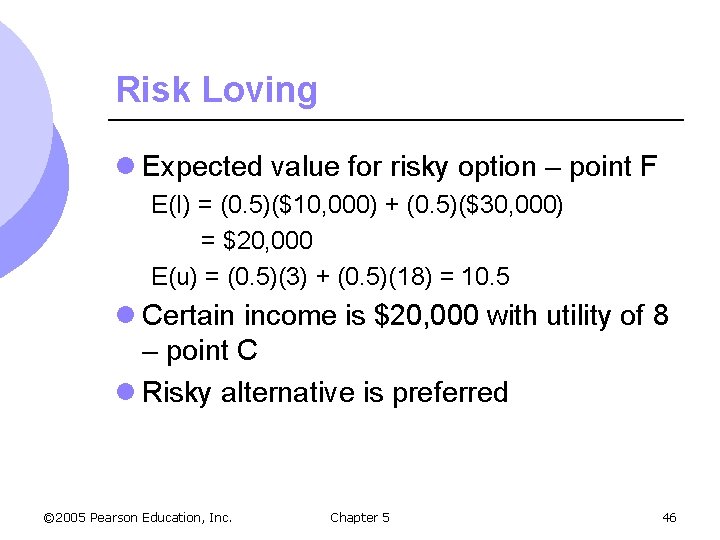
Risk Loving l Expected value for risky option – point F E(I) = (0. 5)($10, 000) + (0. 5)($30, 000) = $20, 000 E(u) = (0. 5)(3) + (0. 5)(18) = 10. 5 l Certain income is $20, 000 with utility of 8 – point C l Risky alternative is preferred © 2005 Pearson Education, Inc. Chapter 5 46
Risk Loving Utility E 18 The consumer is risk loving because she would prefer the gamble to a certain income. F 10. 5 C 8 A 3 0 © 2005 Pearson Education, Inc. 10 20 Chapter 5 30 Income ($1, 000) 47
Preferences Toward Risk l The risk premium is the maximum amount of money that a risk-averse person would pay to avoid taking a risk. l The risk premium depends on the risky alternatives the person faces. © 2005 Pearson Education, Inc. Chapter 5 48
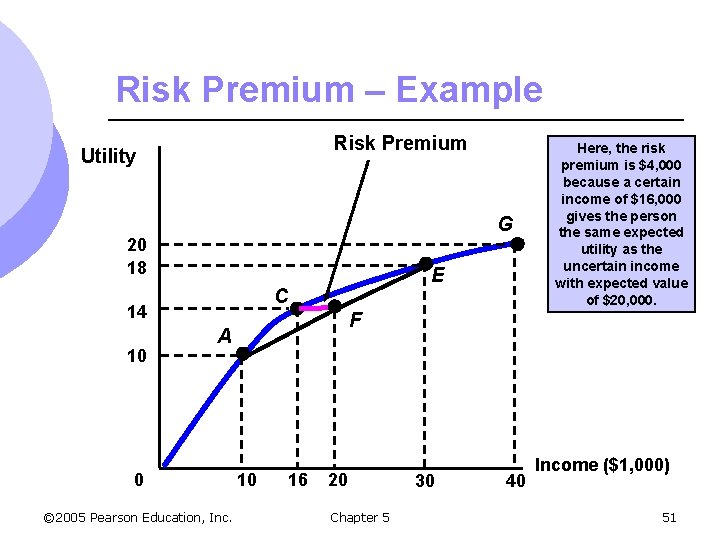
Risk Premium – Example l From the previous example m. A person has a. 5 probability of earning $30, 000 and a. 5 probability of earning $10, 000 m The expected income is $20, 000 with expected utility of 14. © 2005 Pearson Education, Inc. Chapter 5 49
Risk Premium – Example l Point F shows the risky scenario – the utility of 14 can also be obtained with certain income of $16, 000 l This person would be willing to pay up to $4000 (20 – 16) to avoid the risk of uncertain income. l Can show this graphically by drawing a straight line between the two points – line CF © 2005 Pearson Education, Inc. Chapter 5 50
Risk Premium – Example Risk Premium Utility G 20 18 C 14 10 E F A 0 © 2005 Pearson Education, Inc. Here, the risk premium is $4, 000 because a certain income of $16, 000 gives the person the same expected utility as the uncertain income with expected value of $20, 000. 10 16 20 Chapter 5 30 40 Income ($1, 000) 51
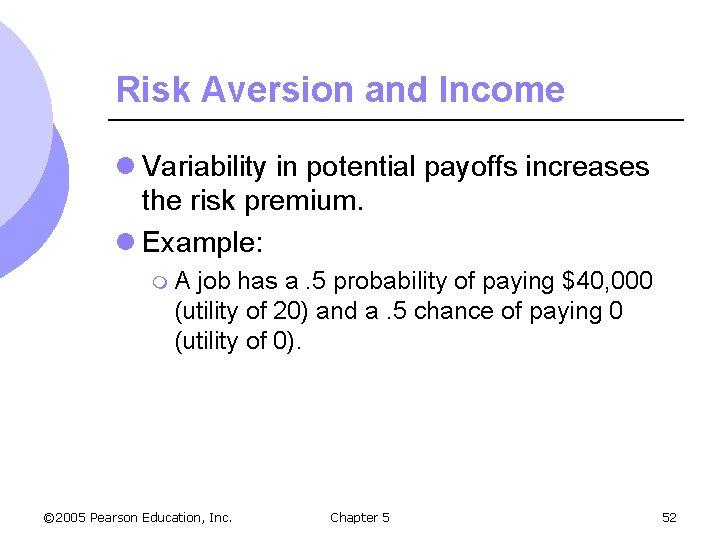
Risk Aversion and Income l Variability in potential payoffs increases the risk premium. l Example: m. A job has a. 5 probability of paying $40, 000 (utility of 20) and a. 5 chance of paying 0 (utility of 0). © 2005 Pearson Education, Inc. Chapter 5 52
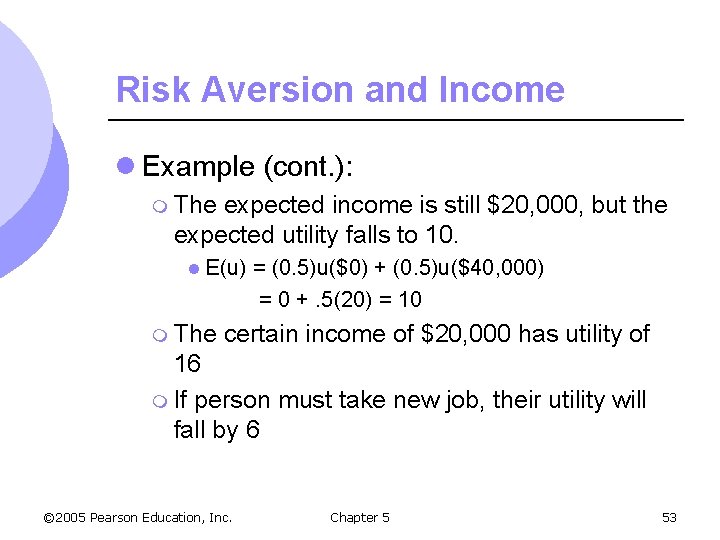
Risk Aversion and Income l Example (cont. ): m The expected income is still $20, 000, but the expected utility falls to 10. l E(u) m The = (0. 5)u($0) + (0. 5)u($40, 000) = 0 +. 5(20) = 10 certain income of $20, 000 has utility of 16 m If person must take new job, their utility will fall by 6 © 2005 Pearson Education, Inc. Chapter 5 53
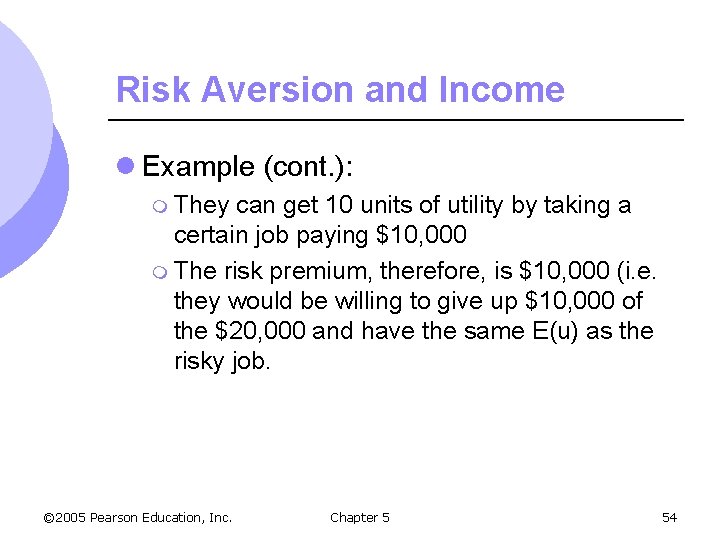
Risk Aversion and Income l Example (cont. ): m They can get 10 units of utility by taking a certain job paying $10, 000 m The risk premium, therefore, is $10, 000 (i. e. they would be willing to give up $10, 000 of the $20, 000 and have the same E(u) as the risky job. © 2005 Pearson Education, Inc. Chapter 5 54
Risk Aversion and Income l The greater the variability, the more the person would be willing to pay to avoid the risk and the larger the risk premium. © 2005 Pearson Education, Inc. Chapter 5 55
Reducing Risk l Consumers are generally risk averse and therefore want to reduce risk l Three ways consumers attempt to reduce risk are: 1. 2. 3. Diversification Insurance Obtaining more information © 2005 Pearson Education, Inc. Chapter 5 56
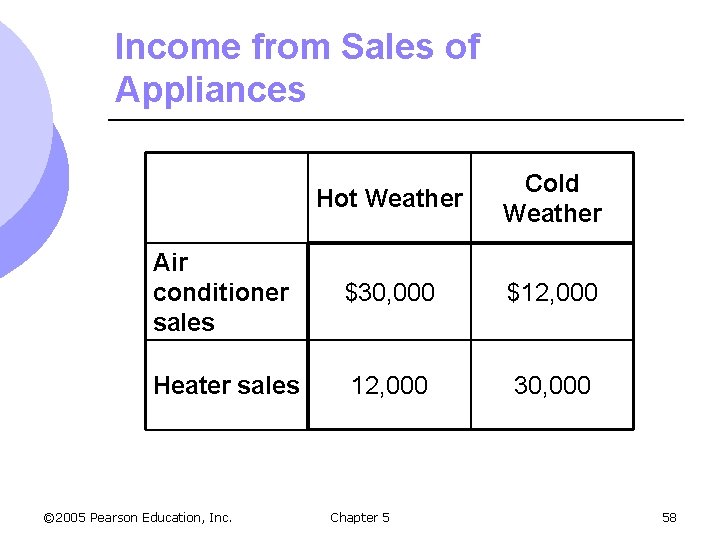
Reducing Risk l Diversification m Reducing risk by allocating resources to a variety of activities whose outcomes are not closely related. l Example: m Suppose a firm has a choice of selling air conditioners, heaters, or both. m The probability of it being hot or cold is 0. 5. m How does a firm decide what to sell? © 2005 Pearson Education, Inc. Chapter 5 57
Income from Sales of Appliances Hot Weather Cold Weather Air conditioner sales $30, 000 $12, 000 Heater sales 12, 000 30, 000 © 2005 Pearson Education, Inc. Chapter 5 58
Diversification – Example l If the firms sells only heaters or air conditioners their income will be either $12, 000 or $30, 000. l Their expected income would be: m 1/2($12, 000) © 2005 Pearson Education, Inc. + 1/2($30, 000) = $21, 000 Chapter 5 59
Diversification – Example l If the firm divides their time evenly between appliances their air conditioning and heating sales would be half their original values. l If it were hot, their expected income would be $15, 000 from air conditioners and $6, 000 from heaters, or $21, 000. l If it were cold, their expected income would be $6, 000 from air conditioners and $15, 000 from heaters, or $21, 000. © 2005 Pearson Education, Inc. Chapter 5 60
Diversification – Example l With diversification, expected income is $21, 000 with no risk. l Better off diversifying to minimize risk l Firms can reduce risk by diversifying among a variety of activities that are not closely related © 2005 Pearson Education, Inc. Chapter 5 61
Reducing Risk – The Stock Market l If invest all money in one stock, then take on a lot of risk m If that stock loses value, you lose all your investment value l Can spread risk out by investing in may different stocks or investments m Ex: Mutual funds © 2005 Pearson Education, Inc. Chapter 5 62
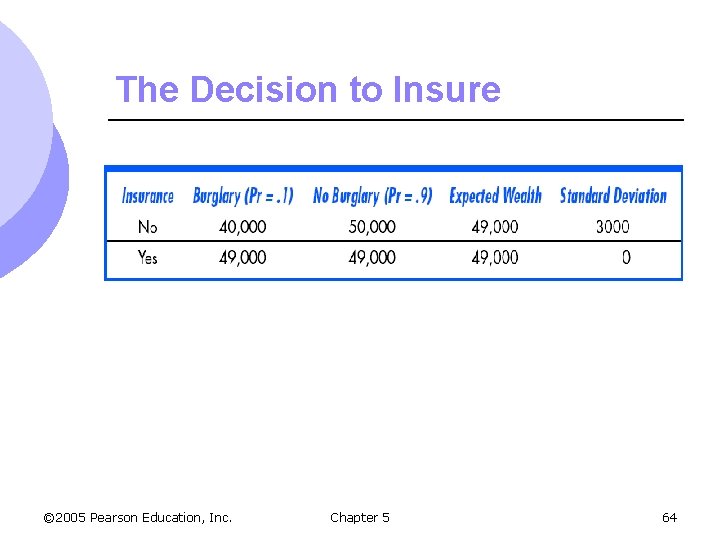
Reducing Risk – Insurance l Risk averse are willing to pay to avoid risk. l If the cost of insurance equals the expected loss, risk averse people will buy enough insurance to recover fully from a potential financial loss. © 2005 Pearson Education, Inc. Chapter 5 63
The Decision to Insure © 2005 Pearson Education, Inc. Chapter 5 64
Reducing Risk – Insurance l For risk averse consumer, guarantee of same income regardless of outcome has higher utility than facing the probability of risk. l Expected utility with insurance is higher than without © 2005 Pearson Education, Inc. Chapter 5 65
- Slides: 65