Chapter 5 The Normal Curve Sample and Population


- Slides: 32
Chapter 5 The Normal Curve Sample and Population
Inferential Statistics Allow us to draw conclusions about theoretical principles that go beyond the group of participants in a particular study
Normal Curve Characteristics: Normal Distribution Histogram/frequency distribution: Unimodal, symmetrical, bell-shaped Most cases near the center Fewer at the extremes A mathematical distribution Researchers compare the distributions of their variables to see if they approximately follow the normal curve A THEORICAL DISTRIBUTION Precisely Mathematically defined by a formula with MEAN & SD Z- scores (µ = 0 and SD =1)
Why Normal Curve Is Commonly Found in Nature A person’s ratings on a variable or performance on a task is influenced by a number of random factors at each point in time. These factors can make a person rate things like stress levels or mood as higher or lower than they actually are, or can make a person perform better or worse than they usually would. Most of these positive and negative influences on performance or ratings cancel each other out. Most scores will fall toward the middle, with few very low scores and few very high scores. This results in an approximately normal distribution (unimodal, symmetrical, and bell-shaped).
The Central Limit Theorem Each actual case influenced by many things each is essentially random. Combination of random events likely to be a middle score. When not a middle score, equal chances of an imbalance of the random influences being in either direction. Each case representing a combination of random influence producing a normal-shaped curve
Normal Curve & Z scores Normal curve an exactly defined distribution If distribution normal An exact relation between z-scores and % of cases above and below it If z-score is known Can determine % of cases above or below z-score Why? Normal curve is symmetrical around Mean
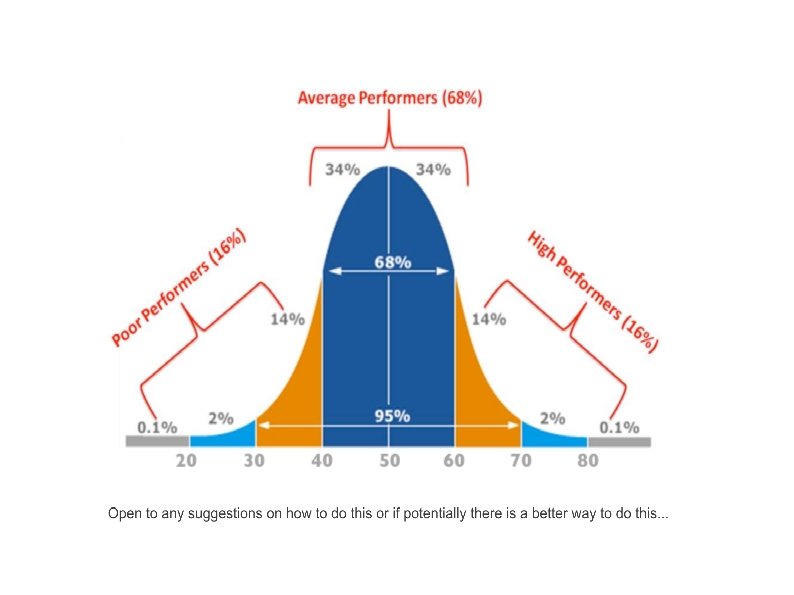
The area under a normal curve 50% 34% 14% 2%
Normal Curve & Curve Percentages
If a person has a z-score of 0: 50% of the cases fall above and 50% fall below that person.
If a person has a z-score of 1 34% of people have z-scores between that person and the mean 84% of people fall below that person 50 from the negative side + 34 from positive = 50+34 = 84% 16% of the people fall above the person 50% of cases above the mean = 50 -34 = 16
If a person has a z-score of -1 34% of people have z-scores between that person & the mean. 16% of cases fall below that person: 50% -34% = 16% 84% of the people are above that person: 50+34 = 84%
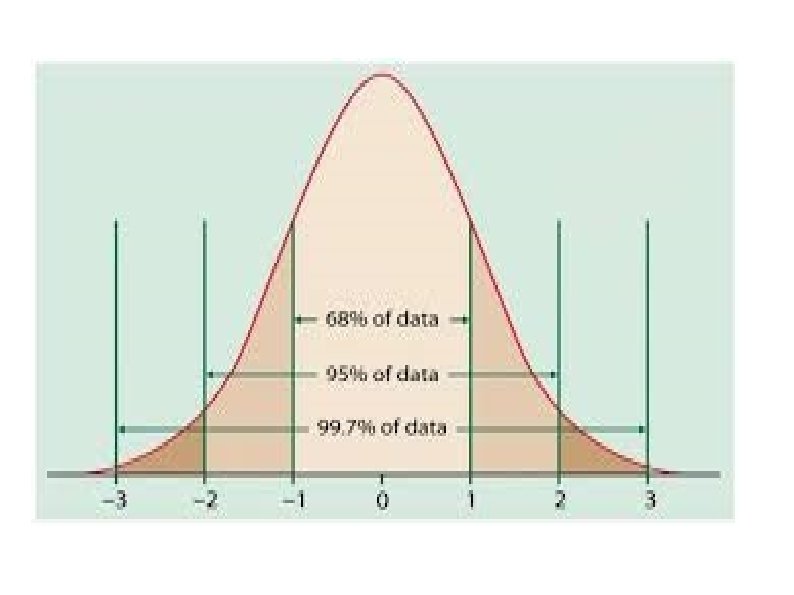
68% of the people have z-scores between +1 and -1 Approximately 14% of cases fall between 1 and 2 σs
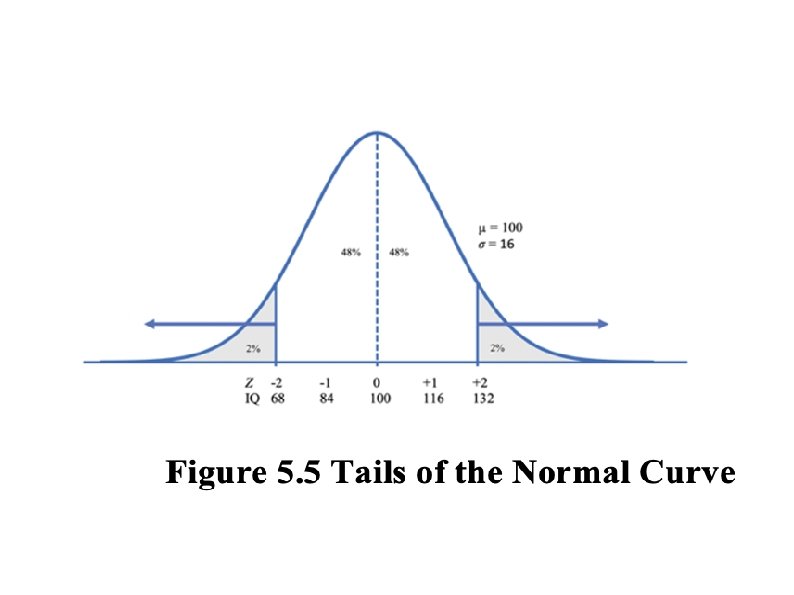
If a person has a z-score of +2 14% of people have z-scores between 1 σ and 2 σs 98% of cases are below that person: 14%+34%+50% This person is in the top 2% of the cases -
If a person has a z-score of -2: 14% of people have z-scores between that person and someone only 1 σ below the mean 2% of the cases are below that person (34+14 -50) 98% of the cases are above that person. 96% of the people have a scores between +2 and -2
More examples: If a person has 50% above, what is the person’s z-score? If a person has 2% below him, what is the person’s z-score? If a person has 16% above him, what is the person’s z-score? What % of people fall between the mean and a z-score of +2? What % of people fall between a z-score of +1 and a z-score of 0? What percentage of people fall between a z-score of +1 and a zscore of -2?
Using normal curve tables
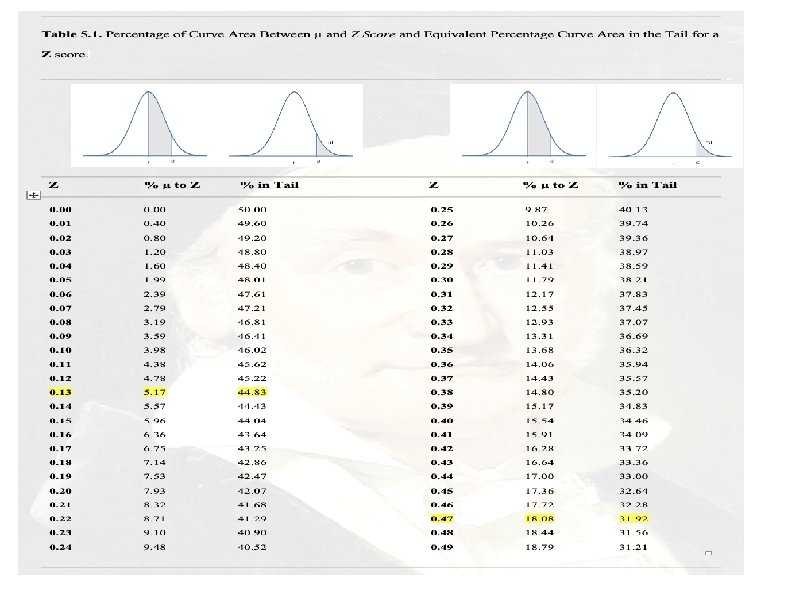
The Normal Curve Table and Z Scores A normal curve table shows the percentages of scores associated with the normal curve. The first column of this table lists the Z score The second column is labeled “% Mean to Z” and gives the percentage of scores between the mean and that Z score. The third column is labeled “% in Tail. ” . Z % Mean to Z % in Tail . 09 3. 59 46. 41 . 10 3. 98 46. 02 . 11 4. 38 45. 62
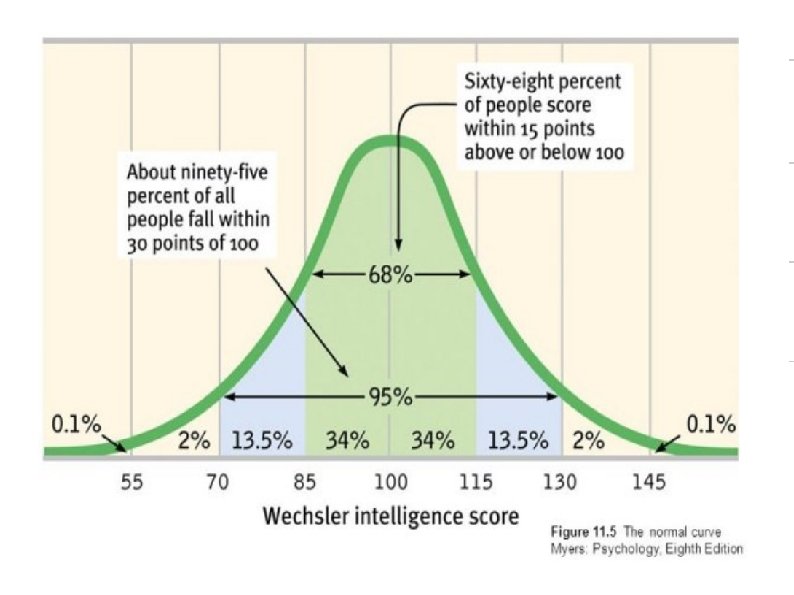
IQ Information µ = 100 σ = 16
If a person has an IQ of 125, what % of people have higher IQs? 1. Compute z-score of 125: Z = 1. 56 2. Z = 1. 56 = 44. 06% of Curve (From TABLE!!) 3. 50 - 44. 06 = 5. 94% 4. Answer: 5. 94% have higher Scores
What IQ score would a person need to be in top 5%? 1. There is 50% 2. Top is 5% 3. 50 -5 = 45% 4. ~44. 95 : Z = 1. 64 (From Table!) Raw Score Formula: X = (Z)(σ)+ µ --> (1. 64)(16)+100: IQ = 126
If Jane was in the top 10% of her 9 th Grade Students, on a creativity test, what is Jane’s z-score? 1. There are 50% above the mean: 50% - 10% = 40% 2. She is above 40% 3. Look up 40% in table to determine z-score 4. 40% in table ~ 39. 97: Z = 1. 28
With an IQ of 95, what is % of people with IQ lower than this person? 1. Find z-score: 95 -100/16 = -. 31 2. From Table: -. 31 = 12. 17% 3. 50% - 12. 17% = 37. 83%
What IQ would be in the Lowest 2. 5%? 50 -2. 5 = 47. 5 % -----> Z = -1. 96 X = (Z)(σ)+ µ ---> (-1. 96)(16)+100 = 68. 64
The 68 -95 -99. 7 Rule 9/7/04 Lecture 5 28