Chapter 5 The Behavior of Interest Rates Copyright

Chapter 5 The Behavior of Interest Rates Copyright © 2010 Pearson Education. All rights reserved.
 and Demand(需 求) for Bonds • At lower prices (higher interest rates), ceteris")
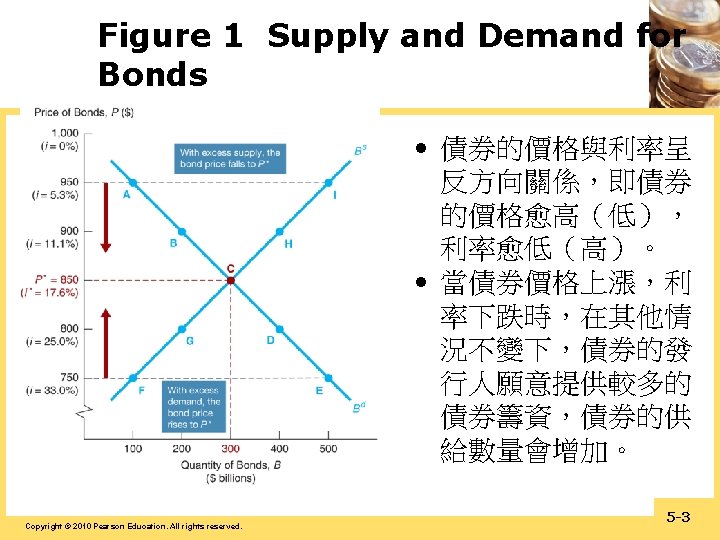
Supply(供給) and Demand(需 求) for Bonds • At lower prices (higher interest rates), ceteris paribus(其他一切不變), the quantity demanded of bonds is higher: an inverse relationship • At lower prices (higher interest rates), ceteris paribus, the quantity supplied of bonds is lower: a positive relationship Copyright © 2010 Pearson Education. All rights reserved. 5 -2
 Terminology 購買債券實際上等 於對債券發行人貸 款,因此「對債券 的需求」便等於「 對貸款的供給」, 因而可稱為「可貸 資金的供給」。 1. Demand for bonds")
Loanable Funds(可貸資金) Terminology 購買債券實際上等 於對債券發行人貸 款,因此「對債券 的需求」便等於「 對貸款的供給」, 因而可稱為「可貸 資金的供給」。 1. Demand for bonds = supply of loanable funds 2. Supply of bonds = demand for loanable funds Copyright © 2010 Pearson Education. All rights reserved. 5 -4
 • Occurs when the amount that people are willing to buy (demand)")
Market Equilibrium(市場均衡) • Occurs when the amount that people are willing to buy (demand) equals the amount that people are willing to sell (supply) at a given price • Bd = Bs defines the equilibrium (or market clearing) price and interest rate. • When Bd > Bs , there is excess demand(超額 需求), price will rise and interest rate will fall • When Bd < Bs , there is excess supply(超額供 給), price will fall and interest rate will rise Copyright © 2010 Pearson Education. All rights reserved. 5 -5
 Holding all other factors constant(當其他一切因素不變時 ): 1. The quantity")
Theory of Asset Demand (資產需求理論) Holding all other factors constant(當其他一切因素不變時 ): 1. The quantity demanded of an asset is positively related to wealth(財富) 2. The quantity demanded of an asset is positively related to its expected return(預期報酬) relative to alternative assets 3. The quantity demanded of an asset is negatively related to the risk (風險) of its returns relative to alternative assets 4. The quantity demanded of an asset is positively related to its liquidity(流動性) relative to alternative assets Copyright © 2010 Pearson Education. All rights reserved. 5 -6

Summary Table 1 Response of the Quantity of an Asset Demanded to Changes in Wealth, Expected Returns, Risk, and Liquidity Copyright © 2010 Pearson Education. All rights reserved. 5 -7
 (end of period) 年 銀行業利率 Central")
借貸市場均衡價格 民 國 14 Rates by banks (期底) (end of period) 年 銀行業利率 Central bank rates 重貼現 月 率 擔保放款 股票市 外匯市場 支票存款 退票 17 場 股價指 期底銀行 張數比 金融業 年回轉次 短期票券 債券市場 數 間 率 拆款市 市場 場 (民國 收盤美元 (次) (新台幣 Interba Short55年 Bond 元) nk term =100 call bills market loan market ) market Interest rates (percent per annum) 利率(年息百分比率) 中央銀行利率 資料來源:中央銀行金融統計月報 (end of period) 一個月 期 基準 15 一年期 存款牌 告 利率 隔夜拆款 加 商業本票 十年期中央 Stock 16 存款牌 告 放款利 權平均利 31 -90天期 政府公債 率 率 collateral 95 96 750 375 97 000 98 250 99 625 100 875 101 875 102 103 875 2. 3. 2. 1. 1. 1. 125 750 375 625 000 250 250 rates market 3. 71 3. 09 2. 91 1. 20 2. 62 0. 42 2. 115 2. 313 1. 205 4. 552 4. 998 4. 014 1. 1. 54 1. 1. 90 2. 1. 92 1. 47 2. 67 2. 88 0. 89 0. 13 0. 36 0. 563 1. 676 1. 882 2. 109 2. 185 2. 341 0. 0. 24 0. 0. 38 0. 0. 70 2. 88 0. 36 1. 883 1. 882 1. 883 2. 428 2. 386 2. 387 0. 0. 79 0. 0. 62 2. Education. 0. 1. 2. reserved. 0. Copyright © 1. 2010 Pearson All rights 625 000 74 21 829 353 0. 58 104 r price closing rate of 外匯存底 本國銀 消費者 (百萬美 行19 物價指 元) 逾放比率 數 年增率 Balance of payments (US million) 經常帳 準備資產 變動 資本帳與金融帳 Interba Dishon Annual Current account nk ored check ratio in turnove Discou Weighte 次級市場利 利率 Interest index spot numbe 率 率 nt d r r in exchang 1 average 31 -90 10 -year rate on 1 -year Base checkin (%) month s of days gov't e g (196 account accommo overnigh CP rates bond deposit lending rate dations t in rates in 6 s (NT with rates interest secondary=100) $/US$) 融通利率 國際收支(百萬美元)18 balance Non. Changes Foreign performi Annual in ng exchang reserve loan growth e Capital and financial account balance 商品貿 易 直接投 資 證券投 資 assets reserves ratio of rate of Trade Direct Portfoli o (US domesti consu million) c mer balance invest ment banks prices market 1. 98 842 2. 32 510 2. 29 024 1. 51 460 1. 37 950 1. 38 156 1. 21 481 1. 46 093 1. 60 1. 39 992 959 6, 3 32. 5 960 23. 6 0. 49 8, 32. 4 3 430 16. 1 0. 43 7, 3 32. 8 600 24. 6 0. 38 6, 2 32. 0 300 53. 8 0. 30 7, 30. 3 2 680 39. 4 0. 19 8, 2 30. 2 900 40. 0 0. 17 7, 2 29. 1 360 41. 7 0. 18 8, 29. 9 2 500 35. 3 0. 17 8, 2 31. 7 180 31. 8 0. 17 8, 2 33. 0 660 49. 2 0. 18 24, 892 33, 762 072 26, 367 359 22, 19, 719 29, 39, 028 17, 1, 975 25 18, 965 3, 338 40, 062 4, 855 12, 250 020 26, 274 41, 582 38, 442 102 39, 908 545 29, 13, 392 3, 072 10, 327 25, 455 9, 082 20, 664 26, 32, 146 14, 723 35, 691 54, 126 40, 173 6, 239 49, 916 55, 309 452 65, 417 532 29, 31, 737 9, 930 42, 091 35, 43, 909 10, 687 28, 834 41, 52, 856 9, 872 44, 224 15, 484 11, 318 13, 015 976 933 015 -- -- -- 6, 086 -- 266, 148 2. 13 4, 270, 311 1. 84 291, 707 1. 54 348, 1. 15 382, 005 0. 61 385, 547 0. 43 198 403, 0. 40 416, 811 0. 38 418, 980 0. 25 169 5 -9 426, 031 0. 23 0. 60 1. 80 3. 52 0. 86 0. 96 1. 42 1. 93 0. 79 1. 20 0. 31
: in an expansion with growing wealth,")
Shifts in the Demand for Bonds • Wealth(財富): in an expansion with growing wealth, the demand curve for bonds shifts to the right • Expected Returns(預期報酬): higher expected interest rates in the future lower the expected return for longterm bonds, shifting the demand curve to the left • Expected Inflation(預期通貨膨脹): an increase in the expected rate of inflations lowers the expected return for bonds, causing the demand curve to shift to the left • Risk(風險): an increase in the riskiness of bonds causes the demand curve to shift to the left • Liquidity(流動性): increased liquidity of bonds results in the demand curve shifting right Copyright © 2010 Pearson Education. All rights reserved. 5 -10
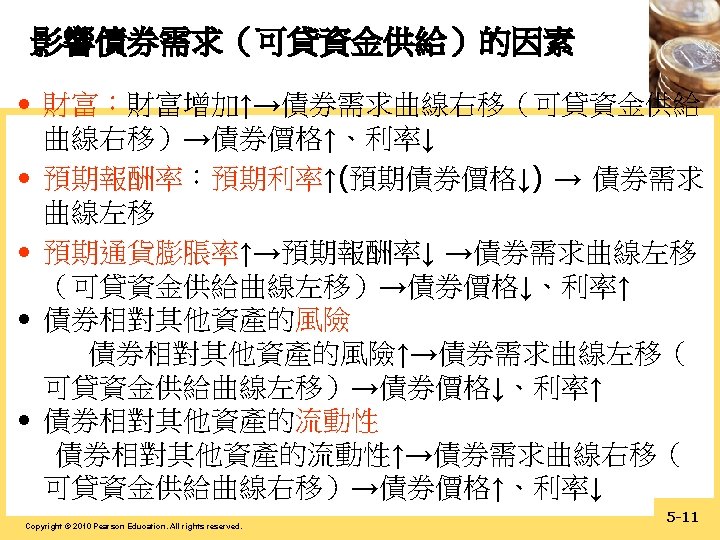

Figure 2 Shift in the Demand Curve for Bonds Copyright © 2010 Pearson Education. All rights reserved. 5 -12

Summary Table 2 Factors That Shift the Demand Curve for Bonds Copyright © 2010 Pearson Education. All rights reserved. 5 -13
: in an")
Shifts in the Supply of Bonds • Expected profitability of investment opportunities(投資機會的預期獲利): in an expansion, the supply curve shifts to the right • Expected inflation(預期通貨膨脹): an increase in expected inflation shifts the supply curve for bonds to the right • Government budget(政府預算): increased budget deficits shift the supply curve to the right Copyright © 2010 Pearson Education. All rights reserved. 5 -14
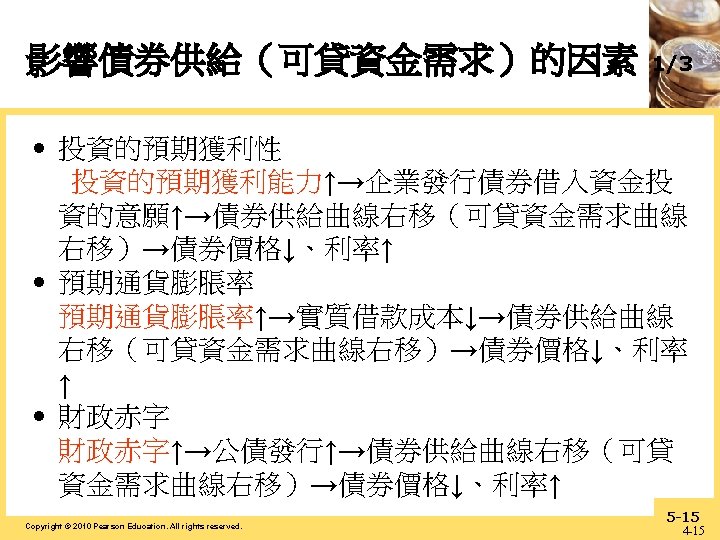

FIGURE 3 Shift in the Supply Curve for Bonds Copyright © 2010 Pearson Education. All rights reserved. 5 -16

Summary Table 3 Factors That Shift the Supply of Bonds Copyright © 2010 Pearson Education. All rights reserved. 5 -17

FIGURE 4 Response to a Change in Expected Inflation Copyright © 2010 Pearson Education. All rights reserved. 5 -18
, 1953 – 2011 Source:")
Figure 5 Expected Inflation and Interest Rates (Three-Month Treasury Bills), 1953 – 2011 Source: Expected inflation calculated using procedures outlined in Frederic S. Mishkin, “The Real Interest Rate: An Empirical Investigation, ” Carnegie-Rochester Conference Series on Public Policy 15 (1981): 151– 200. These procedures involve estimating expected inflation as a function of past interest rates, inflation, and time trends. Copyright © 2010 Pearson Education. All rights reserved. 5 -19

Figure 6 Response to a Business Cycle Expansion Copyright © 2010 Pearson Education. All rights reserved. 5 -20
, 1951– 2014 Source: Federal")
Figure 7 Business Cycle and Interest Rates (Three-Month Treasury Bills), 1951– 2014 Source: Federal Reserve Bank of St. Louis FRE D database: http: //research. stlouisfed. org/fred 2 Copyright © 2010 Pearson Education. All rights reserved. 5 -21
 Copyright")
Supply and Demand in the Market for Money: The Liquidity Preference Framework (流動性偏好架構) Copyright © 2010 Pearson Education. All rights reserved. 5 -22
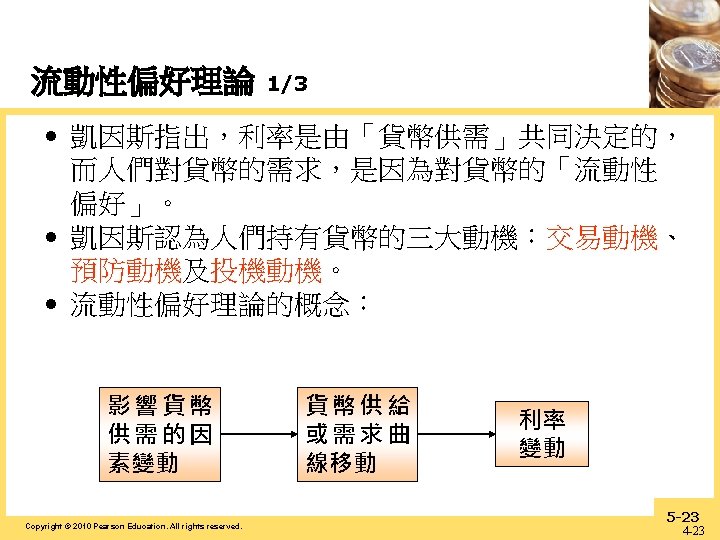
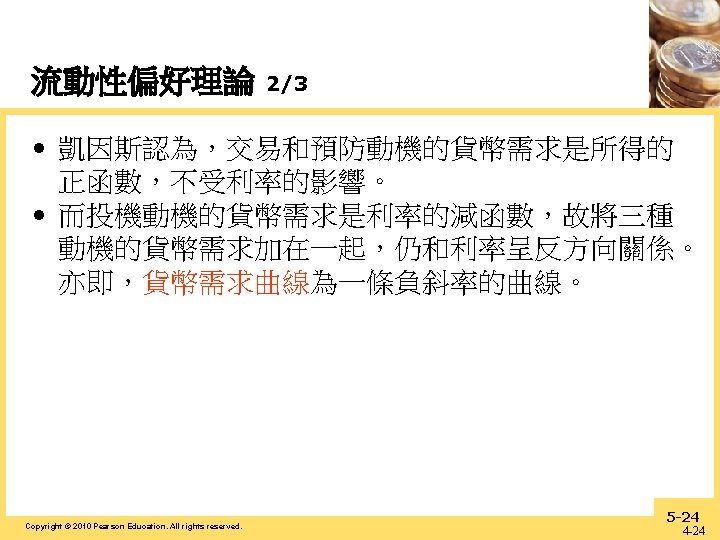

Demand for Money in the Liquidity Preference Framework • As the interest rate increases: – The opportunity cost of holding money(持有貨幣的 機會成本) increases… – The relative expected return of money(貨幣的預期 報酬) decreases… • …and therefore the quantity demanded of money decreases. Copyright © 2010 Pearson Education. All rights reserved. 5 -25

Figure 8 Equilibrium in the Market for Money 貨幣供給主要係由中央銀行所決 定,不受利率高低所影響,故貨 幣供給曲線是一條垂直線。 Copyright © 2010 Pearson Education. All rights reserved. 5 -26
 • Shifts in")
Changes in Equilibrium Interest Rates in the Liquidity Preference Framework(流動性 偏好理論) • Shifts in the demand for money: • Income Effect(所得效果): a higher level of income causes the demand for money at each interest rate to increase and the demand curve to shift to the right • Price-Level Effect(價格水準效果): a rise in the price level causes the demand for money at each interest rate to increase and the demand curve to shift to the right Copyright © 2010 Pearson Education. All rights reserved. 5 -27

Shifts in the Supply of Money • Assume that the supply of money is controlled by the central bank(中央銀行) • An increase in the money supply engineered by the Federal Reserve will shift the supply curve for money to the right Copyright © 2010 Pearson Education. All rights reserved. 5 -28

Figure 9 Response to a Change in Income or the Price Level Copyright © 2010 Pearson Education. All rights reserved. 5 -29

Figure 10 Response to a Change in the Money Supply Copyright © 2010 Pearson Education. All rights reserved. 5 -30

Summary Table 4 Factors That Shift the Demand for and Supply of Money Copyright © 2010 Pearson Education. All rights reserved. 5 -31
 and Expected-Inflation Effect(預期通膨效果 • A one time increase in the money")
Price-Level Effect (價格效果) and Expected-Inflation Effect(預期通膨效果 • A one time increase in the money supply will cause prices to rise to a permanently higher level by the end of the year. The interest rate will rise via the increased prices. • Price-level effect remains even after prices have stopped rising. • A rising price level will raise interest rates because people will expect inflation to be higher over the course of the year. When the price level stops rising, expectations of inflation will return to zero. • Expected-inflation effect persists only as long as the price level continues to rise. Copyright © 2010 Pearson Education. All rights reserved. 5 -32
 Lower Interest Rates(降低利率)? •")
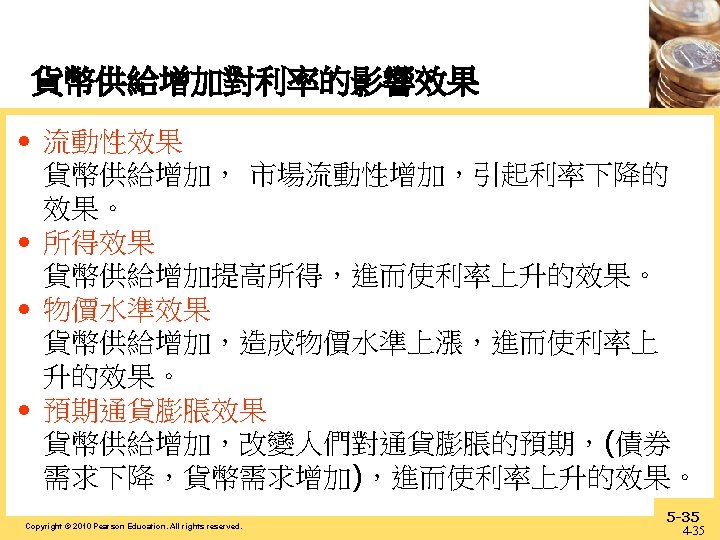
Does a Higher Rate of Growth of the Money Supply(貨幣成長率較高) Lower Interest Rates(降低利率)? • Liquidity preference framework leads to the conclusion that an increase in the money supply will lower interest rates: the liquidity effect(流動性效果). • Income effect(所得效果) finds interest rates rising because increasing the money supply is an expansionary influence on the economy (the demand curve shifts to the right). Copyright © 2010 Pearson Education. All rights reserved. 5 -33
")
Does a Higher Rate of Growth of the Money Supply Lower Interest Rates? (cont’d) • Price-Level effect predicts an increase in the money supply leads to a rise in interest rates in response to the rise in the price level (the demand curve shifts to the right). • Expected-Inflation effect shows an increase in interest rates because an increase in the money supply may lead people to expect a higher price level in the future (the demand curve shifts to the right). Copyright © 2010 Pearson Education. All rights reserved. 5 -34
 Liquidity effect larger than other effects")
Interest Rate, i i 1 i 2 (a) Liquidity effect larger than other effects T Liquidity Income, Price-Level, and Expected. Effect inflation Effects Interest Rate, i Figure 11 Response over Time to an Increase in Money Supply Growth Time i 2 i 1 (b) Liquidity effect smaller than other effects and slow adjustment of expected inflation T Time Liquidity Income, Price-Level, Effect and Expectedinflation Effects Interest Rate, i i 2 i 1 (c) Liquidity effect smaller than expected-inflation effect and fast adjustment of expected inflation T Time Liquidity and Income and Price. Level Effects expectedinflation Effect Copyright © 2010 Pearson Education. All rights reserved. 5 -36
 and Interest Rates (Three-Month Treasury Bills),")
Figure 12 Money Growth (M 2, Annual Rate) and Interest Rates (Three-Month Treasury Bills), 1950– 2014 Source: Federal Reserve Bank of St. Louis FRE D database: http: //research. stlouisfed. org/fred 2 Copyright © 2010 Pearson Education. All rights reserved. 5 -37
- Slides: 37